You've learned Six Sigma theory. You know when to run a capability analysis, perform a Gage R&R, or conduct a t-test. But when you open Minitab, hesitation creeps in. Hours are lost scrolling through confusing menus, struggling with messy data imports, and wondering which graph best communicates your findings. Meanwhile, your colleagues who've completed professional Minitab training courses produce precise insights in minutes, gaining the reputation of being "data-driven" experts. Your analysis might be correct in theory - but without fluency in the software, your credibility takes the hit. That's exactly why our Minitab certification course online exists. This isn't a generic, button-clicking software tutorial that parrots the help menu. Our Minitab training certification is designed and delivered by practicing Master Black Belts - professionals who've used Minitab to achieve multi-crore savings across Woburn, MA manufacturing plants, service industries, and corporate operations. You don't just learn what button to click - you learn why to click it, how to interpret every line of the session window output, and how to turn raw data into visual stories that decision-makers understand instantly. Our Minitab course online builds fluency, not just familiarity. You'll learn to handle the kind of messy, real-world data that never fits the clean textbook examples. You'll master advanced functions like Design of Experiments, regression modeling, and control chart interpretation. The course also teaches you to create professional-quality reports and automate repetitive analysis tasks - skills that make you indispensable in a data-driven organization. Completing the Minitab certification course isn't just about earning another credential - it's about transforming how you work. After this Minitab training, you won't just "use" the software; you'll command it with confidence. You'll become the go-to expert in your team - the person who can translate complex data into decisive business action with clarity, speed, and precision.
Minitab Training Program Overview in Woburn, MA
Minitab Training Course Highlights in Woburn, MA
More Than a Course- It's" Your Career Accelerator
Hands-On Lab for Every Module
Learn by doing with practical, real-world exercises that build muscle memory and true proficiency, not just theoretical knowledge.
Taught by Master Black Belts
Learn from elite practitioners who use Minitab to solve complex business problems daily, not academics who only know the software's features.
Real-World Datasets
Work with messy, imperfect datasets from Woburn, MA manufacturing, IT, and service sectors, preparing you for the challenges you'll actually face on the job.
Focus on Interpretation, Not Just Execution
Master the critical skill of translating complex statistical output from the session window into clear, actionable business recommendations.
Flexible Training Schedules
Choose from weekend-only batches, weekday evening sessions, or intensive bootcamps designed around your professional commitments - no career breaks required.
24x7 Expert Support
Get your Minitab questions answered around the clock by certified experts, ensuring you never get stuck on a technical issue or statistical concept.
Upcoming Schedule
Why Get Certified with Minitab Training?
The Credential That Ends the Gatekeeping
Stop looking slow and inefficient.
Gain the speed and fluency in Minitab that marks you as a true professional.
End the imposter syndrome.
Gain the confidence to not only run analyses but to defend your interpretations to skeptical stakeholders.
Become the go-to data analysis expert on your team.
Earn the credibility to influence key process decisions.
Who This Program Is For
This certification training is ideal for:
Quality Engineers & Managers
Six Sigma Green Belts & Black Belts
Process & Manufacturing Engineers
Data Analysts & Business Analysts
R&D Professionals
If you are expected to analyze data to solve problems, this program is engineered to make you proficient with the tool the entire industry uses.
Growth
The Minitab Training Program is designed to equip professionals with the knowledge and skills required to analyze and interpret complex data sets using statistical techniques and data visualization tools. In Woburn, MA's financial sector, the effective use of data analysis can inform investment decisions, drive portfolio management, and optimize risk assessment. Data mining and predictive analytics are key components of the Minitab Training Program, enabling professionals to identify trends, patterns, and correlations within large data sets. By leveraging data mining tools, such as decision trees and clustering algorithms, professionals can create predictive models that drive business growth.
In financial settings, data mining and predictive analytics can help professionals identify areas for investment, manage risk, and optimize portfolio performance. By applying the skills learned through the Minitab Training Program, professionals can drive meaningful change and improve investment outcomes, ultimately enhancing the organization's reputation and brand. The Minitab Training Program focuses on developing the skills required to collect, manage, and analyze complex data sets using statistical techniques and data visualization tools. Key concepts include hypothesis testing, regression analysis, and time-series analysis, which enable professionals to model complex systems and identify trends within their data.
Professionals trained through the Minitab Training Program are well-equipped to handle a wide range of statistical challenges, from hypothesis testing and confidence intervals to data visualization and predictive analytics. By integrating these skills into their workflow, professionals can drive business growth, optimize processes, and make informed decisions that drive profitability.
Eligibility and prerequisites
This certification is designed to build a practical skill. Unlike methodology certifications, the requirements are focused on your willingness to learn and practice, not on years of prior experience.
No Formal Experience Required: While a background in quality or data analysis is helpful, it is not a prerequisite. The program is designed to build your skills from a foundational level.
Access to Minitab Software: You will need a working version of Minitab Statistical Software on your computer to participate in the hands-on labs. We provide guidance on obtaining the free trial version.
Completion of Training Program: You must complete our full training curriculum to be eligible to sit for the certification exam.
Work Responsibilities
The Minitab Training Program offers a comprehensive understanding of statistical techniques and data visualization tools, equipping professionals with the knowledge and skills required to analyze and interpret complex data sets. In Woburn, MA's engineering sector, the effective use of data analysis can inform product design, drive innovation, and optimize manufacturing processes. Design of experiments and statistical process control are key components of the Minitab Training Program, enabling professionals to identify trends, patterns, and correlations within their data. By leveraging design of experiments tools, such as factorial designs and response surface methodology, professionals can optimize product design and manufacturing processes.
In engineering settings, design of experiments and statistical process control can help professionals identify areas for improvement, optimize product quality, and reduce waste. By applying the skills learned through the Minitab Training Program, professionals can drive meaningful change and improve product performance, ultimately enhancing the organization's reputation and brand. The Minitab Training Program focuses on developing the skills required to collect, manage, and analyze complex data sets using statistical techniques and data visualization tools. Key concepts include regression analysis, ANOVA, and time-series analysis, which enable professionals to model complex systems and identify trends within their data.
Professional trained through the Minitab Training Program are well-equipped to handle a wide range of statistical challenges, from hypothesis testing and confidence intervals to data visualization and design of experiments. By integrating these skills into their workflow, professionals can drive business growth, optimize processes, and make informed decisions that drive profitability. _
Skills You Will Gain In Our Minitab Training Program in Woburn, MA
Data Manipulation & Cleaning
Stop struggling with messy data. Learn to import, stack, unstack, sort, and clean real-world datasets so your analysis is built on a solid foundation.
Statistical Process Control (SPC)
Go beyond just creating control charts. Master the art of interpreting patterns, identifying special causes, and using SPC to maintain process stability.
Measurement System Analysis (MSA)
Execute Gage R&R studies correctly to validate your data collection systems. Confidently determine if your measurement error is obscuring your process variation.
Hypothesis Testing
End the guesswork. Learn to select and execute the right statistical test (t-tests, ANOVA, Chi-Square) to make data-driven decisions with statistical confidence.
Design of Experiments (DOE)
Master the most powerful tool in Minitab. Learn to set up, analyze, and interpret factorial and response surface experiments to optimize your processes systematically.
Graphical Analysis & Reporting
Create clear, compelling graphs - from box plots to contour plots - that tell a story. Learn to customize and export them for impactful presentations to leadership.
Course Modules & Curriculum
Minitab Foundations & Data Handling
Lesson 1: Navigating the Minitab Environment
Start your journey by mastering the Minitab interface:Session Window, Worksheet, Project Manager, and Graph Window. You'll learn to configure settings, manage projects, and use Minitab's powerful Assistant feature to guide your statistical analysis. This part of the Minitab training courses helps you become comfortable with the workspace so you can focus on analysis instead of navigation.
Lesson 2: Data Import & Manipulation
Learn to import data from Excel, text files, and databases without errors. Master essential data handling skills like stacking/unstacking columns, sorting, ranking, and using the calculator for transformations.
Lesson 3: Data Types & Formatting
Understand the critical difference between numeric, text, and date/time data types. Learn to format columns correctly, use formulas to clean messy data, and prepare your worksheet for analysis.
Basic Analysis & Graphical Tools
Lesson 1: Descriptive Statistics & Graphical Summaries
Move beyond averages. Generate comprehensive statistical summaries and create insightful graphical summaries that provide a complete picture of your data's distribution, central tendency, and spread.
Lesson 2: Root Cause Analysis Graphics
Master the essential graphical tools for problem-solving. Build effective Pareto charts to focus on the vital few, and create detailed Cause-and-Effect diagrams directly within Minitab.
Lesson 3: Data Distribution & Relationship Analysis
Visualize your data like a pro. Create histograms, box plots, and scatter plots to understand distributions, identify outliers, and explore relationships between variables.
Statistical Process Control & MSA
Lesson 1: Control Charts for Variables Data
Learn to select, create, and interpret the correct control charts (Xbar-R, I-MR) for continuous data. Master the rules for identifying special causes and out-of-control conditions.
Lesson 2: Control Charts for Attributes Data
Monitor defect and defective rates effectively using P, NP, C, and U charts. Understand the assumptions behind each chart and how to apply them to your quality data.
Lesson 3: Measurement System Analysis (MSA)
Execute and interpret a Gage R&R study (Crossed and Nested) to validate your measurement system. Confidently determine your data's trustworthiness before making critical business decisions.
Hypothesis Testing & Regression
Lesson 1: Process Capability Analysis
Determine if your process is capable of meeting customer specifications. Calculate and interpret Cp, Cpk, Pp, and Ppk for both normal and non-normal data using Minitab's powerful capability tools.
Lesson 2: Hypothesis Testing in Practice
Here's where data-driven decision-making comes alive. You'll master how to perform 1-Sample, 2-Sample, and Paired t-tests, along with ANOVA, to statistically compare means and validate hypotheses. With guidance from expert instructors in our Minitab training courses, you'll learn to interpret p-values correctly, separate signal from noise, and draw confident conclusions that stand up to executive or client scrutiny.
Lesson 3: Correlation & Simple Linear Regression
Quantify the relationship between variables. Perform correlation analysis to understand the strength and direction of relationships and build regression models to make predictions based on your data.
Advanced Analysis & DOE
Lesson 1: Multiple Regression Analysis
Build predictive models with multiple input variables. Learn to interpret coefficients, R-squared, and residual plots to create a statistically valid and practically useful regression model.
Lesson 2: Design of Experiments (DOE) - Factorial Designs
Master the most powerful process improvement tool. Design, analyze, and interpret full and fractional factorial experiments in Minitab to identify critical factors and interactions that impact your process output.
Lesson 3: Introduction to Response Surface Methodology (RSM)
Learn how to use RSM to find the optimal settings for your process variables. Create contour plots and optimization plots to identify the sweet spot for peak performance.
Minitab Training Program Roadmap in Woburn, MA


Practical Application
The Minitab Training Program offers hands-on experience with statistical analysis and data visualization to ensure practical application of its techniques. By mastering Minitab's tools and features, professionals can effectively analyze and interpret complex data sets, identify trends, and make informed decisions. This expertise enables them to optimize processes, reduce costs, and drive business growth. The application of statistical techniques in Minitab Training Program is rooted in hypothesis testing and confidence intervals, allowing professionals to measure and evaluate the reliability of their results. In addition, data visualization tools, such as bar charts and scatter plots, facilitate the communication of findings and insights to stakeholders. By leveraging these statistical methods, professionals can unlock new insights and patterns within their organization's data.
In Woburn, MA's manufacturing sector, the ability to analyze and optimize production processes is crucial for maintaining a competitive edge. By applying the skills learned through the Minitab Training Program, professionals can improve product quality, reduce waste, and enhance overall efficiency. This expertise also enables them to identify opportunities for innovation and improvement, driving business growth and profitability. Minitab Training Program focuses on the intersection of data analysis, visualization, and statistical techniques to equip professionals with a comprehensive understanding of data-driven decision-making. Key concepts include regression analysis, ANOVA, and time-series analysis, which enable professionals to model complex systems and identify trends within their data. This expertise also prepares professionals to effectively communicate their findings to stakeholders, ensuring that data-driven insights are actionable and influential.
Professionals trained through the Minitab Training Program are well-equipped to handle a wide range of statistical challenges, from hypothesis testing and confidence intervals to regression analysis and data visualization. By integrating these skills into their workflow, professionals can drive business growth, optimize processes, and make informed decisions that drive profitability. This expertise also positions professionals as valuable assets within their organization, enabling them to contribute meaningfully to business strategy and decision-making. _
Industry Applicability
The Minitab Training Program is designed to equip professionals with the skills required to analyze and interpret complex data sets using statistical techniques and data visualization tools. In Woburn, MA's healthcare industry, the effective use of data analysis can inform patient outcomes, drive research, and improve operational efficiency. Data visualization plays a critical role in communicating findings and insights to stakeholders, enabling professionals to identify trends, patterns, and correlations within their data. By leveraging visualization tools, such as scatter plots and bar charts, professionals can create compelling stories with their data and drive business growth.
In healthcare settings, data visualization can help professionals identify areas for improvement, track patient outcomes, and optimize resource allocation. By applying the skills learned through the Minitab Training Program, professionals can drive meaningful change and improve patient care, ultimately enhancing the organization's reputation and brand. The Minitab Training Program focuses on developing the skills required to collect, manage, and analyze complex data sets using statistical techniques and data visualization tools. Key concepts include regression analysis, ANOVA, and time-series analysis, which enable professionals to model complex systems and identify trends within their data.
Professional trained through the Minitab Training Program are well-equipped to handle a wide range of statistical challenges, from hypothesis testing and confidence intervals to data visualization and regression analysis. By integrating these skills into their workflow, professionals can drive business growth, optimize processes, and make informed decisions that drive profitability. _
Customer Testimonials
Hear from our successful graduates
"Exceptional PMP Training Experience with iCertGlobal I recently completed the PMP training by iCertGlobal, and I must say it was an outstanding experience. The instructor demonstrated a deep understanding of project management principles and brought real-world experience to the table. The training material's provided were comprehensive and well-organized, offering valuable insights and practical tips. I would highly recommend iCertGlobal to anyone looking for professional PMP Training.. "

John Anderson
"iCertGlobal provided a great learning experience with clear, well organised courses. The trainers were knowledgeable, and the support team was responsive to all my questions. The study material was comprehensive, which helped me pass my certification exam with ease. Highly recommended for anyone looking to get certified. "
James Walsh
"iCertGlobal is the best Certificate Training Organization. you will get good instructor and they will improve leaning sills and give the real time experience examples due to that you will get pass in first try. "
Andy Moran
"The course content, exam prep questions, interactive Q&A, and real-life examples made attending this PMP Project Management training class worth my time and money. The support from iCertGlobal was exceptional and I would like to thank them for accepting my request of meeting the trainer post the session for clearing my doubts."
Tim Malone
"I had a good learning experience with icertGlobal and it had been an amazing development journey. Actually, I accidentally bumped into iCertGlobal while searching for an online course for preparing my PMP examination. With positive reviews all over the internet and quick responses to my questions, I was flabbergasted enough to sign-up immediately. The instructor-led PMP preparatory course helped me both offline and online preparations. All the high-quality materials written in simple layman language was enough to grasp the gist of various topics. The instructors were very knowledgeable as they imparted not only their wealth of experiences but also real life examples. Thanks a lot iCertGlobal for imbibing this great learning experience. "
Jason Walter
"Thank you for your great course, great support, rapid response and excellent service."
Hoda Alavi
"My trainer made the materials relatable and easy to understand. It was fun being in class everyday. "
Cassandra Corn
"Amazing trainer who was very supportive. "

Shanna Pilgrim
"Trainer was well versed in the subject matter and got the impression the gentleman was professional and educated within standards and procedures for PMI. "
Anthony Zamora
"The Training was good and customer service was perfect. "
Maka Diakhate
"Trainer was knowledgeable and lesson's pace was just right."

Roger Gonzales
"Trainer (Bruce) was very excellent in delivery and presentation. He provided me with all the tools required to be successful in the PMP exams with lots of quiz questions on all topics reviewed. "
Bashiru Ojibara
"The trainer, Emad was top notch and very knowledgeable. He is up to date with all current versions and is great in 1:1 Training. "

Jonathan Obien
"Thank you for your great course, great support, rapid response and excellent service"

Hoda Alavi
"Marc had very good knowledge and he was able to explain the material and provide guidance to get ready for the test. "

Roque Montesino
"Excellent Course. Zahn was a great instructor and the course material definitely will help me pass the PMP Exam "

Jared Nelson
"Great teacher, went out of his way in every possible aspect. "
Radiah Sims
"Customer service provided by Robin was great as he was very responsive and the trainer, John, was very good at relating the content to my industry. "

Jason D Niebauer
Corporate Training
Tailored programs for teams with enterprise support

Ready to transform your team?
Get a custom quote for your organization's training needs.
Course & Support
Everything you need to know about our training options and support
Career Relevance
The Minitab Training Program is designed to equip professionals with the knowledge and skills required to analyze and interpret complex data sets using statistical techniques and data visualization tools. Career relevance is a key focus area of the program, enabling professionals to drive business growth, optimize processes, and make informed decisions.
By mastering Minitab's tools and features, professionals can communicate their findings and insights to stakeholders, driving business growth and profitability. Key concepts include data visualization, regression analysis, and time-series analysis, which enable professionals to model complex systems and identify trends within their data.
In Woburn, MA's consulting industry, the ability to
Build In-Demand Skills
Explore our instructor-led Minitab training to learn about the course duration, cost, eligibility, and certification process. You get practical learning, exam-focused preparation, and expert guidance. Ready to get started? Compare Minitab certification training options and choose a classroom or live online format that fits your schedule.
Minitab Training in Other Cities
Our Minitab certification training is available in major cities worldwide
Related Blogs
Stay updated with the latest insights and trends in your field

Is a Six Sigma Belt Still Worth It
Discover if a Six Sigma certification is worth it for your career in 2027. Learn the salary impact,...

Lean Six Sigma Green Belt and Black Belt
Discover the true Lean Six Sigma certification cost for Green and Black Belts. Compare exam fees, career ROI,...
DMAIC Explained Through a Realistic Process Improvement Example
Master the DMAIC process with a practical, step-by-step example. Learn how to solve process issues, pass your exam,...
How to Select a Lean Six Sigma Project
Learn how to identify and execute high-impact projects. Master Lean Six Sigma project selection to drive business results...

Six Sigma Belt Levels Explained: Yellow, Green, and
Advance your career by mastering Six Sigma belt levels. Learn the differences between Yellow, Green, and Black Belts...

How to Prepare for the Six Sigma Green
Master the DMAIC methodology and pass your Six Sigma Green Belt Certification Exam. Learn proven study strategies to...
10 Industries Where Lean Six Sigma Green Belt
Advance your career with Lean Six Sigma Green Belt skills. Explore the top 10 industries actively hiring certified...

Understanding Key Lean Six Sigma Principles for Exam
Master essential lean six sigma principles to pass your certification exam, eliminate process waste, and advance your career....
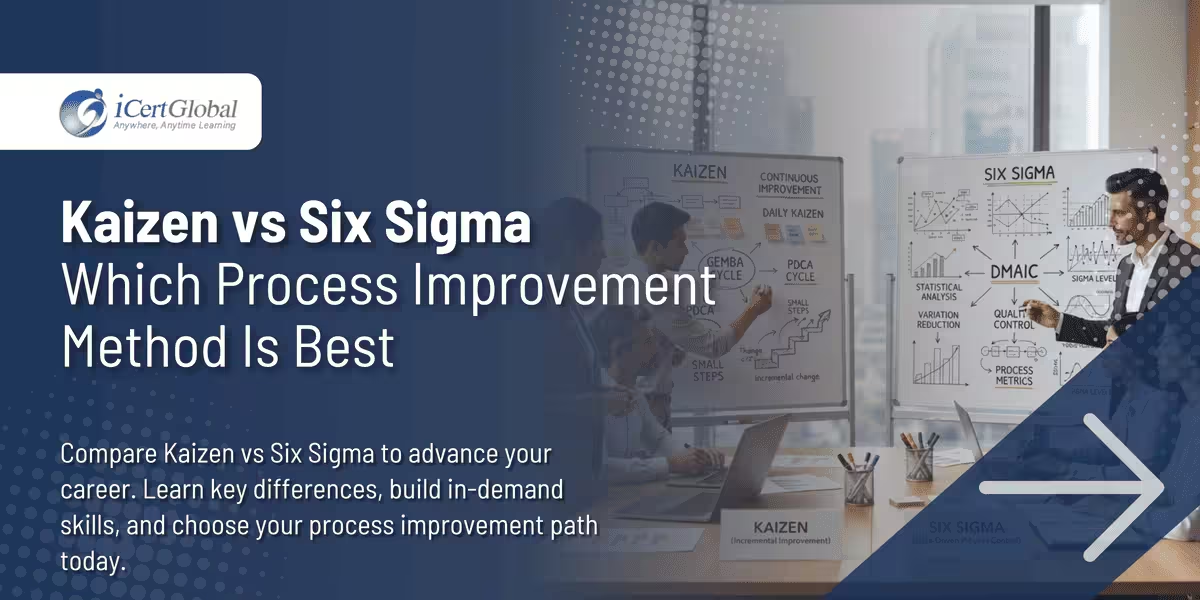
Kaizen vs Six Sigma Which Process Improvement Method
Compare Kaizen vs Six Sigma to advance your career. Learn key differences, build in-demand skills, and choose your...
Six Sigma vs TQM: Key Differences Explained
Advance your career by mastering quality management. Discover the key differences between Six Sigma and TQM to choose...