Quick Enquiry Form
Categories
- Agile and Scrum (237)
- BigData (43)
- Business Analysis (97)
- Cirtix Client Administration (55)
- Cisco (63)
- Cloud Technology (117)
- Cyber Security (68)
- Data Science and Business Intelligence (66)
- Developement Courses (56)
- DevOps (17)
- Digital Marketing (66)
- Emerging Technology (209)
- IT Service Management (79)
- Microsoft (54)
- Other (396)
- Project Management (518)
- Quality Management (154)
- salesforce (67)
Latest posts
AWS Basics What is Amazon..
.webp)
Blockchain Categories and Why They..
.png)
Top Tableau Q and A..
.jpg)


Free Resources
Subscribe to Newsletter
Top Tableau Q and A for Freshers and Experts in 2025
In this Tableau interview questions and answers blog, I have put together the most usual interview questions. The questions were taken from interviews with professionals who work on data analysis and chart or graph design. If you'd like to work your way through the basics of Tableau (which I recommend doing prior to reading this list of interview questions for beginners and experts), work your way through the Tableau Tutorial blog.
1. What are Traditional BI Tools, and how do they differ from Tableau?
Following is a general comparison of how Traditional Business Intelligence (BI) Tools vary from Tableau:
- Legacy BI Tools/Tableau
- Rely greatly on hardware and hence less adaptable.
- No hardware dependency—more flexible and scalable.
- Constructed using an integration of several various technologies. Employs quick and dynamic associative search technology.

- Usually do not facilitate multi-core processing or in-memory computing.
- Supports in-memory computing when combined with modern technologies.
- Provides a fixed view of the data, limiting the scope of analysis.
- Supports predictive analysis to enable more intelligent business decisions.
2. What is Tableau?
Tableau is a robust business intelligence (BI) and data visualization software that enables one to visualize his or her data easily and succinctly. It:
• Conveniently interfaces with different kinds of data sources.
• Transforms raw data into sharable and interactive visual reports.
•Streamlines user decision-making with simple dashboards and clear data stories.
3. What are the Various Tableau Products and the Latest Version?
Tableau Online is the cloud-based version of Tableau Server. Below is a brief overview of each of them:
1. Tableau Desktop
Tableau Desktop is a program which enables you to create charts, graphs, and dashboards without needing to write code. You can connect to your data sources directly, analyze live data, and create interactive reports. It allows you to bring data from numerous different sources and bring them all together in one location.
2. Tableau Server
Tableau Server is for companies. Once you build dashboards in Tableau Desktop, you can share and publish them securely with your staff members through Tableau Server. It has live data and enables teams to make faster decisions.

3. Tableau Online
Tableau Online is the cloud offering of Tableau Server. Nothing to install—Tableau hosts it. Simply publish your dashboards from Tableau Desktop and share them with others online, anywhere.
4. Tableau Public
Tableau Public is free. You can publish and share visualizations, but your work is hosted online and available to everyone. It is suitable for learning or publishing public data, but not private business data.
4. What are the Various Types of Data in Tableau?
Tableau has various data types. Each data type assists Tableau to understand how to show and handle the data. The below are the primary data types supported by Tableau:
1. Text (String)
Used for words, names, sets, or for any combination of numbers and letters (e.g., "New York," "Product A").
2. Whole and Decimal Numbers
• Integer (Whole Number) – For counting (e.g., 100, -5)
• Decimal (Floating Point) – For numbers with decimals (e.g., 10.5, 3.14)
3. Date and Date & Time
Applied to calendar dates:
• Date – i.e., 2025-06-30
• Date & Time – i.e., 2025-06-30 14:30:00
4. Boolean
A value of true or false. Used in logic-based areas and filters.

5. Geography
• Used to plot data. Contains fields like:
• Country
• Region/Area
• Town
• Zip code
• Latitude/Longitude
6. Cluster Group (Generated)
Provided when Tableau groups similar data points. These are not typed out manually; instead, Tableau gives them whenever it does cluster or group analysis.
5. What Are Measures and Dimensions in Tableau?
In Tableau, data is separated into Measures and Dimensions:
Sizes
• They are descriptive fields—such as names, dates, or categories.
• They define "what" the data is describing (e.g., Product Name, Country, or Category).
• Dimensions allow you to slice and aggregate data in your charts.
• For example, a Product dimension can have Product Name, Type, and Color.
Steps
• These are numbers that can be added up or counted—such as totals, averages, or numbers.
• Measurements are employed to perform calculations and analysis.
• Example: Sales, Quantity Sold, and Profit are indicators.
Quick Example:
In a Sales dataset:
• Dimensions = Customer Name, Region, Product Category
• Measurements = Total Sales, Units Sold, Profit Margin
6. What is the difference between .twb and .twbx files in Tableau?
- File Type Description
- .twb (Tableau Workbook)
- An XML file that contains your visualizations, layouts, and settings but not the data.
- .twbx (Tableau Packaged Workbook) is a zipped file containing the .twb file along with any data sources, images, or custom components. It is optimal to share.
- Tip: Use .twbx when you export your work to another individual—it keeps it all together.
7 . What different join methods can you use in Tableau?
Similar to SQL, Tableau also has four primary join types to combine information from two tables:
- Join Type Explanation
- Inner Join
- Returns only the matching rows from both tables.
- Left Join includes all records from the left table and matched records from the right table.
- Right Join produces the rows from the right table and the matching rows from the left table.
- Full Outer Join
- Produces all rows if there is a match in the left or the right table.
- These joins help you combine datasets to produce more informed visuals and findings.
8. How Many Tables Can I Join in Tableau?
In Tableau, you are allowed to join a maximum of 32 tables within a single data source. This assists in building rich datasets by joining various tables, such as joins in SQL.
9. What are the Various Types of Data Connections in Tableau?
Tableau connects you to your data in two primary ways:
1. Live Link
• Points directly to the data source.
• Queries the database in real-time.
• Displays latest data automatically.
• Helpful when dealing with ever-changing data.
2. Extract Connection
• Generates a static version of your data.
• Stored in Tableau's high-performance, in-memory data engine.
• Is updated manually or updated at regular intervals.
• Offline-capable—ideal for performance and portability.
Which to Use
• Use Live when you want updates immediately.
• Use Extract when performance is critical or if you're operating offline.
10. What Is Shelves in Tableau?
Shelves are special spaces in Tableau where you can drag data fields in an effort to construct your visuals.
Shared Shelves:
• Columns Shelf – Places data fields along the top (horizontal axis).
• Rows Shelf – Places data fields along the side (y-axis).
• Shelf Filters – Displays filtered data in the view.
• Pages Shelf – Splits a view into multiple pages.
• Marks Card – Determines the way marks appear (colour, size, label, etc.).
Note: Certain shelves appear only if you select specific mark types (such as bar, line, or circle).
How to obtain Tableau certification?
We are an Education Technology company providing certification training courses to accelerate careers of working professionals worldwide. We impart training through instructor-led classroom workshops, instructor-led live virtual training sessions, and self-paced e-learning courses.
We have successfully conducted training sessions in 108 countries across the globe and enabled thousands of working professionals to enhance the scope of their careers.
Our enterprise training portfolio includes in-demand and globally recognized certification training courses in Project Management, Quality Management, Business Analysis, IT Service Management, Agile and Scrum, Cyber Security, Data Science, and Emerging Technologies. Download our Enterprise Training Catalog from https://www.icertglobal.com/corporate-training-for-enterprises.php and https://www.icertglobal.com/index.php
Popular Courses include:
-
Project Management: PMP, CAPM ,PMI RMP
-
Quality Management: Six Sigma Black Belt ,Lean Six Sigma Green Belt, Lean Management, Minitab,CMMI
-
Business Analysis: CBAP, CCBA, ECBA
-
Agile Training: PMI-ACP , CSM , CSPO
-
Scrum Training: CSM
-
DevOps
-
Program Management: PgMP
-
Cloud Technology: Exin Cloud Computing
-
Citrix Client Adminisration: Citrix Cloud Administration
The 10 top-paying certifications to target in 2025 are:
Conclusion
Tableau is an excellent tool to present data in a graphical manner. It has handy features such as dashboards, data connections, and interactive reports. Knowledge of the key concepts such as dimensions, measures, sets, and joins prepares you to produce useful insights. Knowledge of these fundamentals prepares you for Tableau interviews and real-world use.
Contact Us For More Information:
Visit :www.icertglobal.com Email : 


Read More
In this Tableau interview questions and answers blog, I have put together the most usual interview questions. The questions were taken from interviews with professionals who work on data analysis and chart or graph design. If you'd like to work your way through the basics of Tableau (which I recommend doing prior to reading this list of interview questions for beginners and experts), work your way through the Tableau Tutorial blog.
1. What are Traditional BI Tools, and how do they differ from Tableau?
Following is a general comparison of how Traditional Business Intelligence (BI) Tools vary from Tableau:
- Legacy BI Tools/Tableau
- Rely greatly on hardware and hence less adaptable.
- No hardware dependency—more flexible and scalable.
- Constructed using an integration of several various technologies. Employs quick and dynamic associative search technology.
- Usually do not facilitate multi-core processing or in-memory computing.
- Supports in-memory computing when combined with modern technologies.
- Provides a fixed view of the data, limiting the scope of analysis.
- Supports predictive analysis to enable more intelligent business decisions.
2. What is Tableau?
Tableau is a robust business intelligence (BI) and data visualization software that enables one to visualize his or her data easily and succinctly. It:
• Conveniently interfaces with different kinds of data sources.
• Transforms raw data into sharable and interactive visual reports.
•Streamlines user decision-making with simple dashboards and clear data stories.
3. What are the Various Tableau Products and the Latest Version?
Tableau Online is the cloud-based version of Tableau Server. Below is a brief overview of each of them:
1. Tableau Desktop
Tableau Desktop is a program which enables you to create charts, graphs, and dashboards without needing to write code. You can connect to your data sources directly, analyze live data, and create interactive reports. It allows you to bring data from numerous different sources and bring them all together in one location.
2. Tableau Server
Tableau Server is for companies. Once you build dashboards in Tableau Desktop, you can share and publish them securely with your staff members through Tableau Server. It has live data and enables teams to make faster decisions.
3. Tableau Online
Tableau Online is the cloud offering of Tableau Server. Nothing to install—Tableau hosts it. Simply publish your dashboards from Tableau Desktop and share them with others online, anywhere.
4. Tableau Public
Tableau Public is free. You can publish and share visualizations, but your work is hosted online and available to everyone. It is suitable for learning or publishing public data, but not private business data.
4. What are the Various Types of Data in Tableau?
Tableau has various data types. Each data type assists Tableau to understand how to show and handle the data. The below are the primary data types supported by Tableau:
1. Text (String)
Used for words, names, sets, or for any combination of numbers and letters (e.g., "New York," "Product A").
2. Whole and Decimal Numbers
• Integer (Whole Number) – For counting (e.g., 100, -5)
• Decimal (Floating Point) – For numbers with decimals (e.g., 10.5, 3.14)
3. Date and Date & Time
Applied to calendar dates:
• Date – i.e., 2025-06-30
• Date & Time – i.e., 2025-06-30 14:30:00
4. Boolean
A value of true or false. Used in logic-based areas and filters.
5. Geography
• Used to plot data. Contains fields like:
• Country
• Region/Area
• Town
• Zip code
• Latitude/Longitude
6. Cluster Group (Generated)
Provided when Tableau groups similar data points. These are not typed out manually; instead, Tableau gives them whenever it does cluster or group analysis.
5. What Are Measures and Dimensions in Tableau?
In Tableau, data is separated into Measures and Dimensions:
Sizes
• They are descriptive fields—such as names, dates, or categories.
• They define "what" the data is describing (e.g., Product Name, Country, or Category).
• Dimensions allow you to slice and aggregate data in your charts.
• For example, a Product dimension can have Product Name, Type, and Color.
Steps
• These are numbers that can be added up or counted—such as totals, averages, or numbers.
• Measurements are employed to perform calculations and analysis.
• Example: Sales, Quantity Sold, and Profit are indicators.
Quick Example:
In a Sales dataset:
• Dimensions = Customer Name, Region, Product Category
• Measurements = Total Sales, Units Sold, Profit Margin
6. What is the difference between .twb and .twbx files in Tableau?
- File Type Description
- .twb (Tableau Workbook)
- An XML file that contains your visualizations, layouts, and settings but not the data.
- .twbx (Tableau Packaged Workbook) is a zipped file containing the .twb file along with any data sources, images, or custom components. It is optimal to share.
- Tip: Use .twbx when you export your work to another individual—it keeps it all together.
7 . What different join methods can you use in Tableau?
Similar to SQL, Tableau also has four primary join types to combine information from two tables:
- Join Type Explanation
- Inner Join
- Returns only the matching rows from both tables.
- Left Join includes all records from the left table and matched records from the right table.
- Right Join produces the rows from the right table and the matching rows from the left table.
- Full Outer Join
- Produces all rows if there is a match in the left or the right table.
- These joins help you combine datasets to produce more informed visuals and findings.
8. How Many Tables Can I Join in Tableau?
In Tableau, you are allowed to join a maximum of 32 tables within a single data source. This assists in building rich datasets by joining various tables, such as joins in SQL.
9. What are the Various Types of Data Connections in Tableau?
Tableau connects you to your data in two primary ways:
1. Live Link
• Points directly to the data source.
• Queries the database in real-time.
• Displays latest data automatically.
• Helpful when dealing with ever-changing data.
2. Extract Connection
• Generates a static version of your data.
• Stored in Tableau's high-performance, in-memory data engine.
• Is updated manually or updated at regular intervals.
• Offline-capable—ideal for performance and portability.
Which to Use
• Use Live when you want updates immediately.
• Use Extract when performance is critical or if you're operating offline.
10. What Is Shelves in Tableau?
Shelves are special spaces in Tableau where you can drag data fields in an effort to construct your visuals.
Shared Shelves:
• Columns Shelf – Places data fields along the top (horizontal axis).
• Rows Shelf – Places data fields along the side (y-axis).
• Shelf Filters – Displays filtered data in the view.
• Pages Shelf – Splits a view into multiple pages.
• Marks Card – Determines the way marks appear (colour, size, label, etc.).
Note: Certain shelves appear only if you select specific mark types (such as bar, line, or circle).
How to obtain Tableau certification?
We are an Education Technology company providing certification training courses to accelerate careers of working professionals worldwide. We impart training through instructor-led classroom workshops, instructor-led live virtual training sessions, and self-paced e-learning courses.
We have successfully conducted training sessions in 108 countries across the globe and enabled thousands of working professionals to enhance the scope of their careers.
Our enterprise training portfolio includes in-demand and globally recognized certification training courses in Project Management, Quality Management, Business Analysis, IT Service Management, Agile and Scrum, Cyber Security, Data Science, and Emerging Technologies. Download our Enterprise Training Catalog from https://www.icertglobal.com/corporate-training-for-enterprises.php and https://www.icertglobal.com/index.php
Popular Courses include:
-
Project Management: PMP, CAPM ,PMI RMP
-
Quality Management: Six Sigma Black Belt ,Lean Six Sigma Green Belt, Lean Management, Minitab,CMMI
-
Business Analysis: CBAP, CCBA, ECBA
-
Agile Training: PMI-ACP , CSM , CSPO
-
Scrum Training: CSM
-
DevOps
-
Program Management: PgMP
-
Cloud Technology: Exin Cloud Computing
-
Citrix Client Adminisration: Citrix Cloud Administration
The 10 top-paying certifications to target in 2025 are:
Conclusion
Tableau is an excellent tool to present data in a graphical manner. It has handy features such as dashboards, data connections, and interactive reports. Knowledge of the key concepts such as dimensions, measures, sets, and joins prepares you to produce useful insights. Knowledge of these fundamentals prepares you for Tableau interviews and real-world use.
Contact Us For More Information:
Visit :www.icertglobal.com Email :
.webp)
Power BI Interview Q and A Guide for 2025
Power BI is a common tool for data analysis and creating visual reports. It assists individuals in transforming intricate data into understandable and actionable insights in the form of dashboards and reports. As more businesses are reliant on data for making effective decisions, demand for Power BI experts is rising.
Basic Power BI Interview Questions
1. What is Power BI?
Power BI is a tool created by Microsoft that helps you work with data. You can bring in data from a large number of sources, clean it up, and build charts, graphs, and dashboards. You can use the visuals to uncover insights and make informed decisions. Access Power BI on your computer (Desktop), online via the cloud (Service), or through your smartphone (Mobile app).
2. What are the key components of Power BI?
Power BI has numerous tools by which you can work with data at ease. These are the primary components:
• Power Query: It assists you in retrieving data from various sources such as Excel, databases, or text files. You can also clean and shape the data to make it more usable.
• Power View: This enables you to create charts, tables, and graphs. It presents your data in a clear and fun manner, and you can filter to emphasize certain sections of the data.
• Power BI Desktop: It is a desktop tool where you can combine Power Query, Power View, and other features. It assists you in making reports and dashboards to better understand your data.
• Power BI Mobile: This is a mobile app available for Android, iOS, and Windows devices. It enables you to browse and share your reports and dashboards wherever you are.
• Power Map: This data visualization tool displays your data on a 3D map. You can see where the data is coming from, using locations like cities, states, or countries.
• Power Q&A: This feature lets you ask questions in simple English and receive answers instantly. It also gives you your replies in graphs or chart form, which is easier to understand.
3. What are the advantages of Power BI?
Power BI has numerous advantages:
• It is able to process a lot of data.
• You can create images, graphs, and charts from data using pre-formatted templates.

• It incorporates intelligent technology that gets better with frequent updates.
• You can even create your own dashboards to read and use.
• You can ask questions or do math in a unique language known as DAX.
4. What are the key differences between Power BI and Tableau?
Feature Power BI abd Tableau
Ease of Use
- Simpler to learn, particularly if you're used to Excel. Drag-and-drop functionality.
- Slightly harder to master, but gives more control over appearance.
Pricing
- Lower. Power BI Desktop is free; Pro is ~$10/month.
- Higher. Tableau Creator is ~$70/month.
- Power BI connects smoothly with Microsoft applications like Excel, Teams, and SharePoint. It integrates with most tools, but not as well with Microsoft.
Visuals
- Good visuals with interaction possibilities; there are also custom visuals.
- Better for intricate, custom, and high-end visuals.
- Performance is good with small and medium-sized data. It is able to process large data sets if configured properly.
Deployment
- Cloud-first, but you can host on your own servers too.
- Can be hosted on the cloud, on your servers, or online.
- Backed by an active Microsoft community and frequent feature updates. Also has a long-standing and active user base.
5. What is Power Query?
Power Query is something that assists you:
• Collect data from different sources
• Sanitize and update the data
• Integrate information from various places.
• Import the data into Power BI to visualize.
6. What is DAX?
DAX stands for Data Analysis Expressions. It is a formula language that is proprietary to Power BI. DAX enables you to:
• Learn complex math.
• Create your own tables and columns

• Formulate special reports using math and logic.
7. How is the attitude of people towards Power BI Desktop?
Power BI Desktop has four main views:
• Report View: Create reports and charts with graphics.
• Table View: View your data in a table (rows and columns) to sort, filter, or edit.
• Data View: Look at your real data carefully.
• Model View: Join different tables, calculate fields, and organize your data model.
8. In what way is a calculated column different from a measure?
• Calculated Column: This adds a new column to your table. It is calculated for each row when the data loads.
• Measure: A calculation only made when required, usually presented in charts or graphs. It is faster for large amounts or averages.
9. What is a Power BI dashboard?
A dashboard is a single page holding charts and graphics of multiple reports. It is a snapshot of key numbers (KPIs) and can be viewed only in Power BI Service (web version).
10. What are the filter types in Power BI?
• Visual-level filter: Changes a single chart or graph.
• Page-level filter: Modifies all the charts on one page.
• Report-level filter: Modifies every page within the report.

• Slicer: A graphical element that people can click to narrow down data.
• Drillthrough filter: Enables you to proceed to a different page with more details.
• Cross filter/highlight: Highlights data on clicking on visuals
11. What are the various methods of connecting in Power BI?
• Import: Data is duplicated and stored in Power BI.
• DirectQuery: Data does not move and is used right away.
• Live Connection: Analysis Services (SSAS) data is not cached in Power BI.
• Composite Model: Import and DirectQuery Integration.
12. Does Power BI accommodate Excel files?
Yes. You can connect Power BI to Excel files and bring in tables, named ranges, and even data models.
13. Can Power BI display data in real-time?
Yes. Power BI can present live updates through tools such as Azure Stream Analytics, streaming data, or REST APIs.
14. What is the Power BI Service?
It is Power BI in the cloud. You can use it to browse, share, and collaborate on reports and dashboards through a web browser.
15. Why is Power BI Desktop used?
Power BI Desktop is a free computer software. You may use it to make reports and dashboards. Developers and analysts use it before they publish their work on the internet.
How to obtain Power BI certification?
We are an Education Technology company providing certification training courses to accelerate careers of working professionals worldwide. We impart training through instructor-led classroom workshops, instructor-led live virtual training sessions, and self-paced e-learning courses.
We have successfully conducted training sessions in 108 countries across the globe and enabled thousands of working professionals to enhance the scope of their careers.
Our enterprise training portfolio includes in-demand and globally recognized certification training courses in Project Management, Quality Management, Business Analysis, IT Service Management, Agile and Scrum, Cyber Security, Data Science, and Emerging Technologies. Download our Enterprise Training Catalog from https://www.icertglobal.com/corporate-training-for-enterprises.php and https://www.icertglobal.com/index.php
Popular Courses include:
-
Project Management: PMP, CAPM ,PMI RMP
-
Quality Management: Six Sigma Black Belt ,Lean Six Sigma Green Belt, Lean Management, Minitab,CMMI
-
Business Analysis: CBAP, CCBA, ECBA
-
Agile Training: PMI-ACP , CSM , CSPO
-
Scrum Training: CSM
-
DevOps
-
Program Management: PgMP
-
Cloud Technology: Exin Cloud Computing
-
Citrix Client Adminisration: Citrix Cloud Administration
The 10 top-paying certifications to target in 2025 are:
CONCLUSION
Power BI is a potent device in data conversion into insights through the use of reports and dashboards. Preparation of interviews through the study of key concepts, tools, and features may assist you in securing employment in the data sector. With growing demand and decent salary, Power BI is a great career choice.
Contact Us For More Information:
Visit :www.icertglobal.com Email :
Read More
Power BI is a common tool for data analysis and creating visual reports. It assists individuals in transforming intricate data into understandable and actionable insights in the form of dashboards and reports. As more businesses are reliant on data for making effective decisions, demand for Power BI experts is rising.
Basic Power BI Interview Questions
1. What is Power BI?
Power BI is a tool created by Microsoft that helps you work with data. You can bring in data from a large number of sources, clean it up, and build charts, graphs, and dashboards. You can use the visuals to uncover insights and make informed decisions. Access Power BI on your computer (Desktop), online via the cloud (Service), or through your smartphone (Mobile app).
2. What are the key components of Power BI?
Power BI has numerous tools by which you can work with data at ease. These are the primary components:
• Power Query: It assists you in retrieving data from various sources such as Excel, databases, or text files. You can also clean and shape the data to make it more usable.
• Power View: This enables you to create charts, tables, and graphs. It presents your data in a clear and fun manner, and you can filter to emphasize certain sections of the data.
• Power BI Desktop: It is a desktop tool where you can combine Power Query, Power View, and other features. It assists you in making reports and dashboards to better understand your data.
• Power BI Mobile: This is a mobile app available for Android, iOS, and Windows devices. It enables you to browse and share your reports and dashboards wherever you are.
• Power Map: This data visualization tool displays your data on a 3D map. You can see where the data is coming from, using locations like cities, states, or countries.
• Power Q&A: This feature lets you ask questions in simple English and receive answers instantly. It also gives you your replies in graphs or chart form, which is easier to understand.
3. What are the advantages of Power BI?
Power BI has numerous advantages:
• It is able to process a lot of data.
• You can create images, graphs, and charts from data using pre-formatted templates.
• It incorporates intelligent technology that gets better with frequent updates.
• You can even create your own dashboards to read and use.
• You can ask questions or do math in a unique language known as DAX.
4. What are the key differences between Power BI and Tableau?
Feature Power BI abd Tableau
Ease of Use
- Simpler to learn, particularly if you're used to Excel. Drag-and-drop functionality.
- Slightly harder to master, but gives more control over appearance.
Pricing
- Lower. Power BI Desktop is free; Pro is ~$10/month.
- Higher. Tableau Creator is ~$70/month.
- Power BI connects smoothly with Microsoft applications like Excel, Teams, and SharePoint. It integrates with most tools, but not as well with Microsoft.
Visuals
- Good visuals with interaction possibilities; there are also custom visuals.
- Better for intricate, custom, and high-end visuals.
- Performance is good with small and medium-sized data. It is able to process large data sets if configured properly.
Deployment
- Cloud-first, but you can host on your own servers too.
- Can be hosted on the cloud, on your servers, or online.
- Backed by an active Microsoft community and frequent feature updates. Also has a long-standing and active user base.
5. What is Power Query?
Power Query is something that assists you:
• Collect data from different sources
• Sanitize and update the data
• Integrate information from various places.
• Import the data into Power BI to visualize.
6. What is DAX?
DAX stands for Data Analysis Expressions. It is a formula language that is proprietary to Power BI. DAX enables you to:
• Learn complex math.
• Create your own tables and columns
• Formulate special reports using math and logic.
7. How is the attitude of people towards Power BI Desktop?
Power BI Desktop has four main views:
• Report View: Create reports and charts with graphics.
• Table View: View your data in a table (rows and columns) to sort, filter, or edit.
• Data View: Look at your real data carefully.
• Model View: Join different tables, calculate fields, and organize your data model.
8. In what way is a calculated column different from a measure?
• Calculated Column: This adds a new column to your table. It is calculated for each row when the data loads.
• Measure: A calculation only made when required, usually presented in charts or graphs. It is faster for large amounts or averages.
9. What is a Power BI dashboard?
A dashboard is a single page holding charts and graphics of multiple reports. It is a snapshot of key numbers (KPIs) and can be viewed only in Power BI Service (web version).
10. What are the filter types in Power BI?
• Visual-level filter: Changes a single chart or graph.
• Page-level filter: Modifies all the charts on one page.
• Report-level filter: Modifies every page within the report.
• Slicer: A graphical element that people can click to narrow down data.
• Drillthrough filter: Enables you to proceed to a different page with more details.
• Cross filter/highlight: Highlights data on clicking on visuals
11. What are the various methods of connecting in Power BI?
• Import: Data is duplicated and stored in Power BI.
• DirectQuery: Data does not move and is used right away.
• Live Connection: Analysis Services (SSAS) data is not cached in Power BI.
• Composite Model: Import and DirectQuery Integration.
12. Does Power BI accommodate Excel files?
Yes. You can connect Power BI to Excel files and bring in tables, named ranges, and even data models.
13. Can Power BI display data in real-time?
Yes. Power BI can present live updates through tools such as Azure Stream Analytics, streaming data, or REST APIs.
14. What is the Power BI Service?
It is Power BI in the cloud. You can use it to browse, share, and collaborate on reports and dashboards through a web browser.
15. Why is Power BI Desktop used?
Power BI Desktop is a free computer software. You may use it to make reports and dashboards. Developers and analysts use it before they publish their work on the internet.
How to obtain Power BI certification?
We are an Education Technology company providing certification training courses to accelerate careers of working professionals worldwide. We impart training through instructor-led classroom workshops, instructor-led live virtual training sessions, and self-paced e-learning courses.
We have successfully conducted training sessions in 108 countries across the globe and enabled thousands of working professionals to enhance the scope of their careers.
Our enterprise training portfolio includes in-demand and globally recognized certification training courses in Project Management, Quality Management, Business Analysis, IT Service Management, Agile and Scrum, Cyber Security, Data Science, and Emerging Technologies. Download our Enterprise Training Catalog from https://www.icertglobal.com/corporate-training-for-enterprises.php and https://www.icertglobal.com/index.php
Popular Courses include:
-
Project Management: PMP, CAPM ,PMI RMP
-
Quality Management: Six Sigma Black Belt ,Lean Six Sigma Green Belt, Lean Management, Minitab,CMMI
-
Business Analysis: CBAP, CCBA, ECBA
-
Agile Training: PMI-ACP , CSM , CSPO
-
Scrum Training: CSM
-
DevOps
-
Program Management: PgMP
-
Cloud Technology: Exin Cloud Computing
-
Citrix Client Adminisration: Citrix Cloud Administration
The 10 top-paying certifications to target in 2025 are:
CONCLUSION
Power BI is a potent device in data conversion into insights through the use of reports and dashboards. Preparation of interviews through the study of key concepts, tools, and features may assist you in securing employment in the data sector. With growing demand and decent salary, Power BI is a great career choice.
Contact Us For More Information:
Visit :www.icertglobal.com Email :

Important Soft Skills for Data Scientists
Data science is not only mathematics, statistics, or programming. It also needs imagination, creativity, and vision. These skills enable data scientists to make difficult choices and make business choices based on a great amount of data.
Passion can be such a struggle when it comes to data science. People who want to be data scientists need more than math and programming skills—they need good communication skills as well, in order to excel in their career.
Why Data Scientists Require Soft Skills ?
Google conducted studies to discover what the greatest teams at work are. They discovered that the greatest teams were not teams of the most brilliant technical specialists. Rather, the greatest teams were teams of individuals who could communicate, empathize with others, and lead empathetically.

Top Soft Skills for Data Scientists
When people use the term data scientist, they automatically assume that it's a person who's excellent in math, programming, and computer use. These are useful skills, but there is another aspect to being an excellent data scientist that is equally relevant — soft skills. Soft skills are the social and personal skills that enable data scientists to collaborate effectively with others, think logically, and make reasonable judgments when solving problems. Let's discuss some of the most critical soft skills that every data scientist must be excellent at.
1. Communication
One of the key responsibilities of a data scientist is to make sense of what their data is. They need to communicate what they discover to various kinds of people. At times they need to explain to other data scientists and IT professionals who are technically inclined. But in many cases they need to explain to people who are not highly data-literate, like business managers or clients.
2. Curiosity
Curiosity is having a desire to learn and discover. It is being an unrelenting detective who keeps asking questions. A curious data scientist will not take the first answer. They will probe deeper to discover any underlying surprises or trends in the data. This is very crucial because the best discoveries are sometimes made by looking beyond what is apparent.
3. Understanding Business
Data science is not just numbers; it is also about making a business successful. Due to this, data scientists need to know how businesses run. Data scientists need to know what the business is selling, who the customers are, and what the business wishes to accomplish.
4. Storytelling
Numbers alone don't interpret well. We don't necessarily understand everything from looking at numbers or graphs. That is where story comes in. Storytelling is taking data and placing it within a normal, relatable story that tells us what is going on and why we should care.
Good storytelling gets people to care about what the numbers are telling them. Instead of just reporting "sales increased 10%," for example, a data scientist could say that sales increased because a new ad campaign paid off, or because a new product was a hit. This gets managers and teams to know what to do next.
5. Adaptability
The technology and business field is constantly evolving. Every day, new tools, techniques, and issues crop up. Due to this, data scientists must be adaptable. Being adaptable is being willing to learn something new and shift the way you do things when needed.

6. Critical Thinking
Critical thinking is thinking hard and making the right decisions. Data scientists get a lot of data, but not all of it is accurate or helpful. They must carefully examine the data to discover mistakes or holes.
7. Product Understanding
Most data scientists are assigned projects for specific products or services. Having knowledge about the product aids them in creating better solutions. For instance, if a data scientist is in a company that produces video games, having knowledge about how the users enjoy the game or what features they use the most assists the scientist in examining the correct data.
8. Team Player
Data scientists are not always solo players. They usually collaborate with other data scientists, engineers, managers, and business professionals. A team player means that you are compatible with others, you exchange ideas, listen to ideas, and help the team work well.
How to Enhance Soft Skills for a Data Scientist Position
Among the ways of building your soft skills are:
• Learn online: Acquire new skills like project management or negotiation.
• Request feedback: Discover what you excel at and where you can improve by asking your coworkers or friends.
• Find a coach: A coach can help you get better at the skills you want to improve more quickly.
• Practice in front of a friend: Practice asking for a raise or promotion, and have a friend play the role of your boss and provide feedback.
The Real Benefits of Soft Skills
Soft skills are easy to acquire. A factory learned that imparting soft skills made its workers much more efficient and earned them a tremendous amount of profit. Soft skills enable individuals to work more efficiently, make sound judgments, and get more work done.

Even more repetitive work will be done by machines in the future, and humans will be doing more valuable work such as engaging with customers, making improved products, and running machines. Soft skills will be of tremendous value to such jobs.
How to obtain certification?
We are an Education Technology company providing certification training courses to accelerate careers of working professionals worldwide. We impart training through instructor-led classroom workshops, instructor-led live virtual training sessions, and self-paced e-learning courses.
We have successfully conducted training sessions in 108 countries across the globe and enabled thousands of working professionals to enhance the scope of their careers.
Our enterprise training portfolio includes in-demand and globally recognized certification training courses in Project Management, Quality Management, Business Analysis, IT Service Management, Agile and Scrum, Cyber Security, Data Science, and Emerging Technologies. Download our Enterprise Training Catalog from https://www.icertglobal.com/corporate-training-for-enterprises.php and https://www.icertglobal.com/index.php
Popular Courses include:
-
Project Management: PMP, CAPM ,PMI RMP
-
Quality Management: Six Sigma Black Belt ,Lean Six Sigma Green Belt, Lean Management, Minitab,CMMI
-
Business Analysis: CBAP, CCBA, ECBA
-
Agile Training: PMI-ACP , CSM , CSPO
-
Scrum Training: CSM
-
DevOps
-
Program Management: PgMP
-
Cloud Technology: Exin Cloud Computing
-
Citrix Client Adminisration: Citrix Cloud Administration
The 10 top-paying certifications to target in 2025 are:
Conclusion
Soft skills are equally essential as technical skills for data scientists. They enable one to work well with others and make well-informed decisions while solving problems. Growth in these skills can result in a successful and fulfilling career.
Contact Us For More Information:
Visit : www.icertglobal.com Email : info@icertglobal.com

Read More
Data science is not only mathematics, statistics, or programming. It also needs imagination, creativity, and vision. These skills enable data scientists to make difficult choices and make business choices based on a great amount of data.
Passion can be such a struggle when it comes to data science. People who want to be data scientists need more than math and programming skills—they need good communication skills as well, in order to excel in their career.
Why Data Scientists Require Soft Skills ?
Google conducted studies to discover what the greatest teams at work are. They discovered that the greatest teams were not teams of the most brilliant technical specialists. Rather, the greatest teams were teams of individuals who could communicate, empathize with others, and lead empathetically.
Top Soft Skills for Data Scientists
When people use the term data scientist, they automatically assume that it's a person who's excellent in math, programming, and computer use. These are useful skills, but there is another aspect to being an excellent data scientist that is equally relevant — soft skills. Soft skills are the social and personal skills that enable data scientists to collaborate effectively with others, think logically, and make reasonable judgments when solving problems. Let's discuss some of the most critical soft skills that every data scientist must be excellent at.
1. Communication
One of the key responsibilities of a data scientist is to make sense of what their data is. They need to communicate what they discover to various kinds of people. At times they need to explain to other data scientists and IT professionals who are technically inclined. But in many cases they need to explain to people who are not highly data-literate, like business managers or clients.
2. Curiosity
Curiosity is having a desire to learn and discover. It is being an unrelenting detective who keeps asking questions. A curious data scientist will not take the first answer. They will probe deeper to discover any underlying surprises or trends in the data. This is very crucial because the best discoveries are sometimes made by looking beyond what is apparent.
3. Understanding Business
Data science is not just numbers; it is also about making a business successful. Due to this, data scientists need to know how businesses run. Data scientists need to know what the business is selling, who the customers are, and what the business wishes to accomplish.
4. Storytelling
Numbers alone don't interpret well. We don't necessarily understand everything from looking at numbers or graphs. That is where story comes in. Storytelling is taking data and placing it within a normal, relatable story that tells us what is going on and why we should care.
Good storytelling gets people to care about what the numbers are telling them. Instead of just reporting "sales increased 10%," for example, a data scientist could say that sales increased because a new ad campaign paid off, or because a new product was a hit. This gets managers and teams to know what to do next.
5. Adaptability
The technology and business field is constantly evolving. Every day, new tools, techniques, and issues crop up. Due to this, data scientists must be adaptable. Being adaptable is being willing to learn something new and shift the way you do things when needed.
6. Critical Thinking
Critical thinking is thinking hard and making the right decisions. Data scientists get a lot of data, but not all of it is accurate or helpful. They must carefully examine the data to discover mistakes or holes.
7. Product Understanding
Most data scientists are assigned projects for specific products or services. Having knowledge about the product aids them in creating better solutions. For instance, if a data scientist is in a company that produces video games, having knowledge about how the users enjoy the game or what features they use the most assists the scientist in examining the correct data.
8. Team Player
Data scientists are not always solo players. They usually collaborate with other data scientists, engineers, managers, and business professionals. A team player means that you are compatible with others, you exchange ideas, listen to ideas, and help the team work well.
How to Enhance Soft Skills for a Data Scientist Position
Among the ways of building your soft skills are:
• Learn online: Acquire new skills like project management or negotiation.
• Request feedback: Discover what you excel at and where you can improve by asking your coworkers or friends.
• Find a coach: A coach can help you get better at the skills you want to improve more quickly.
• Practice in front of a friend: Practice asking for a raise or promotion, and have a friend play the role of your boss and provide feedback.
The Real Benefits of Soft Skills
Soft skills are easy to acquire. A factory learned that imparting soft skills made its workers much more efficient and earned them a tremendous amount of profit. Soft skills enable individuals to work more efficiently, make sound judgments, and get more work done.
Even more repetitive work will be done by machines in the future, and humans will be doing more valuable work such as engaging with customers, making improved products, and running machines. Soft skills will be of tremendous value to such jobs.
How to obtain certification?
We are an Education Technology company providing certification training courses to accelerate careers of working professionals worldwide. We impart training through instructor-led classroom workshops, instructor-led live virtual training sessions, and self-paced e-learning courses.
We have successfully conducted training sessions in 108 countries across the globe and enabled thousands of working professionals to enhance the scope of their careers.
Our enterprise training portfolio includes in-demand and globally recognized certification training courses in Project Management, Quality Management, Business Analysis, IT Service Management, Agile and Scrum, Cyber Security, Data Science, and Emerging Technologies. Download our Enterprise Training Catalog from https://www.icertglobal.com/corporate-training-for-enterprises.php and https://www.icertglobal.com/index.php
Popular Courses include:
-
Project Management: PMP, CAPM ,PMI RMP
-
Quality Management: Six Sigma Black Belt ,Lean Six Sigma Green Belt, Lean Management, Minitab,CMMI
-
Business Analysis: CBAP, CCBA, ECBA
-
Agile Training: PMI-ACP , CSM , CSPO
-
Scrum Training: CSM
-
DevOps
-
Program Management: PgMP
-
Cloud Technology: Exin Cloud Computing
-
Citrix Client Adminisration: Citrix Cloud Administration
The 10 top-paying certifications to target in 2025 are:
Conclusion
Soft skills are equally essential as technical skills for data scientists. They enable one to work well with others and make well-informed decisions while solving problems. Growth in these skills can result in a successful and fulfilling career.
Contact Us For More Information:
Visit : www.icertglobal.com Email : info@icertglobal.com
.webp)
Discover the Benefits of Descriptive Analytics
Most businesses today utilize data to enable them to make more informed decisions. By examining figures and data, business executives can observe patterns and trends that inform them in which direction things are heading. This enables them to do things better and post improved results. When individuals are provided with more data, they are able to make more informed decisions.
What is descriptive analytics?
There are four primary categories of business analytics:
• Descriptive Analytics – What occurred?
• Diagnostic Analytics – Why did it happen?
• Predictive Analytics – What's next?
• Prescriptive Analytics – What do we do about it?
Descriptive analytics is the most prevalent and simplest form. It analyzes historical and existing data to demonstrate what has occurred in a firm. It assists companies in spotting tendencies and tracking their performance.
With descriptive analytics, companies create reports and scorecards (e.g., KPIs – Key Performance Indicators) to quantify such as customer behavior, spending, and sales. They use them to view how they are performing.
A prime example is social media. Companies utilize descriptive analytics to analyze how their posts are performing. They are tracking likes, shares, new followers, and how much money they are generating on social media. This allows them to determine which posts or campaigns are performing and which are not.
More Examples
Descriptive analytics also help us to:
• How much profit or loss the company is making
• Inventory and product movement
• What customers complain about in surveys
• How fast things get through the supply chain
• Which bills must be paid or collected

Descriptive analytics can seem daunting, but it is only a means of comprehending something that already exists. This assists businesses in making better decisions in the future.
What Can Descriptive Analytics Teach Us?
Descriptive analytics assists companies in looking where they are headed, where they currently are, and where they are relative to others. There is more to it than that, however. Then what else can they discover from it?
1. How well the company is currently doing.
It tracks significant numbers for departments, teams, and the business as a whole. For instance, it could be showing one salesperson's performance this quarter or what product is selling best.
2. Trends from the Past
It gathers data over time so that companies can compare things. For instance, they can compare sales this quarter with sales last quarter to check whether things are getting better. They tend to use graphs to facilitate such comparisons to be easily understandable.
3. Strengths and Weaknesses
It enables companies to know what is going right and what is going wrong. They can compare their performance with other companies or industry standards. This informs them where they are performing better and where they should improve.
How Does Descriptive Analytics Work
There are five crucial steps:
Step 1: Determine What to Monitor
Firms first decide what they would like to measure. If they want to expand, they may consider how much they earn every quarter. The unit that bills may observe how rapidly customers make payments.
Step 2: Search for the Appropriate Data
Secondly, they have to gather the correct data. This might be difficult since the data may be located in various places. Some businesses use specialized software such as ERP systems to assist in keeping everything in order. They may also require data from websites or social media.
Step 3: Prepare the Data
They have to clean and merge the data before it can be used. This involves correcting errors and having everything in the right format. Occasionally, they employ something known as data modeling to assist in getting everything in an easier-to-understand format.
Step 4: Analyze the Data
After the data is prepared, they feed it into a computer program using applications such as Excel or using special programs. They will make simple calculations such as totals, averages, or other simple math to figure out what is going on. A manager might need to know how much money they earned this month, for instance.
Step 5: Display the Results
Finally, they present the results so others can understand. Some people like charts or graphs, while others prefer tables and numbers. The goal is to make the data clear and useful for everyone.

What are the advantages of Descriptive Analytics
Below are some of the benefits of using descriptive analytics:
- It is easy to use and get the hang of. You don't need to be a genius at math to work it.
- There are several handy tools. Several tools do the hard work for you.
- It answers common questions. For example, "How are we doing?" or "What should we change?"
- But it is not flawless. There are two errors here:
- It is basic. It only looks at simple relationships between a few things.
- It does not inform us why. It informs us what, but not why or what may be coming next.
Descriptive, Predictive, and Prescriptive Analytics:
What's the Difference?
There are three primary types of analytics used in business and data analysis that assist one in comprehending data and making conclusions. They include Descriptive, Predictive, and Prescriptive analytics. Each serves a unique purpose and provides a different answer.
1. Descriptive Analytics – What happened?
Descriptive analytics examines historical and current facts with the purpose of describing what has occurred within a business. It makes individuals consider trends, patterns, and what is happening at the moment.
Example:
- A shop has looked at 6 months' worth of sales to see what was selling most.
Important points:
•Utilizes reports, charts, and dashboards.
• Indicates previous performance
• Supports monitoring progress and finding trends
2. Predictive Analytics – What could happen next?
Predictive analytics uses data and mathematics to predict what will happen in the future. It examines past trends and makes future occurrences or outcomes predictions from them.
Example:
An online retailer forecasts which shoppers are most likely to purchase something during a holiday sale based on their history.
Major sections:
• Uses statistics and machine learning
• Helps plan ahead
• Identifies risks and opportunities
3. Prescriptive Analytics – What do we do about it?
Prescriptive analytics takes it a step further. It not just tells you what will happen; it tells you what you should do next. It assists individuals in making the optimal decision based on several possible scenarios that can occur.
Example:
A delivery business applies data to determine the lowest cost and most efficient path for drivers, factoring in traffic and fuel costs.
Main points:
• Best options advised
• Supports decision-making
• Solves complicated problems with numerous options

In conclusion:
• Descriptive = Informs you of what occurred in the past.
• Predictive means it looks forward to tell us what will happen.
• Prescriptive because it informs a person what to do next.
How to obtain certification?
We are an Education Technology company providing certification training courses to accelerate careers of working professionals worldwide. We impart training through instructor-led classroom workshops, instructor-led live virtual training sessions, and self-paced e-learning courses.
We have successfully conducted training sessions in 108 countries across the globe and enabled thousands of working professionals to enhance the scope of their careers.
Our enterprise training portfolio includes in-demand and globally recognized certification training courses in Project Management, Quality Management, Business Analysis, IT Service Management, Agile and Scrum, Cyber Security, Data Science, and Emerging Technologies. Download our Enterprise Training Catalog from https://www.icertglobal.com/corporate-training-for-enterprises.php and https://www.icertglobal.com/index.php
Popular Courses include:
-
Project Management: PMP, CAPM ,PMI RMP
-
Quality Management: Six Sigma Black Belt ,Lean Six Sigma Green Belt, Lean Management, Minitab,CMMI
-
Business Analysis: CBAP, CCBA, ECBA
-
Agile Training: PMI-ACP , CSM , CSPO
-
Scrum Training: CSM
-
DevOps
-
Program Management: PgMP
-
Cloud Technology: Exin Cloud Computing
-
Citrix Client Adminisration: Citrix Cloud Administration
The 10 top-paying certifications to target in 2025 are:
Conclusion
Descriptive, predictive, and prescriptive analytics help businesses observe the past, predict the future, and make smart choices. All of them have a unique role to play in data-driven success. iCert Global offers training to help you master these skills and excel in your professional life.
Contact Us For More Information:
Visit : www.icertglobal.com Email : info@icertglobal.com
Read More
Most businesses today utilize data to enable them to make more informed decisions. By examining figures and data, business executives can observe patterns and trends that inform them in which direction things are heading. This enables them to do things better and post improved results. When individuals are provided with more data, they are able to make more informed decisions.
What is descriptive analytics?
There are four primary categories of business analytics:
• Descriptive Analytics – What occurred?
• Diagnostic Analytics – Why did it happen?
• Predictive Analytics – What's next?
• Prescriptive Analytics – What do we do about it?
Descriptive analytics is the most prevalent and simplest form. It analyzes historical and existing data to demonstrate what has occurred in a firm. It assists companies in spotting tendencies and tracking their performance.
With descriptive analytics, companies create reports and scorecards (e.g., KPIs – Key Performance Indicators) to quantify such as customer behavior, spending, and sales. They use them to view how they are performing.
A prime example is social media. Companies utilize descriptive analytics to analyze how their posts are performing. They are tracking likes, shares, new followers, and how much money they are generating on social media. This allows them to determine which posts or campaigns are performing and which are not.
More Examples
Descriptive analytics also help us to:
• How much profit or loss the company is making
• Inventory and product movement
• What customers complain about in surveys
• How fast things get through the supply chain
• Which bills must be paid or collected
Descriptive analytics can seem daunting, but it is only a means of comprehending something that already exists. This assists businesses in making better decisions in the future.
What Can Descriptive Analytics Teach Us?
Descriptive analytics assists companies in looking where they are headed, where they currently are, and where they are relative to others. There is more to it than that, however. Then what else can they discover from it?
1. How well the company is currently doing.
It tracks significant numbers for departments, teams, and the business as a whole. For instance, it could be showing one salesperson's performance this quarter or what product is selling best.
2. Trends from the Past
It gathers data over time so that companies can compare things. For instance, they can compare sales this quarter with sales last quarter to check whether things are getting better. They tend to use graphs to facilitate such comparisons to be easily understandable.
3. Strengths and Weaknesses
It enables companies to know what is going right and what is going wrong. They can compare their performance with other companies or industry standards. This informs them where they are performing better and where they should improve.
How Does Descriptive Analytics Work
There are five crucial steps:
Step 1: Determine What to Monitor
Firms first decide what they would like to measure. If they want to expand, they may consider how much they earn every quarter. The unit that bills may observe how rapidly customers make payments.
Step 2: Search for the Appropriate Data
Secondly, they have to gather the correct data. This might be difficult since the data may be located in various places. Some businesses use specialized software such as ERP systems to assist in keeping everything in order. They may also require data from websites or social media.
Step 3: Prepare the Data
They have to clean and merge the data before it can be used. This involves correcting errors and having everything in the right format. Occasionally, they employ something known as data modeling to assist in getting everything in an easier-to-understand format.
Step 4: Analyze the Data
After the data is prepared, they feed it into a computer program using applications such as Excel or using special programs. They will make simple calculations such as totals, averages, or other simple math to figure out what is going on. A manager might need to know how much money they earned this month, for instance.
Step 5: Display the Results
Finally, they present the results so others can understand. Some people like charts or graphs, while others prefer tables and numbers. The goal is to make the data clear and useful for everyone.
What are the advantages of Descriptive Analytics
Below are some of the benefits of using descriptive analytics:
- It is easy to use and get the hang of. You don't need to be a genius at math to work it.
- There are several handy tools. Several tools do the hard work for you.
- It answers common questions. For example, "How are we doing?" or "What should we change?"
- But it is not flawless. There are two errors here:
- It is basic. It only looks at simple relationships between a few things.
- It does not inform us why. It informs us what, but not why or what may be coming next.
Descriptive, Predictive, and Prescriptive Analytics:
What's the Difference?
There are three primary types of analytics used in business and data analysis that assist one in comprehending data and making conclusions. They include Descriptive, Predictive, and Prescriptive analytics. Each serves a unique purpose and provides a different answer.
1. Descriptive Analytics – What happened?
Descriptive analytics examines historical and current facts with the purpose of describing what has occurred within a business. It makes individuals consider trends, patterns, and what is happening at the moment.
Example:
- A shop has looked at 6 months' worth of sales to see what was selling most.
Important points:
•Utilizes reports, charts, and dashboards.
• Indicates previous performance
• Supports monitoring progress and finding trends
2. Predictive Analytics – What could happen next?
Predictive analytics uses data and mathematics to predict what will happen in the future. It examines past trends and makes future occurrences or outcomes predictions from them.
Example:
An online retailer forecasts which shoppers are most likely to purchase something during a holiday sale based on their history.
Major sections:
• Uses statistics and machine learning
• Helps plan ahead
• Identifies risks and opportunities
3. Prescriptive Analytics – What do we do about it?
Prescriptive analytics takes it a step further. It not just tells you what will happen; it tells you what you should do next. It assists individuals in making the optimal decision based on several possible scenarios that can occur.
Example:
A delivery business applies data to determine the lowest cost and most efficient path for drivers, factoring in traffic and fuel costs.
Main points:
• Best options advised
• Supports decision-making
• Solves complicated problems with numerous options
In conclusion:
• Descriptive = Informs you of what occurred in the past.
• Predictive means it looks forward to tell us what will happen.
• Prescriptive because it informs a person what to do next.
How to obtain certification?
We are an Education Technology company providing certification training courses to accelerate careers of working professionals worldwide. We impart training through instructor-led classroom workshops, instructor-led live virtual training sessions, and self-paced e-learning courses.
We have successfully conducted training sessions in 108 countries across the globe and enabled thousands of working professionals to enhance the scope of their careers.
Our enterprise training portfolio includes in-demand and globally recognized certification training courses in Project Management, Quality Management, Business Analysis, IT Service Management, Agile and Scrum, Cyber Security, Data Science, and Emerging Technologies. Download our Enterprise Training Catalog from https://www.icertglobal.com/corporate-training-for-enterprises.php and https://www.icertglobal.com/index.php
Popular Courses include:
-
Project Management: PMP, CAPM ,PMI RMP
-
Quality Management: Six Sigma Black Belt ,Lean Six Sigma Green Belt, Lean Management, Minitab,CMMI
-
Business Analysis: CBAP, CCBA, ECBA
-
Agile Training: PMI-ACP , CSM , CSPO
-
Scrum Training: CSM
-
DevOps
-
Program Management: PgMP
-
Cloud Technology: Exin Cloud Computing
-
Citrix Client Adminisration: Citrix Cloud Administration
The 10 top-paying certifications to target in 2025 are:
Conclusion
Descriptive, predictive, and prescriptive analytics help businesses observe the past, predict the future, and make smart choices. All of them have a unique role to play in data-driven success. iCert Global offers training to help you master these skills and excel in your professional life.
Contact Us For More Information:
Visit : www.icertglobal.com Email : info@icertglobal.com
Best Languages for Data Science Beginners and Pros
If you aspire to be a data scientist, you need to learn some computer languages. There is no single language that can do everything. That is why it is required to learn more than one language. Learning the appropriate languages makes you more efficient in solving data science issues. These are required frequently. For instance, Python was extremely popular during the 2010s when data science was growing. In an Indeed study, it was discovered that data science and Python skills from 2014 to 2019 were the key to kick-start a tech career in 2020.
Things to Keep in Mind Before Selecting a Programming Language:
• What kind of work will you perform with information?
• How does your organization leverage data science?
• What does your business want to accomplish?
• What are your own career aspirations?
• Languages you can speak?
• How hard are you willing to work to learn more?
Most Used Programming Languages for Data Science ?

Python
Python is the most significant data science language. This will hold true for the next five years at least. If you understand Python and how to fix problems with numbers and experiments, you will be great at this profession.
Python is a special and flexible programming language. People use it in many ways, like:
• Using tools like NumPy and SciPy to work with numbers and data
• Building websites with Django and Flask
• Organizing and managing information
• Making smart programs using machine learning, like decision trees

R Programming
R is another powerful language for data science. It became popular very quickly.
R is great at working with numbers and making graphs. It also has over 8,000 helpful tools created by people around the world. Statisticians use R to make predictions and create graphs.
It is supported in machine learning by packages like Gmodels, RODBC, TM, and Class in building smart systems. R is also a good option if you are comfortable writing research reports.
Java
Java is a widely used programming language that is over 30 years old. Java is applied in developing desktop applications, web applications, and mobile applications. Java executes on a platform known as JVM (Java Virtual Machine) that enables it to execute on various computers.
Most big companies prefer using Java since it is simple to add features on their project without slowing them down. That is why it is commonly applied in big machine learning frameworks.
JavaScript
JavaScript is a popular programming language. It was initially used to render websites interactive and engaging. But over time, it grew stronger with ReactJS, AngularJS, and NodeJS. Now, you can utilize JavaScript to create the front (users' interface) and back (their functionality) ends of websites.
SAS (Statistical Analysis System)
SAS is a data and number-working device, and it is appropriate for activities like business reports, forecasting, and data analysis. SAS has been in existence since 1976, and the majority of people in the world of data trust it.
Scala
Scala is also a Java-compatible language. It can be applied to big projects with a lot of data. Scala is usually used with a system named Apache Spark, which assists in the data task distribution and executing them with high speed.
TensorFlow
TensorFlow is a very useful math and machine learning program. It assists you in managing enormous amounts of data. You can split your work into a number of small works and execute them simultaneously on a number of computer chips (CPUs and GPUs). This accelerates training large computer systems (neural networks) significantly.

C#
C# (pronounced "C-sharp") was developed by Microsoft. It is 20 years old. C# is similar to Java but with some new and helpful functionalities. Microsoft simplified data science with C# by including Hadoop support and making ML.NET, a tool for assisting you in creating intelligent applications for different computer systems.
Ruby
Ruby is also a language that is frequently used to deal with text. It is also used by developers to experiment with ideas, build servers, and perform mundane tasks. Ruby is not as widely used in data science as Python or R, but it has some useful tools nonetheless.
For data science, Ruby can be used with:
• iruby – allows you to run Ruby in Jupyter notebooks.
• rserve-client – allows Ruby to communicate with R, another data tool.
• Jongleur – helps to organize and change data.
• Rb-gsl – offers access to mathematical functions in the GNU Scientific Library
Languages Used for Programming
Before you select a programming language, think about what you do. For example, financial folks use R to read stock market data and predict prices. In stores or online, computer programmers use Python to develop programs that suggest products to shoppers.
How to obtain Data Science certification?
We are an Education Technology company providing certification training courses to accelerate careers of working professionals worldwide. We impart training through instructor-led classroom workshops, instructor-led live virtual training sessions, and self-paced e-learning courses.
We have successfully conducted training sessions in 108 countries across the globe and enabled thousands of working professionals to enhance the scope of their careers.
Our enterprise training portfolio includes in-demand and globally recognized certification training courses in Project Management, Quality Management, Business Analysis, IT Service Management, Agile and Scrum, Cyber Security, Data Science, and Emerging Technologies. Download our Enterprise Training Catalog from https://www.icertglobal.com/corporate-training-for-enterprises.php and https://www.icertglobal.com/index.php
Popular Courses include:
-
Project Management: PMP, CAPM ,PMI RMP
-
Quality Management: Six Sigma Black Belt ,Lean Six Sigma Green Belt, Lean Management, Minitab,CMMI
-
Business Analysis: CBAP, CCBA, ECBA
-
Agile Training: PMI-ACP , CSM , CSPO
-
Scrum Training: CSM
-
DevOps
-
Program Management: PgMP
-
Cloud Technology: Exin Cloud Computing
-
Citrix Client Adminisration: Citrix Cloud Administration
The 10 top-paying certifications to target in 2025 are:
Conclusion
Choosing the appropriate programming language can help you progress in your data science career. Keep your goals, work needs, and what recruiters need in mind. Keep learning and enhancing abilities. iCert Global offers easy data science courses that make you successful.
Contact Us For More Information:
Visit : www.icertglobal.com Email : info@icertglobal.com
Read More
If you aspire to be a data scientist, you need to learn some computer languages. There is no single language that can do everything. That is why it is required to learn more than one language. Learning the appropriate languages makes you more efficient in solving data science issues. These are required frequently. For instance, Python was extremely popular during the 2010s when data science was growing. In an Indeed study, it was discovered that data science and Python skills from 2014 to 2019 were the key to kick-start a tech career in 2020.
Things to Keep in Mind Before Selecting a Programming Language:
• What kind of work will you perform with information?
• How does your organization leverage data science?
• What does your business want to accomplish?
• What are your own career aspirations?
• Languages you can speak?
• How hard are you willing to work to learn more?
Most Used Programming Languages for Data Science ?
Python
Python is the most significant data science language. This will hold true for the next five years at least. If you understand Python and how to fix problems with numbers and experiments, you will be great at this profession.
Python is a special and flexible programming language. People use it in many ways, like:
• Using tools like NumPy and SciPy to work with numbers and data
• Building websites with Django and Flask
• Organizing and managing information
• Making smart programs using machine learning, like decision trees
R Programming
R is another powerful language for data science. It became popular very quickly.
R is great at working with numbers and making graphs. It also has over 8,000 helpful tools created by people around the world. Statisticians use R to make predictions and create graphs.
It is supported in machine learning by packages like Gmodels, RODBC, TM, and Class in building smart systems. R is also a good option if you are comfortable writing research reports.
Java
Java is a widely used programming language that is over 30 years old. Java is applied in developing desktop applications, web applications, and mobile applications. Java executes on a platform known as JVM (Java Virtual Machine) that enables it to execute on various computers.
Most big companies prefer using Java since it is simple to add features on their project without slowing them down. That is why it is commonly applied in big machine learning frameworks.
JavaScript
JavaScript is a popular programming language. It was initially used to render websites interactive and engaging. But over time, it grew stronger with ReactJS, AngularJS, and NodeJS. Now, you can utilize JavaScript to create the front (users' interface) and back (their functionality) ends of websites.
SAS (Statistical Analysis System)
SAS is a data and number-working device, and it is appropriate for activities like business reports, forecasting, and data analysis. SAS has been in existence since 1976, and the majority of people in the world of data trust it.
Scala
Scala is also a Java-compatible language. It can be applied to big projects with a lot of data. Scala is usually used with a system named Apache Spark, which assists in the data task distribution and executing them with high speed.
TensorFlow
TensorFlow is a very useful math and machine learning program. It assists you in managing enormous amounts of data. You can split your work into a number of small works and execute them simultaneously on a number of computer chips (CPUs and GPUs). This accelerates training large computer systems (neural networks) significantly.
C#
C# (pronounced "C-sharp") was developed by Microsoft. It is 20 years old. C# is similar to Java but with some new and helpful functionalities. Microsoft simplified data science with C# by including Hadoop support and making ML.NET, a tool for assisting you in creating intelligent applications for different computer systems.
Ruby
Ruby is also a language that is frequently used to deal with text. It is also used by developers to experiment with ideas, build servers, and perform mundane tasks. Ruby is not as widely used in data science as Python or R, but it has some useful tools nonetheless.
For data science, Ruby can be used with:
• iruby – allows you to run Ruby in Jupyter notebooks.
• rserve-client – allows Ruby to communicate with R, another data tool.
• Jongleur – helps to organize and change data.
• Rb-gsl – offers access to mathematical functions in the GNU Scientific Library
Languages Used for Programming
Before you select a programming language, think about what you do. For example, financial folks use R to read stock market data and predict prices. In stores or online, computer programmers use Python to develop programs that suggest products to shoppers.
How to obtain Data Science certification?
We are an Education Technology company providing certification training courses to accelerate careers of working professionals worldwide. We impart training through instructor-led classroom workshops, instructor-led live virtual training sessions, and self-paced e-learning courses.
We have successfully conducted training sessions in 108 countries across the globe and enabled thousands of working professionals to enhance the scope of their careers.
Our enterprise training portfolio includes in-demand and globally recognized certification training courses in Project Management, Quality Management, Business Analysis, IT Service Management, Agile and Scrum, Cyber Security, Data Science, and Emerging Technologies. Download our Enterprise Training Catalog from https://www.icertglobal.com/corporate-training-for-enterprises.php and https://www.icertglobal.com/index.php
Popular Courses include:
-
Project Management: PMP, CAPM ,PMI RMP
-
Quality Management: Six Sigma Black Belt ,Lean Six Sigma Green Belt, Lean Management, Minitab,CMMI
-
Business Analysis: CBAP, CCBA, ECBA
-
Agile Training: PMI-ACP , CSM , CSPO
-
Scrum Training: CSM
-
DevOps
-
Program Management: PgMP
-
Cloud Technology: Exin Cloud Computing
-
Citrix Client Adminisration: Citrix Cloud Administration
The 10 top-paying certifications to target in 2025 are:
Conclusion
Choosing the appropriate programming language can help you progress in your data science career. Keep your goals, work needs, and what recruiters need in mind. Keep learning and enhancing abilities. iCert Global offers easy data science courses that make you successful.
Contact Us For More Information:
Visit : www.icertglobal.com Email : info@icertglobal.com

Role and Responsibilities of a Data Scientist
A job description defines the work you will do, the abilities and equipment you will require, and what job listings desire. The following is a brief description of what work as a data scientist generally entails.
A data scientist collects and examines massive amounts of data to uncover important ideas and craft solutions that allow a company to realize its objectives. They apply technical knowledge, study the data in detail, and present their findings in a way that enables individuals to make informed decisions.
Chief Responsibilities:
- Collect data from different sources and organize it for research.
- Process a tremendous amount of data, whether tidy or messy, in order to discover trends and patterns.
- Develop smart computer models that learn from experience to resolve business problems.
- Employ statistics and mathematics to ascertain if the results are accurate.
- Utilize computer programming and AI software to automate.
- Develop easy-to-read reports and charts to present what the data is.
- Collaborate with other groups to execute data concepts on their projects.
- Continue to learn about new tools and methods for working with data.

Tools and Technologies:
- Programming languages: Python, R, SQL
- Data visualization software: Tableau, Power BI, matplotlib
- Machine learning libraries: TensorFlow, Scikit-learn, PyTorch
- Big data tools: Apache Hadoop, Spark
- Cloud platforms: AWS, Azure, Google Cloud
- Statistics programmes: SAS, SPSS
- Data Scientist Careers and Responsibilities: What is a Data Scientist's Job?
A data scientist's responsibilities and job are:
- Obtaining useful information from relevant sources
- Utilizing machine learning tools for feature selection, model generation and model refinement.
- Preparing both organized and messy data before analysis
- Improved data collection techniques so that required information is obtained.
- Cleansing and validation of data to make sure that it's accurate and ready for utilization.
- Sorting through a vast amount of data to discover patterns and answers
- Building predictive systems and smart algorithms
- •Displaying results in a straightforward and easy-to-understand manner
- Offering recommendations and proposals to improve business issues
- Collaborating with Business and IT organizations
Data Scientist Skills
If you wish to be a data scientist, you need to acquire valuable skills that are demanded by the majority of organizations. The following are the necessary skills that the data scientist should acquire:
- Coding Skills: Learn how to apply coding languages like Python, R, and query languages like SQL. Familiarization with other languages like Java or C++ is a plus.
- Statistics: Be familiar with basic statistics including tests, patterns in data, and data measurement. Statistics is useful in aiding you to handle data effectively.
- Machine Learning: Learn how machines can be trained from data using algorithms such as k-Nearest Neighbors, Naive Bayes, and Decision Trees.
- Mathematical Skills: Familiar with key mathematics subjects such as calculus and linear algebra since they enable more accurate predictions and enhanced computer simulations.
- Data Wrangling: You must be able to clean and fix dirty or erroneous data. It is the bulk of the work.
- Data Visualization: Use Tableau or matplotlib to produce images and charts that display data in a straightforward way.
- Communication: Needs to be able to present your results clearly to technical professionals and to regular people.
- Software Skills: I possess a good background in writing and software skills.
- Hands-on Experience: Practice with tools data scientists use daily.
- Problem Solving: Be capable of generating solutions for difficult problems.
- •Analytical Thinking: Have a smart brain that is able to understand business requirements as well as data.
- Education: A computer science, engineering, or related degree is of use.
- Work Experience: Prior experience as a data scientist or data analyst would be advantageous.

How to Become a Data Scientist
If you wish to be a data scientist, remember good opportunities like these do not easily come along. There is a need for time, effort, and education. To be a data scientist, you must spend time learning data science, enhancing your skills, seeking job prospects, and interviewing.
- Obtain a degree: Think about earning a bachelor's or master's degree in computer science, data science, math, statistics, or a related field. A master's degree in data science or machine learning may qualify you for some careers.
- Improve core skills: Enhance your business, programming, and data analysis skills.
- Get internships: Attempt to obtain internships with companies or organizations that utilize data, i.e., technology companies, research institutions, or consulting firms.
- Interview preparation: Be prepared to respond to questions regarding how you would act in various working environments. Employers are interested in how you approach problems, not about facts you possess.
- Get certificates: You can opt for Data Science or Business Analytics certificates in order to demonstrate your skills.
- Coding and SQL practice: Keep on practicing coding, typing SQL queries, and completing actual problems for practice in interviews. Develop a portfolio of projects that you have worked on with real data.

How Much Do Data Scientists Get Paid?
If you wish to know how much data scientists are paid, you should be aware that they are among the best-paid staff in the technology industry. Your salary is largely based on your skills and experience.
Data scientists in the United States earn approximately $150,000 in compensation, including bonuses. They earn a base salary (excluding bonuses) of around $114,000.
In India, a data scientist makes approximately ₹1,174,500 annually in gross salary, with the lowest salary being almost ₹1,000,000. Even in other locations, what you make is based on how experienced you are, where you are, and the company that you work for.
How to obtain Data Science certification?
We are an Education Technology company providing certification training courses to accelerate careers of working professionals worldwide. We impart training through instructor-led classroom workshops, instructor-led live virtual training sessions, and self-paced e-learning courses.
We have successfully conducted training sessions in 108 countries across the globe and enabled thousands of working professionals to enhance the scope of their careers.
Our enterprise training portfolio includes in-demand and globally recognized certification training courses in Project Management, Quality Management, Business Analysis, IT Service Management, Agile and Scrum, Cyber Security, Data Science, and Emerging Technologies. Download our Enterprise Training Catalog from https://www.icertglobal.com/corporate-training-for-enterprises.php and https://www.icertglobal.com/index.php
Popular Courses include:
-
Project Management: PMP, CAPM ,PMI RMP
-
Quality Management: Six Sigma Black Belt ,Lean Six Sigma Green Belt, Lean Management, Minitab,CMMI
-
Business Analysis: CBAP, CCBA, ECBA
-
Agile Training: PMI-ACP , CSM , CSPO
-
Scrum Training: CSM
-
DevOps
-
Program Management: PgMP
-
Cloud Technology: Exin Cloud Computing
-
Citrix Client Adminisration: Citrix Cloud Administration
The 10 top-paying certifications to target in 2025 are:
conclusion
To be a data scientist, you have to go through a step-by-step process from learning from scratch to leading teams and making critical decisions. Experience and hard work will take you forward in this exciting career. There are plenty of opportunities to learn and enable companies to excel at data science.
Contact Us For More Information:
Visit : www.icertglobal.com Email : info@icertglobal.com
Read More
A job description defines the work you will do, the abilities and equipment you will require, and what job listings desire. The following is a brief description of what work as a data scientist generally entails.
A data scientist collects and examines massive amounts of data to uncover important ideas and craft solutions that allow a company to realize its objectives. They apply technical knowledge, study the data in detail, and present their findings in a way that enables individuals to make informed decisions.
Chief Responsibilities:
- Collect data from different sources and organize it for research.
- Process a tremendous amount of data, whether tidy or messy, in order to discover trends and patterns.
- Develop smart computer models that learn from experience to resolve business problems.
- Employ statistics and mathematics to ascertain if the results are accurate.
- Utilize computer programming and AI software to automate.
- Develop easy-to-read reports and charts to present what the data is.
- Collaborate with other groups to execute data concepts on their projects.
- Continue to learn about new tools and methods for working with data.
Tools and Technologies:
- Programming languages: Python, R, SQL
- Data visualization software: Tableau, Power BI, matplotlib
- Machine learning libraries: TensorFlow, Scikit-learn, PyTorch
- Big data tools: Apache Hadoop, Spark
- Cloud platforms: AWS, Azure, Google Cloud
- Statistics programmes: SAS, SPSS
- Data Scientist Careers and Responsibilities: What is a Data Scientist's Job?
A data scientist's responsibilities and job are:
- Obtaining useful information from relevant sources
- Utilizing machine learning tools for feature selection, model generation and model refinement.
- Preparing both organized and messy data before analysis
- Improved data collection techniques so that required information is obtained.
- Cleansing and validation of data to make sure that it's accurate and ready for utilization.
- Sorting through a vast amount of data to discover patterns and answers
- Building predictive systems and smart algorithms
- •Displaying results in a straightforward and easy-to-understand manner
- Offering recommendations and proposals to improve business issues
- Collaborating with Business and IT organizations
Data Scientist Skills
If you wish to be a data scientist, you need to acquire valuable skills that are demanded by the majority of organizations. The following are the necessary skills that the data scientist should acquire:
- Coding Skills: Learn how to apply coding languages like Python, R, and query languages like SQL. Familiarization with other languages like Java or C++ is a plus.
- Statistics: Be familiar with basic statistics including tests, patterns in data, and data measurement. Statistics is useful in aiding you to handle data effectively.
- Machine Learning: Learn how machines can be trained from data using algorithms such as k-Nearest Neighbors, Naive Bayes, and Decision Trees.
- Mathematical Skills: Familiar with key mathematics subjects such as calculus and linear algebra since they enable more accurate predictions and enhanced computer simulations.
- Data Wrangling: You must be able to clean and fix dirty or erroneous data. It is the bulk of the work.
- Data Visualization: Use Tableau or matplotlib to produce images and charts that display data in a straightforward way.
- Communication: Needs to be able to present your results clearly to technical professionals and to regular people.
- Software Skills: I possess a good background in writing and software skills.
- Hands-on Experience: Practice with tools data scientists use daily.
- Problem Solving: Be capable of generating solutions for difficult problems.
- •Analytical Thinking: Have a smart brain that is able to understand business requirements as well as data.
- Education: A computer science, engineering, or related degree is of use.
- Work Experience: Prior experience as a data scientist or data analyst would be advantageous.
How to Become a Data Scientist
If you wish to be a data scientist, remember good opportunities like these do not easily come along. There is a need for time, effort, and education. To be a data scientist, you must spend time learning data science, enhancing your skills, seeking job prospects, and interviewing.
- Obtain a degree: Think about earning a bachelor's or master's degree in computer science, data science, math, statistics, or a related field. A master's degree in data science or machine learning may qualify you for some careers.
- Improve core skills: Enhance your business, programming, and data analysis skills.
- Get internships: Attempt to obtain internships with companies or organizations that utilize data, i.e., technology companies, research institutions, or consulting firms.
- Interview preparation: Be prepared to respond to questions regarding how you would act in various working environments. Employers are interested in how you approach problems, not about facts you possess.
- Get certificates: You can opt for Data Science or Business Analytics certificates in order to demonstrate your skills.
- Coding and SQL practice: Keep on practicing coding, typing SQL queries, and completing actual problems for practice in interviews. Develop a portfolio of projects that you have worked on with real data.
How Much Do Data Scientists Get Paid?
If you wish to know how much data scientists are paid, you should be aware that they are among the best-paid staff in the technology industry. Your salary is largely based on your skills and experience.
Data scientists in the United States earn approximately $150,000 in compensation, including bonuses. They earn a base salary (excluding bonuses) of around $114,000.
In India, a data scientist makes approximately ₹1,174,500 annually in gross salary, with the lowest salary being almost ₹1,000,000. Even in other locations, what you make is based on how experienced you are, where you are, and the company that you work for.
How to obtain Data Science certification?
We are an Education Technology company providing certification training courses to accelerate careers of working professionals worldwide. We impart training through instructor-led classroom workshops, instructor-led live virtual training sessions, and self-paced e-learning courses.
We have successfully conducted training sessions in 108 countries across the globe and enabled thousands of working professionals to enhance the scope of their careers.
Our enterprise training portfolio includes in-demand and globally recognized certification training courses in Project Management, Quality Management, Business Analysis, IT Service Management, Agile and Scrum, Cyber Security, Data Science, and Emerging Technologies. Download our Enterprise Training Catalog from https://www.icertglobal.com/corporate-training-for-enterprises.php and https://www.icertglobal.com/index.php
Popular Courses include:
-
Project Management: PMP, CAPM ,PMI RMP
-
Quality Management: Six Sigma Black Belt ,Lean Six Sigma Green Belt, Lean Management, Minitab,CMMI
-
Business Analysis: CBAP, CCBA, ECBA
-
Agile Training: PMI-ACP , CSM , CSPO
-
Scrum Training: CSM
-
DevOps
-
Program Management: PgMP
-
Cloud Technology: Exin Cloud Computing
-
Citrix Client Adminisration: Citrix Cloud Administration
The 10 top-paying certifications to target in 2025 are:
conclusion
To be a data scientist, you have to go through a step-by-step process from learning from scratch to leading teams and making critical decisions. Experience and hard work will take you forward in this exciting career. There are plenty of opportunities to learn and enable companies to excel at data science.
Contact Us For More Information:
Visit : www.icertglobal.com Email : info@icertglobal.com
Useful Data Science Applications You Should Know
The Data Science role has expanded over time. Now, as computers are quicker and storage is affordable, we can come up with predictions in minutes—something that would take hours! Data Scientists earn about $124,000 a year because there aren't enough the role of skilled individuals in this domain. That's why Data Science with Python is in demand more than ever.
1. Fraud and Risk Detection
One of the first uses of Data Science was in finance. Banks were tired of losing money on poor quality loans. Banks had lots of data on people who had applied for loans but didn't have any idea what to do with it. So, they hired data scientists to help.
2. Healthcare
Data Science is of immense application in the health sector.
Medical Image Analysis
Physicians apply data science in assessing medical images and determining issues, including tumors or clogged arteries. One of the tools that they use is MapReduce to structure images and determine the best means of determining health issues, including searching for diseases in lung scans.

3. Genetics and Genomics
Data Science assists scientists in developing more tailored treatments according to genetics. The aim is to know how our DNA affects our health and how we react to various medications. Data scientists can integrate DNA information with other health information using data science, and that helps them learn more about the nature of diseases and how individuals react to treatment.
4. Drug Development
It is extremely challenging and time-consuming to come up with new medicines—about 12 years! It is extremely expensive and involves a lot of testing. But data science and machine learning make it simple and fast.
5. Patient and Customer Service Online Support
Sometimes, patients won't need to visit the doctor at all. There are mobile apps powered by AI that can treat you at home. The apps are like chatbots—you input your symptoms or questions, and the app provides you with advice based on a massive database of medical information. The apps will actually remind you to take your medicine and schedule doctor's appointments for you if necessary.
6. Internet Search
When one hears Data Science, the first thing that comes to mind is searching on the internet.
We generally think about Google, but there are certain other search engines such as Yahoo, Bing, Ask, and AOL. All these search engines employ data science techniques to provide you with the best possible responses immediately for whatever you are looking for.

7. Targeted Advertising
If you believe that computer searching on the internet is the greatest application of data science, reconsider! Digital marketing is a huge industry. From the commercials you see on websites to the electronic billboards at airports, data science algorithms determine what commercials to display. This enables companies to reach the right individuals at the right time.
8. Recommended Websites
We all receive recommendations for other similar products from sites such as Amazon, don't we? These recommendations enable you to find products that interest you out of billions of options. They also simplify shopping and make it more pleasurable.
9. Advanced Image Recognition
If you upload a photo of friends on Facebook, it will tag them automatically. This is because of a special feature called face recognition. Facebook is constantly enhancing this feature to recognize faces more quickly and more accurately.
10. Speech Recognition
Some of the best speech recognition software are Google Voice, Siri, and Cortana. All these help you to translate your words into text. This means that even if you cannot type, you can still send messages using your voice alone. But sometimes these software do not understand everything properly.
11. Planning Airline Routes
The airline industry is not a cakewalk. Numerous airlines operate in the red since they have no passengers or make too little. It is even tougher with high fuel costs and huge discounts. Airlines apply data science to more efficiently route flights and save.
12. Gaming
Games now employ intelligent computer programs referred to as machine learning algorithms. They learn as you move along and advance to higher levels. The computer in action games watches how you play and readjusts its moves to test your capabilities. Large game corporations such as EA Sports, Sony, and Nintendo apply data science to design games to be more enjoyable and interactive.

13. Augmented Reality
Augmented reality (AR) is an excellent application of data science in the future. It overlays computer images over the real world to make enjoyable experiences. For instance, the Pokémon GO game allows you to view Pokémon on walls or roads through your phone, yet they do not exist. AR employs data and intelligent technology to make it possible.
How to obtain Data Science certification?
We are an Education Technology company providing certification training courses to accelerate careers of working professionals worldwide. We impart training through instructor-led classroom workshops, instructor-led live virtual training sessions, and self-paced e-learning courses.
We have successfully conducted training sessions in 108 countries across the globe and enabled thousands of working professionals to enhance the scope of their careers.
Our enterprise training portfolio includes in-demand and globally recognized certification training courses in Project Management, Quality Management, Business Analysis, IT Service Management, Agile and Scrum, Cyber Security, Data Science, and Emerging Technologies. Download our Enterprise Training Catalog from https://www.icertglobal.com/corporate-training-for-enterprises.php and https://www.icertglobal.com/index.php
Popular Courses include:
-
Project Management: PMP, CAPM ,PMI RMP
-
Quality Management: Six Sigma Black Belt ,Lean Six Sigma Green Belt, Lean Management, Minitab,CMMI
-
Business Analysis: CBAP, CCBA, ECBA
-
Agile Training: PMI-ACP , CSM , CSPO
-
Scrum Training: CSM
-
DevOps
-
Program Management: PgMP
-
Cloud Technology: Exin Cloud Computing
-
Citrix Client Adminisration: Citrix Cloud Administration
The 10 top-paying certifications to target in 2025 are:
Conclusion
Data science is changing the world in various interesting ways, such as in medicine and gaming. There are more career opportunities in this area as these technologies advance. Studying data science skills through courses like iCert Global's can open up numerous doors and enable you to succeed in today's technology world.
Contact Us For More Information:
Visit : www.icertglobal.com Email : info@icertglobal.com
Read More
The Data Science role has expanded over time. Now, as computers are quicker and storage is affordable, we can come up with predictions in minutes—something that would take hours! Data Scientists earn about $124,000 a year because there aren't enough the role of skilled individuals in this domain. That's why Data Science with Python is in demand more than ever.
1. Fraud and Risk Detection
One of the first uses of Data Science was in finance. Banks were tired of losing money on poor quality loans. Banks had lots of data on people who had applied for loans but didn't have any idea what to do with it. So, they hired data scientists to help.
2. Healthcare
Data Science is of immense application in the health sector.
Medical Image Analysis
Physicians apply data science in assessing medical images and determining issues, including tumors or clogged arteries. One of the tools that they use is MapReduce to structure images and determine the best means of determining health issues, including searching for diseases in lung scans.
3. Genetics and Genomics
Data Science assists scientists in developing more tailored treatments according to genetics. The aim is to know how our DNA affects our health and how we react to various medications. Data scientists can integrate DNA information with other health information using data science, and that helps them learn more about the nature of diseases and how individuals react to treatment.
4. Drug Development
It is extremely challenging and time-consuming to come up with new medicines—about 12 years! It is extremely expensive and involves a lot of testing. But data science and machine learning make it simple and fast.
5. Patient and Customer Service Online Support
Sometimes, patients won't need to visit the doctor at all. There are mobile apps powered by AI that can treat you at home. The apps are like chatbots—you input your symptoms or questions, and the app provides you with advice based on a massive database of medical information. The apps will actually remind you to take your medicine and schedule doctor's appointments for you if necessary.
6. Internet Search
When one hears Data Science, the first thing that comes to mind is searching on the internet.
We generally think about Google, but there are certain other search engines such as Yahoo, Bing, Ask, and AOL. All these search engines employ data science techniques to provide you with the best possible responses immediately for whatever you are looking for.
7. Targeted Advertising
If you believe that computer searching on the internet is the greatest application of data science, reconsider! Digital marketing is a huge industry. From the commercials you see on websites to the electronic billboards at airports, data science algorithms determine what commercials to display. This enables companies to reach the right individuals at the right time.
8. Recommended Websites
We all receive recommendations for other similar products from sites such as Amazon, don't we? These recommendations enable you to find products that interest you out of billions of options. They also simplify shopping and make it more pleasurable.
9. Advanced Image Recognition
If you upload a photo of friends on Facebook, it will tag them automatically. This is because of a special feature called face recognition. Facebook is constantly enhancing this feature to recognize faces more quickly and more accurately.
10. Speech Recognition
Some of the best speech recognition software are Google Voice, Siri, and Cortana. All these help you to translate your words into text. This means that even if you cannot type, you can still send messages using your voice alone. But sometimes these software do not understand everything properly.
11. Planning Airline Routes
The airline industry is not a cakewalk. Numerous airlines operate in the red since they have no passengers or make too little. It is even tougher with high fuel costs and huge discounts. Airlines apply data science to more efficiently route flights and save.
12. Gaming
Games now employ intelligent computer programs referred to as machine learning algorithms. They learn as you move along and advance to higher levels. The computer in action games watches how you play and readjusts its moves to test your capabilities. Large game corporations such as EA Sports, Sony, and Nintendo apply data science to design games to be more enjoyable and interactive.
13. Augmented Reality
Augmented reality (AR) is an excellent application of data science in the future. It overlays computer images over the real world to make enjoyable experiences. For instance, the Pokémon GO game allows you to view Pokémon on walls or roads through your phone, yet they do not exist. AR employs data and intelligent technology to make it possible.
How to obtain Data Science certification?
We are an Education Technology company providing certification training courses to accelerate careers of working professionals worldwide. We impart training through instructor-led classroom workshops, instructor-led live virtual training sessions, and self-paced e-learning courses.
We have successfully conducted training sessions in 108 countries across the globe and enabled thousands of working professionals to enhance the scope of their careers.
Our enterprise training portfolio includes in-demand and globally recognized certification training courses in Project Management, Quality Management, Business Analysis, IT Service Management, Agile and Scrum, Cyber Security, Data Science, and Emerging Technologies. Download our Enterprise Training Catalog from https://www.icertglobal.com/corporate-training-for-enterprises.php and https://www.icertglobal.com/index.php
Popular Courses include:
-
Project Management: PMP, CAPM ,PMI RMP
-
Quality Management: Six Sigma Black Belt ,Lean Six Sigma Green Belt, Lean Management, Minitab,CMMI
-
Business Analysis: CBAP, CCBA, ECBA
-
Agile Training: PMI-ACP , CSM , CSPO
-
Scrum Training: CSM
-
DevOps
-
Program Management: PgMP
-
Cloud Technology: Exin Cloud Computing
-
Citrix Client Adminisration: Citrix Cloud Administration
The 10 top-paying certifications to target in 2025 are:
Conclusion
Data science is changing the world in various interesting ways, such as in medicine and gaming. There are more career opportunities in this area as these technologies advance. Studying data science skills through courses like iCert Global's can open up numerous doors and enable you to succeed in today's technology world.
Contact Us For More Information:
Visit : www.icertglobal.com Email : info@icertglobal.com
Kickstart Your Tableau Learning Journey
As the world gets more and more connected, huge amounts of data are generated daily. Big and small businesses use data to learn new things and make smart choices. But to be helpful, the data must be studied. This is called data analysis — turning raw numbers into simple charts and dashboards.
What is Data Visualization?
Data visualization is merely making data visible in the form of images such as charts, graphs, and maps. These pictures help you spot patterns, trends, and stories hidden in the data. It makes the information easy to comprehend and communicate.

Today, businesses can consider a vast amount of information in order to make good decisions, minimize mistakes, and generate more profit.
Why is Data Visualization Important?
Data visualization turns messy data from different places into something simple and clear to understand. It removes unnecessary or duplicating information and leaves the useful elements. This becomes easier for people to make decisions.
It helps answer questions like:
What patterns and trends can we find?
• Is there anything unusual appearing?
• Can we compare various numbers across time?
What is the message the data conveys to us?
When companies process more data every second, visuals assist them in understanding it at a fast pace. If they do not, it will be time and money-wasting. But effective visuals avoid that and save resources.
Where do we apply Data Visualization?
You can find data visualization in weather maps, air pollution graphs, income statements, and Facebook statistics. It facilitates individuals to make intelligent and swift decisions in various fields.
Tableau: The Most Suitable Tool to Visualize Data
There are many tools that can be used to display data in pictures. This is helpful to data professionals when presenting results or to decision-makers using business data. Tableau is an excellent tool. It was founded in 2003 and allows you to create charts, graphs, maps, and other pictures without coding. You can use it on your computer, on the web, or even on your phone.
Tableau supports nearly any database. It enables you to turn numbers into shareable, easy-to-understand images with one click. Its worksheets and dashboards allow individuals to see data in an instant. That is the reason why numerous various forms of jobs and industries utilize it.
Why Learn Tableau?
Tableau is a very handy tool that allows individuals to transform large collections of data into easy-to-look-at charts and reports. It is popular with data scientists and business leaders alike because it is quick and easy to work with. Even non-technical individuals are able to create and share interactive dashboards with Tableau.
Tableau is very quick—it processes 100 times quicker than most older tools. It is also able to link with the R programming language to enable individuals to view large, complex data in an easy way.
What Makes Tableau a Good Tool ?
- Simple to Use
- You can drag and drop data—no coding needed!
- Supports multiple sources of information.
- Tableau can handle Excel, SQL, cloud data, and more.
- Powerful Dashboards
- You can merge huge data sets and identify insights with ease.
- Real-time Reports
- Get instant feedback and see what is working and what is not.
- Smart Dashboards
- You can have several charts and views on a single screen and deploy it on the internet or from your phone.

10 Easy Tableau Learning Tips
1. Visit Tableau Charts Online.
See what other people do with Tableau across industries. It gives you great inspiration.
2. Engage in the Tableau Community
Join Tableau gurus on social media. You can get advice and insights from them.
3. Read Tableau Books
Start with starter books like:
• Visualize Your Data! by Daniel G. Murray
• Sharing Data with Tableau by Ben Jones
• Practical Tableau by Ryan Sleeper
4. Identify the Skills You Require
To use Tableau effectively, it is helpful to know:
• How to utilize data (Excel, Google Sheets)
• Basic math and stats
• Clustering and classifying information
• Some coding (for added features)

5. Practice a lot.
Download Tableau and experiment. Share your projects using Tableau Public and observe how others do it.
6. Use Free Data Sets
Search for free data online to exercise. Visit sites such as Kaggle or public data discussion forums.
7. Make a Portfolio
Make dashboards and display your work on the internet. Check out the Tableau Public Gallery for inspiration.
8. Share Your Projects
Share your dashboards on GitHub or similar websites. Ask for feedback to improve your work.
9. Join a Tableau Group
Connect with others learning Tableau. Participate in local or online forums.
10. Get Training
Some companies use Tableau, and purchasing it can be a career booster. You can take a class with iCert Global to prepare for the Tableau Desktop 10 exam.
How to obtain Tableau certification?
We are an Education Technology company providing certification training courses to accelerate careers of working professionals worldwide. We impart training through instructor-led classroom workshops, instructor-led live virtual training sessions, and self-paced e-learning courses.
We have successfully conducted training sessions in 108 countries across the globe and enabled thousands of working professionals to enhance the scope of their careers.
Our enterprise training portfolio includes in-demand and globally recognized certification training courses in Project Management, Quality Management, Business Analysis, IT Service Management, Agile and Scrum, Cyber Security, Data Science, and Emerging Technologies. Download our Enterprise Training Catalog from https://www.icertglobal.com/corporate-training-for-enterprises.php and https://www.icertglobal.com/index.php
Popular Courses include:
-
Project Management: PMP, CAPM ,PMI RMP
-
Quality Management: Six Sigma Black Belt ,Lean Six Sigma Green Belt, Lean Management, Minitab,CMMI
-
Business Analysis: CBAP, CCBA, ECBA
-
Agile Training: PMI-ACP , CSM , CSPO
-
Scrum Training: CSM
-
DevOps
-
Program Management: PgMP
-
Cloud Technology: Exin Cloud Computing
-
Citrix Client Adminisration: Citrix Cloud Administration
The 10 top-paying certifications to target in 2025 are:
Conclusion:
Learning Tableau is a practical option if you want to comprehend and visualize data in a simple way. It is easy to use, accommodates most data sources, and enables you to make more informed decisions with simple-to-understand visuals. If you get trained from organizations such as iCert Global, you can acquire good skills and develop your career in business and data.
Contact Us For More Information:
Visit : www.icertglobal.com Email : info@icertglobal.com
Read More
As the world gets more and more connected, huge amounts of data are generated daily. Big and small businesses use data to learn new things and make smart choices. But to be helpful, the data must be studied. This is called data analysis — turning raw numbers into simple charts and dashboards.
What is Data Visualization?
Data visualization is merely making data visible in the form of images such as charts, graphs, and maps. These pictures help you spot patterns, trends, and stories hidden in the data. It makes the information easy to comprehend and communicate.
Today, businesses can consider a vast amount of information in order to make good decisions, minimize mistakes, and generate more profit.
Why is Data Visualization Important?
Data visualization turns messy data from different places into something simple and clear to understand. It removes unnecessary or duplicating information and leaves the useful elements. This becomes easier for people to make decisions.
It helps answer questions like:
What patterns and trends can we find?
• Is there anything unusual appearing?
• Can we compare various numbers across time?
What is the message the data conveys to us?
When companies process more data every second, visuals assist them in understanding it at a fast pace. If they do not, it will be time and money-wasting. But effective visuals avoid that and save resources.
Where do we apply Data Visualization?
You can find data visualization in weather maps, air pollution graphs, income statements, and Facebook statistics. It facilitates individuals to make intelligent and swift decisions in various fields.
Tableau: The Most Suitable Tool to Visualize Data
There are many tools that can be used to display data in pictures. This is helpful to data professionals when presenting results or to decision-makers using business data. Tableau is an excellent tool. It was founded in 2003 and allows you to create charts, graphs, maps, and other pictures without coding. You can use it on your computer, on the web, or even on your phone.
Tableau supports nearly any database. It enables you to turn numbers into shareable, easy-to-understand images with one click. Its worksheets and dashboards allow individuals to see data in an instant. That is the reason why numerous various forms of jobs and industries utilize it.
Why Learn Tableau?
Tableau is a very handy tool that allows individuals to transform large collections of data into easy-to-look-at charts and reports. It is popular with data scientists and business leaders alike because it is quick and easy to work with. Even non-technical individuals are able to create and share interactive dashboards with Tableau.
Tableau is very quick—it processes 100 times quicker than most older tools. It is also able to link with the R programming language to enable individuals to view large, complex data in an easy way.
What Makes Tableau a Good Tool ?
- Simple to Use
- You can drag and drop data—no coding needed!
- Supports multiple sources of information.
- Tableau can handle Excel, SQL, cloud data, and more.
- Powerful Dashboards
- You can merge huge data sets and identify insights with ease.
- Real-time Reports
- Get instant feedback and see what is working and what is not.
- Smart Dashboards
- You can have several charts and views on a single screen and deploy it on the internet or from your phone.
10 Easy Tableau Learning Tips
1. Visit Tableau Charts Online.
See what other people do with Tableau across industries. It gives you great inspiration.
2. Engage in the Tableau Community
Join Tableau gurus on social media. You can get advice and insights from them.
3. Read Tableau Books
Start with starter books like:
• Visualize Your Data! by Daniel G. Murray
• Sharing Data with Tableau by Ben Jones
• Practical Tableau by Ryan Sleeper
4. Identify the Skills You Require
To use Tableau effectively, it is helpful to know:
• How to utilize data (Excel, Google Sheets)
• Basic math and stats
• Clustering and classifying information
• Some coding (for added features)
5. Practice a lot.
Download Tableau and experiment. Share your projects using Tableau Public and observe how others do it.
6. Use Free Data Sets
Search for free data online to exercise. Visit sites such as Kaggle or public data discussion forums.
7. Make a Portfolio
Make dashboards and display your work on the internet. Check out the Tableau Public Gallery for inspiration.
8. Share Your Projects
Share your dashboards on GitHub or similar websites. Ask for feedback to improve your work.
9. Join a Tableau Group
Connect with others learning Tableau. Participate in local or online forums.
10. Get Training
Some companies use Tableau, and purchasing it can be a career booster. You can take a class with iCert Global to prepare for the Tableau Desktop 10 exam.
How to obtain Tableau certification?
We are an Education Technology company providing certification training courses to accelerate careers of working professionals worldwide. We impart training through instructor-led classroom workshops, instructor-led live virtual training sessions, and self-paced e-learning courses.
We have successfully conducted training sessions in 108 countries across the globe and enabled thousands of working professionals to enhance the scope of their careers.
Our enterprise training portfolio includes in-demand and globally recognized certification training courses in Project Management, Quality Management, Business Analysis, IT Service Management, Agile and Scrum, Cyber Security, Data Science, and Emerging Technologies. Download our Enterprise Training Catalog from https://www.icertglobal.com/corporate-training-for-enterprises.php and https://www.icertglobal.com/index.php
Popular Courses include:
-
Project Management: PMP, CAPM ,PMI RMP
-
Quality Management: Six Sigma Black Belt ,Lean Six Sigma Green Belt, Lean Management, Minitab,CMMI
-
Business Analysis: CBAP, CCBA, ECBA
-
Agile Training: PMI-ACP , CSM , CSPO
-
Scrum Training: CSM
-
DevOps
-
Program Management: PgMP
-
Cloud Technology: Exin Cloud Computing
-
Citrix Client Adminisration: Citrix Cloud Administration
The 10 top-paying certifications to target in 2025 are:
Conclusion:
Learning Tableau is a practical option if you want to comprehend and visualize data in a simple way. It is easy to use, accommodates most data sources, and enables you to make more informed decisions with simple-to-understand visuals. If you get trained from organizations such as iCert Global, you can acquire good skills and develop your career in business and data.
Contact Us For More Information:
Visit : www.icertglobal.com Email : info@icertglobal.com
How Data Science and AI Are Different from Each Other
The terms artificial intelligence (AI) and data science are frequently used interchangeably. Deep learning and machine learning are examples of AI. These tools are used in data science to analyze data, identify trends, predict future events, and exchange practical ideas. Thus, it can be difficult to decide between data science and artificial intelligence.
Additionally, robust data science work is required for tools like machine learning to ensure that the data is clean, valuable, and prepared to support system learning. Data science is a broad field that frequently incorporates concepts from machine learning and artificial intelligence. Data science skills are also necessary for many AI-related jobs, such as becoming an AI engineer. To find out more about these subjects, look into courses on Icert Global.
Data science: what is it?
The field of data science helps people understand information by combining science, math, and computers. Through the use of procedures and tools, it enables us to learn from both clean and untidy data. To help people make informed decisions, data science combines knowledge from disciplines like information science, computer science, and mathematics. Data science's primary components are:
• Data Collection: Gathering information from various sources.
Data cleaning is the process of arranging and correcting data to make it easier to study.
• Examining the Data (EDA): Identifying trends and understanding connections.
• Creating Models: Sorting or speculating about potential outcomes using computer programs.
Artificial intelligence (AI): what is it?
Making computers and other machines behave like people is known as artificial intelligence, or AI. Like people, these intelligent machines are capable of thought, learning, and decision-making. AI aims to build machines that are capable of tasks that humans typically perform, such as seeing and comprehending images, identifying voices, making decisions, and translating between languages.

AI types include:
• Narrow AI: Capable of performing a single task, such as voice assistants (like Alexa or Siri).
• General AI: Capable of many tasks that a human can perform.
• Super AI: More intelligent than humans and capable of performing tasks even more effectively.
Major Distinctions Exist Between Data Science and Artificial Intelligence
• Goal: Data science focuses on the identification of valuable information within extensive datasets while AI creates intelligent systems which function independently based on their programmed instructions.
• What They Cover: Data science investigates data through mathematical analysis and graphical interpretation and computer-based programming. AI represents a vast domain in which robots and natural language comprehension systems exist.
• Tools Used: Data scientists analyze data through Python and R programming languages along with Jupyter and Tableau platforms. AI professionals utilize TensorFlow and PyTorch frameworks alongside OpenAI-developed tools to develop their work.
What Intelligence Artificiality and Data Science Share
Machine learning is applied in both data science and artificial intelligence. Data scientists use it to examine data and forecast what may follow. It is used by AI experts to assist machines in deriving knowledge from data.
• Rely on Data: Both call for a lot of data. Data science uses it to discover relevant insights; artificial intelligence uses it to train intelligent systems.
• Both disciplines draw on concepts from math, computer science, and other branches of knowledge.
• Fast-changing domains are both developing quickly with new inventions and tools and are facilitating the invention of new technology.

Begin Your Career Path Here
Two interesting fields changing how things work in the quick world of technology today are Data Science and Artificial Intelligence. Choosing between them is knowing what you are good at and what you like, not which is preferable. Both routes provide excellent opportunities for learning and development if you enjoy spotting patterns in data or are fascinated by intelligent robots able of learning.
If you want to learn more and get really good at Data Science or AI, iCert Global's Post Graduate Programs can help. These programs teach you the important skills you need to do well in today’s tech world. When you join one, you’re not just taking a class — you’re getting ready to be a leader in the future. Start learning with iCert Global and feel confident about your career path.
How to obtain Data Science and AI certification?
We are an Education Technology company providing certification training courses to accelerate careers of working professionals worldwide. We impart training through instructor-led classroom workshops, instructor-led live virtual training sessions, and self-paced e-learning courses.
We have successfully conducted training sessions in 108 countries across the globe and enabled thousands of working professionals to enhance the scope of their careers.
Our enterprise training portfolio includes in-demand and globally recognized certification training courses in Project Management, Quality Management, Business Analysis, IT Service Management, Agile and Scrum, Cyber Security, Data Science, and Emerging Technologies. Download our Enterprise Training Catalog from https://www.icertglobal.com/corporate-training-for-enterprises.php and https://www.icertglobal.com/index.php
Popular Courses include:
-
Project Management: PMP, CAPM ,PMI RMP
-
Quality Management: Six Sigma Black Belt ,Lean Six Sigma Green Belt, Lean Management, Minitab,CMMI
-
Business Analysis: CBAP, CCBA, ECBA
-
Agile Training: PMI-ACP , CSM , CSPO
-
Scrum Training: CSM
-
DevOps
-
Program Management: PgMP
-
Cloud Technology: Exin Cloud Computing
-
Citrix Client Adminisration: Citrix Cloud Administration
The 10 top-paying certifications to target in 2025 are:
Conclusion
Data Science focuses on analyzing and interpreting data, while AI aims to build smart systems that can learn and make decisions. Both fields offer unique career opportunities and are rapidly evolving. iCert Global’s courses can help you develop the skills needed to excel in either path.
Contact Us For More Information:
Visit : www.icertglobal.com Email : info@icertglobal.com
Read More
The terms artificial intelligence (AI) and data science are frequently used interchangeably. Deep learning and machine learning are examples of AI. These tools are used in data science to analyze data, identify trends, predict future events, and exchange practical ideas. Thus, it can be difficult to decide between data science and artificial intelligence.
Additionally, robust data science work is required for tools like machine learning to ensure that the data is clean, valuable, and prepared to support system learning. Data science is a broad field that frequently incorporates concepts from machine learning and artificial intelligence. Data science skills are also necessary for many AI-related jobs, such as becoming an AI engineer. To find out more about these subjects, look into courses on Icert Global.
Data science: what is it?
The field of data science helps people understand information by combining science, math, and computers. Through the use of procedures and tools, it enables us to learn from both clean and untidy data. To help people make informed decisions, data science combines knowledge from disciplines like information science, computer science, and mathematics. Data science's primary components are:
• Data Collection: Gathering information from various sources.
Data cleaning is the process of arranging and correcting data to make it easier to study.
• Examining the Data (EDA): Identifying trends and understanding connections.
• Creating Models: Sorting or speculating about potential outcomes using computer programs.
Artificial intelligence (AI): what is it?
Making computers and other machines behave like people is known as artificial intelligence, or AI. Like people, these intelligent machines are capable of thought, learning, and decision-making. AI aims to build machines that are capable of tasks that humans typically perform, such as seeing and comprehending images, identifying voices, making decisions, and translating between languages.
AI types include:
• Narrow AI: Capable of performing a single task, such as voice assistants (like Alexa or Siri).
• General AI: Capable of many tasks that a human can perform.
• Super AI: More intelligent than humans and capable of performing tasks even more effectively.
Major Distinctions Exist Between Data Science and Artificial Intelligence
• Goal: Data science focuses on the identification of valuable information within extensive datasets while AI creates intelligent systems which function independently based on their programmed instructions.
• What They Cover: Data science investigates data through mathematical analysis and graphical interpretation and computer-based programming. AI represents a vast domain in which robots and natural language comprehension systems exist.
• Tools Used: Data scientists analyze data through Python and R programming languages along with Jupyter and Tableau platforms. AI professionals utilize TensorFlow and PyTorch frameworks alongside OpenAI-developed tools to develop their work.
What Intelligence Artificiality and Data Science Share
Machine learning is applied in both data science and artificial intelligence. Data scientists use it to examine data and forecast what may follow. It is used by AI experts to assist machines in deriving knowledge from data.
• Rely on Data: Both call for a lot of data. Data science uses it to discover relevant insights; artificial intelligence uses it to train intelligent systems.
• Both disciplines draw on concepts from math, computer science, and other branches of knowledge.
• Fast-changing domains are both developing quickly with new inventions and tools and are facilitating the invention of new technology.
Begin Your Career Path Here
Two interesting fields changing how things work in the quick world of technology today are Data Science and Artificial Intelligence. Choosing between them is knowing what you are good at and what you like, not which is preferable. Both routes provide excellent opportunities for learning and development if you enjoy spotting patterns in data or are fascinated by intelligent robots able of learning.
If you want to learn more and get really good at Data Science or AI, iCert Global's Post Graduate Programs can help. These programs teach you the important skills you need to do well in today’s tech world. When you join one, you’re not just taking a class — you’re getting ready to be a leader in the future. Start learning with iCert Global and feel confident about your career path.
How to obtain Data Science and AI certification?
We are an Education Technology company providing certification training courses to accelerate careers of working professionals worldwide. We impart training through instructor-led classroom workshops, instructor-led live virtual training sessions, and self-paced e-learning courses.
We have successfully conducted training sessions in 108 countries across the globe and enabled thousands of working professionals to enhance the scope of their careers.
Our enterprise training portfolio includes in-demand and globally recognized certification training courses in Project Management, Quality Management, Business Analysis, IT Service Management, Agile and Scrum, Cyber Security, Data Science, and Emerging Technologies. Download our Enterprise Training Catalog from https://www.icertglobal.com/corporate-training-for-enterprises.php and https://www.icertglobal.com/index.php
Popular Courses include:
-
Project Management: PMP, CAPM ,PMI RMP
-
Quality Management: Six Sigma Black Belt ,Lean Six Sigma Green Belt, Lean Management, Minitab,CMMI
-
Business Analysis: CBAP, CCBA, ECBA
-
Agile Training: PMI-ACP , CSM , CSPO
-
Scrum Training: CSM
-
DevOps
-
Program Management: PgMP
-
Cloud Technology: Exin Cloud Computing
-
Citrix Client Adminisration: Citrix Cloud Administration
The 10 top-paying certifications to target in 2025 are:
Conclusion
Data Science focuses on analyzing and interpreting data, while AI aims to build smart systems that can learn and make decisions. Both fields offer unique career opportunities and are rapidly evolving. iCert Global’s courses can help you develop the skills needed to excel in either path.
Contact Us For More Information:
Visit : www.icertglobal.com Email : info@icertglobal.com
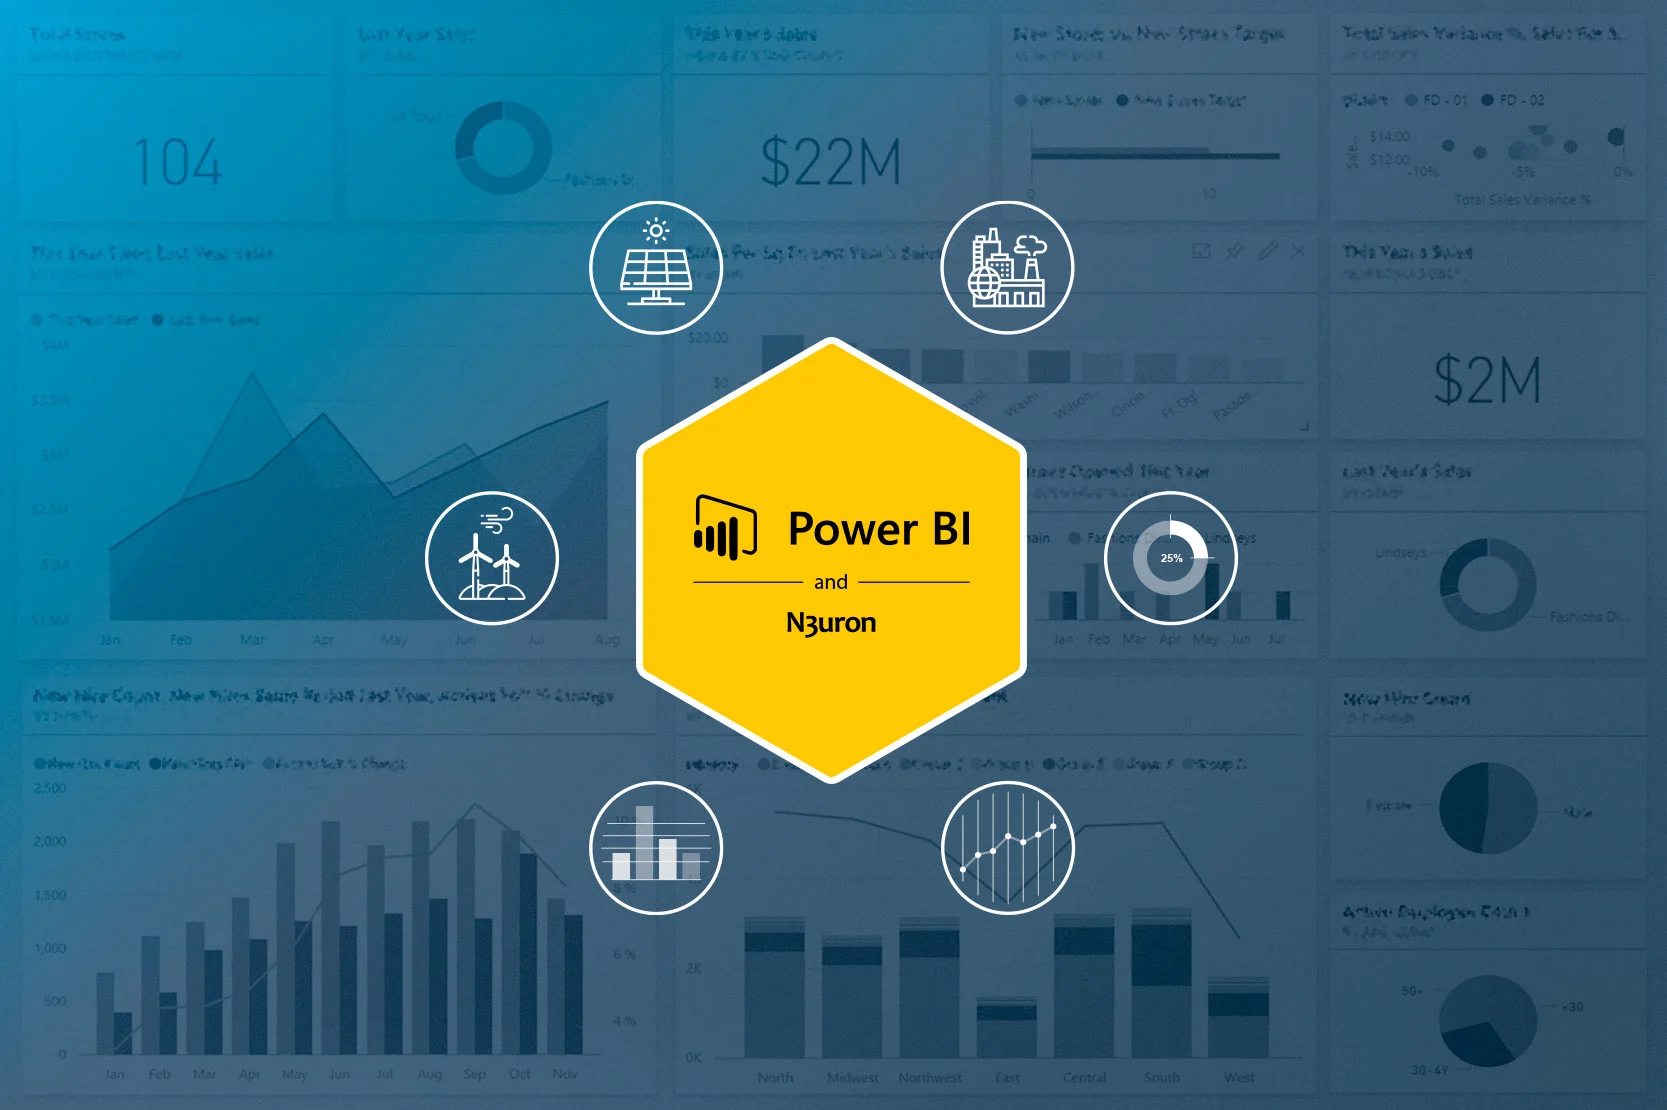
Top 20 Reasons to Use Power BI in 2025
Power BI was initially codenamed as Project Crescent and started in July 2011 with SQL Server. In September 2013, it was named Power BI and was part of Office 365. Power BI was released as a separate product in July 2015. It added new features like better data connections and better security. Microsoft currently releases new features for Power BI every month, and customers can download the latest version from the Power BI website. Windows 10 users can also download Power BI Desktop from the Windows Store.
The advantages of Power BI are as follows:.
1. AI in Power BI helps non-data scientists with activities like:
- Image recognition
- Text analysis
- Building machine learning models
- You can connect to Azure Machine Learning to analyze data and gain useful information.
2. Facilitates Analyzing and Sharing Big : Data Power BI uses Azure to analyze big data and share data in real-time. It assists businesses in collaborating better and discovering concealed data insights, enhancing decision-making.

3.Works with Multiple Sources of Data: Power BI supports multiple sources of data such as Excel, cloud applications, and databases. Businesses can now access all their data in an organized manner, whether it's structured or unstructured.
4. Custom Dashboards and Reports : Power BI enables you to create dashboards and reports that fit your business requirements. You can re-arrange data to build interactive reports. Then, you can simply share them with your company or team.
5. Access Anywhere : Power BI is accessible anywhere, wherever you might be. This is beneficial for remote teams, as they can access data and work together no matter where they are.
6. Real-time Information : Power BI keeps its dashboards up to date instantly, so you always have the most recent data. This enables companies to immediately fix problems, find opportunities, and manage vital data in a timely manner.
7. Power BI is great with Excel: It allows businesses who use Excel to make reports easily connect their data. Then, they can create interactive visualizations.
8. Regular Updates : Microsoft continually updates Power BI with new functionality and improvements. This keeps firms up to speed with the newest software without requiring manual updates.
9. Simple-to-UseDesign : Power BI is user-friendly in nature, with interactive features and drag-and-drop capabilities that allow one to easily navigate data and draw insights without necessarily being a tech whiz.
10. Tailoring Security Features : Power BI enables you to define security filters so that users view just data that is relevant to them. This protects data and reduces the likelihood of a data breach.
11. Budget-Friendly and Cost-Effective : Power BI offers a budget-friendly solution, especially for small and medium-sized businesses. It has three options: Power BI Desktop (free), Power BI Pro (affordable at $9.99 per user/month), and Power BI Premium (pricing varies based on usage).

12. No Technical Expertise Required : Power BI is easy to use without technical staff. You can build reports and dashboards by means of easy dragging and dropping of data. It's easy to use, even if the users lack technical skills.
13. Use Anywhere, Anytime : You can use Power BI anywhere. Whether you are at home, away, or in a meeting, it is available on Windows, iOS, or Android devices. You just need an internet connection.
14. Works Well with Other Microsoft Software : Power BI works well with Microsoft software like Excel, SharePoint, and Teams. You can bring in data from Excel. Then, you can create visualizations and share reports through SharePoint or Teams. This makes collaboration easier.
15. Power BI enhances teamwork : by enabling simple sharing of dashboards and reports among teams. You even have the option of getting a notification when a new report is published, and sharing it via email or publishing on another website.
16. Time-Saving Templates : Power BI also comes with pre-designed templates for different industries and business functions. They are employed to design reports within a limited time frame, saving time and enabling standardization of reports between departments.
17. Scalability : Power BI grows with your business. Power BI adjusts to your requirements, whether you are a small business or a big company. You will not have to worry about the infrastructure.
18. Data-Driven Insights : Power BI enables you to discover important insights in your data using intuitive tools and interactive charts, resulting in smarter decisions and business success.
19. Optimal Performance : Power BI ensures reports load promptly and effectively even with big data. It minimizes latency and optimizes resources for optimal performance.

20. Version Control : Power BI enables you to monitor changes within your reports and datasets. You can revert to an older version and collaborate with your team nicely on report projects.
How to obtain Power BI certification?
We are an Education Technology company providing certification training courses to accelerate careers of working professionals worldwide. We impart training through instructor-led classroom workshops, instructor-led live virtual training sessions, and self-paced e-learning courses.
We have successfully conducted training sessions in 108 countries across the globe and enabled thousands of working professionals to enhance the scope of their careers.
Our enterprise training portfolio includes in-demand and globally recognized certification training courses in Project Management, Quality Management, Business Analysis, IT Service Management, Agile and Scrum, Cyber Security, Data Science, and Emerging Technologies. Download our Enterprise Training Catalog from https://www.icertglobal.com/corporate-training-for-enterprises.php and https://www.icertglobal.com/index.php
Popular Courses include:
-
Project Management: PMP, CAPM ,PMI RMP
-
Quality Management: Six Sigma Black Belt ,Lean Six Sigma Green Belt, Lean Management, Minitab,CMMI
-
Business Analysis: CBAP, CCBA, ECBA
-
Agile Training: PMI-ACP , CSM , CSPO
-
Scrum Training: CSM
-
DevOps
-
Program Management: PgMP
-
Cloud Technology: Exin Cloud Computing
-
Citrix Client Adminisration: Citrix Cloud Administration
The 10 top-paying certifications to target in 2025 are:
Conclusion
Power BI is a strong tool. It is easy to see and comprehend data. It contains features such as Power Query and Power Pivot. It can connect to various data sources and provides real-time data. Power BI provides an easy and cost-effective means for companies to make data-driven decisions.
Contact Us For More Information:
Visit : www.icertglobal.com Email : info@icertglobal.com
Read More
Power BI was initially codenamed as Project Crescent and started in July 2011 with SQL Server. In September 2013, it was named Power BI and was part of Office 365. Power BI was released as a separate product in July 2015. It added new features like better data connections and better security. Microsoft currently releases new features for Power BI every month, and customers can download the latest version from the Power BI website. Windows 10 users can also download Power BI Desktop from the Windows Store.
The advantages of Power BI are as follows:.
1. AI in Power BI helps non-data scientists with activities like:
- Image recognition
- Text analysis
- Building machine learning models
- You can connect to Azure Machine Learning to analyze data and gain useful information.
2. Facilitates Analyzing and Sharing Big : Data Power BI uses Azure to analyze big data and share data in real-time. It assists businesses in collaborating better and discovering concealed data insights, enhancing decision-making.
3.Works with Multiple Sources of Data: Power BI supports multiple sources of data such as Excel, cloud applications, and databases. Businesses can now access all their data in an organized manner, whether it's structured or unstructured.
4. Custom Dashboards and Reports : Power BI enables you to create dashboards and reports that fit your business requirements. You can re-arrange data to build interactive reports. Then, you can simply share them with your company or team.
5. Access Anywhere : Power BI is accessible anywhere, wherever you might be. This is beneficial for remote teams, as they can access data and work together no matter where they are.
6. Real-time Information : Power BI keeps its dashboards up to date instantly, so you always have the most recent data. This enables companies to immediately fix problems, find opportunities, and manage vital data in a timely manner.
7. Power BI is great with Excel: It allows businesses who use Excel to make reports easily connect their data. Then, they can create interactive visualizations.
8. Regular Updates : Microsoft continually updates Power BI with new functionality and improvements. This keeps firms up to speed with the newest software without requiring manual updates.
9. Simple-to-UseDesign : Power BI is user-friendly in nature, with interactive features and drag-and-drop capabilities that allow one to easily navigate data and draw insights without necessarily being a tech whiz.
10. Tailoring Security Features : Power BI enables you to define security filters so that users view just data that is relevant to them. This protects data and reduces the likelihood of a data breach.
11. Budget-Friendly and Cost-Effective : Power BI offers a budget-friendly solution, especially for small and medium-sized businesses. It has three options: Power BI Desktop (free), Power BI Pro (affordable at $9.99 per user/month), and Power BI Premium (pricing varies based on usage).
12. No Technical Expertise Required : Power BI is easy to use without technical staff. You can build reports and dashboards by means of easy dragging and dropping of data. It's easy to use, even if the users lack technical skills.
13. Use Anywhere, Anytime : You can use Power BI anywhere. Whether you are at home, away, or in a meeting, it is available on Windows, iOS, or Android devices. You just need an internet connection.
14. Works Well with Other Microsoft Software : Power BI works well with Microsoft software like Excel, SharePoint, and Teams. You can bring in data from Excel. Then, you can create visualizations and share reports through SharePoint or Teams. This makes collaboration easier.
15. Power BI enhances teamwork : by enabling simple sharing of dashboards and reports among teams. You even have the option of getting a notification when a new report is published, and sharing it via email or publishing on another website.
16. Time-Saving Templates : Power BI also comes with pre-designed templates for different industries and business functions. They are employed to design reports within a limited time frame, saving time and enabling standardization of reports between departments.
17. Scalability : Power BI grows with your business. Power BI adjusts to your requirements, whether you are a small business or a big company. You will not have to worry about the infrastructure.
18. Data-Driven Insights : Power BI enables you to discover important insights in your data using intuitive tools and interactive charts, resulting in smarter decisions and business success.
19. Optimal Performance : Power BI ensures reports load promptly and effectively even with big data. It minimizes latency and optimizes resources for optimal performance.
20. Version Control : Power BI enables you to monitor changes within your reports and datasets. You can revert to an older version and collaborate with your team nicely on report projects.
How to obtain Power BI certification?
We are an Education Technology company providing certification training courses to accelerate careers of working professionals worldwide. We impart training through instructor-led classroom workshops, instructor-led live virtual training sessions, and self-paced e-learning courses.
We have successfully conducted training sessions in 108 countries across the globe and enabled thousands of working professionals to enhance the scope of their careers.
Our enterprise training portfolio includes in-demand and globally recognized certification training courses in Project Management, Quality Management, Business Analysis, IT Service Management, Agile and Scrum, Cyber Security, Data Science, and Emerging Technologies. Download our Enterprise Training Catalog from https://www.icertglobal.com/corporate-training-for-enterprises.php and https://www.icertglobal.com/index.php
Popular Courses include:
-
Project Management: PMP, CAPM ,PMI RMP
-
Quality Management: Six Sigma Black Belt ,Lean Six Sigma Green Belt, Lean Management, Minitab,CMMI
-
Business Analysis: CBAP, CCBA, ECBA
-
Agile Training: PMI-ACP , CSM , CSPO
-
Scrum Training: CSM
-
DevOps
-
Program Management: PgMP
-
Cloud Technology: Exin Cloud Computing
-
Citrix Client Adminisration: Citrix Cloud Administration
The 10 top-paying certifications to target in 2025 are:
Conclusion
Power BI is a strong tool. It is easy to see and comprehend data. It contains features such as Power Query and Power Pivot. It can connect to various data sources and provides real-time data. Power BI provides an easy and cost-effective means for companies to make data-driven decisions.
Contact Us For More Information:
Visit : www.icertglobal.com Email : info@icertglobal.com

Power BI Most Valuable Features
Power BI is software created by Microsoft. It helps individuals to get a better idea of data by transforming it into easy-to-see colorful graphs, charts, and dashboards. Rather than viewing cluttered numbers and tables, Power BI helps one to view graphics easily.
Suppose you have a lemonade stand and you wish to see how much money you earned last week. Rather than looking at every sale individually, Power BI can present you with a bar chart of how much money you earned per day. It's easy to understand information at a glance and have fun with it.

Why You Should Learn Power BI ?
Learning Power BI is beneficial to anyone who has to work with data—whether you're a student, teacher, business owner, or even a coach for a sports team. Nowadays, nearly every career uses some form of data. Power BI assists you to:
• Spot patterns and trends
• Make better choices
• Automate reports to save time.
• Tell others about what you have learned in a nutshell
For instance, a student could use Power BI to track student grades. A store manager could use it to view what is selling the most. A student could use it to display research findings for the science fair.
Key Features of Power BI
1. Begin Early
Power BI is easy to get started with. You can sign up for free and view your data instantly. No complicated software to install and hours of training needed. It also includes pre-built dashboards for top services such as Google Analytics and Salesforce. This allows you to begin learning from your data within minutes.
2. Use Information From Anywhere
Your information can be saved in Excel spreadsheets, databases, websites, or cloud storage such as OneDrive or Google Drive. Power BI can link to a variety of data sources. No matter where your information resides, Power BI can bring it all together in one location.
3. Fix Problems Right Away
Power BI employs "real-time dashboards." What it means is you can see at once when anything happens—sales declining or acquiring a new client.
This enables you to fix problems in a timely fashion. For instance, if sales are slow on a particular day, you can act quickly and make a change before it becomes a major issue.
4. Content Packs
Power BI has something called "Content Packs." These are pre-tuned collections of data sources, reports, and dashboards that let you start quickly with a particular service. For example, if you are working with QuickBooks, you can utilize a content pack to instantly view the company finances.
5. Print Dashboards
You might also want a hard copy of your reports for meeting or for class presentations. Power BI enables you to print your dashboards so that you can present your results in person.
6. Phrase questions in your own words.
One of the most user-friendly things about Power BI is that you can type something like: "What were my best-selling products last year?" and Power BI will give you an answer in chart or graph form. It's like searching with a search engine, but on your own data!
7. Customized Graphs and Charts
Each user or business is unique. Power BI lets you utilize various chart, map, and visual types that best suit your data. You can even download other users' newly created visual types.

8. DAX – A Robust Formula Language
Power BI uses a formula language called DAX (Data Analysis Expressions). It contains more than 200 built-in functions for advanced calculations. Don't panic—you don't need to learn them all at once! As you get more experienced, these functions will assist you in building better data models.
9. Access Data Easily
Power BI Desktop can retrieve data from a lot of locations—whether data resides on your machine or in the cloud. It doesn't matter whether the data is in structured form (such as rows and columns) or unstructured form (such as images or documents). Additional data sources are added each month.
10. Stay in Touch While Traveling
You don't need to be sitting at your desk to view your data. Power BI supports Android phone apps, iPhone apps, and Windows apps. You can view reports, get alerts, and make decisions remotely.
11. Integrate Power BI with Other Software
If you are a programmer, you can use something called an API (Application Programming Interface) to link Power BI to your website or existing application. This allows businesses to integrate Power BI capabilities into the existing applications.
New Power BI Features (Released in January)
Microsoft updates Power BI on a regular basis to improve it. Some of the amazing new features that were added recently are:
1. Hide Report Pages
Sometimes you might want to share just part of a report. Power BI now allows you to hide a handful of pages before sharing. Right-click on a page tab and select "Hide." Hidden pages will not appear to others, but you will still be able to see them while editing.
2. Alter Label Backgrounds
You can now set labels on charts and maps to your preferred background color. Your graphics thus look more pleasing, and people can read your labels more easily.
3. Adjust space between bars.
You now have an option for how far apart bars are in a bar chart. You can make them more or less separated, depending on how you want it to appear.
4. More Room for Axis Labels
If your bottom or side labels in your chart are getting cut off, you don't have to enlarge the whole chart. There is a new feature where you can enlarge the label space without enlarging the whole chart.
5. Ask "Top N" in Q&A
Power BI's natural language capability is now capable of interpreting questions such as "What are my top 3 best-selling products?" or "Top 5 departments by performance." It gives immediate and accurate and visual responses to such questions.

How to obtain Power BI certification?
We are an Education Technology company providing certification training courses to accelerate careers of working professionals worldwide. We impart training through instructor-led classroom workshops, instructor-led live virtual training sessions, and self-paced e-learning courses.
We have successfully conducted training sessions in 108 countries across the globe and enabled thousands of working professionals to enhance the scope of their careers.
Our enterprise training portfolio includes in-demand and globally recognized certification training courses in Project Management, Quality Management, Business Analysis, IT Service Management, Agile and Scrum, Cyber Security, Data Science, and Emerging Technologies. Download our Enterprise Training Catalog from https://www.icertglobal.com/corporate-training-for-enterprises.php and https://www.icertglobal.com/index.php
Popular Courses include:
-
Project Management: PMP, CAPM ,PMI RMP
-
Quality Management: Six Sigma Black Belt ,Lean Six Sigma Green Belt, Lean Management, Minitab,CMMI
-
Business Analysis: CBAP, CCBA, ECBA
-
Agile Training: PMI-ACP , CSM , CSPO
-
Scrum Training: CSM
-
DevOps
-
Program Management: PgMP
-
Cloud Technology: Exin Cloud Computing
-
Citrix Client Adminisration: Citrix Cloud Administration
The 10 top-paying certifications to target in 2025 are:
Conclusion
Power BI is a powerful tool that simplifies data analysis and visualization. Its ease of use and real-time data make it ideal for both professionals and students. To excel in Power BI and advance your career through passing the power BI exam and get certification, look for top-rated courses by iCert Global.
Contact Us For More Information:
Visit : www.icertglobal.com Email : info@icertglobal.com
Read More
Power BI is software created by Microsoft. It helps individuals to get a better idea of data by transforming it into easy-to-see colorful graphs, charts, and dashboards. Rather than viewing cluttered numbers and tables, Power BI helps one to view graphics easily.
Suppose you have a lemonade stand and you wish to see how much money you earned last week. Rather than looking at every sale individually, Power BI can present you with a bar chart of how much money you earned per day. It's easy to understand information at a glance and have fun with it.
Why You Should Learn Power BI ?
Learning Power BI is beneficial to anyone who has to work with data—whether you're a student, teacher, business owner, or even a coach for a sports team. Nowadays, nearly every career uses some form of data. Power BI assists you to:
• Spot patterns and trends
• Make better choices
• Automate reports to save time.
• Tell others about what you have learned in a nutshell
For instance, a student could use Power BI to track student grades. A store manager could use it to view what is selling the most. A student could use it to display research findings for the science fair.
Key Features of Power BI
1. Begin Early
Power BI is easy to get started with. You can sign up for free and view your data instantly. No complicated software to install and hours of training needed. It also includes pre-built dashboards for top services such as Google Analytics and Salesforce. This allows you to begin learning from your data within minutes.
2. Use Information From Anywhere
Your information can be saved in Excel spreadsheets, databases, websites, or cloud storage such as OneDrive or Google Drive. Power BI can link to a variety of data sources. No matter where your information resides, Power BI can bring it all together in one location.
3. Fix Problems Right Away
Power BI employs "real-time dashboards." What it means is you can see at once when anything happens—sales declining or acquiring a new client.
This enables you to fix problems in a timely fashion. For instance, if sales are slow on a particular day, you can act quickly and make a change before it becomes a major issue.
4. Content Packs
Power BI has something called "Content Packs." These are pre-tuned collections of data sources, reports, and dashboards that let you start quickly with a particular service. For example, if you are working with QuickBooks, you can utilize a content pack to instantly view the company finances.
5. Print Dashboards
You might also want a hard copy of your reports for meeting or for class presentations. Power BI enables you to print your dashboards so that you can present your results in person.
6. Phrase questions in your own words.
One of the most user-friendly things about Power BI is that you can type something like: "What were my best-selling products last year?" and Power BI will give you an answer in chart or graph form. It's like searching with a search engine, but on your own data!
7. Customized Graphs and Charts
Each user or business is unique. Power BI lets you utilize various chart, map, and visual types that best suit your data. You can even download other users' newly created visual types.
8. DAX – A Robust Formula Language
Power BI uses a formula language called DAX (Data Analysis Expressions). It contains more than 200 built-in functions for advanced calculations. Don't panic—you don't need to learn them all at once! As you get more experienced, these functions will assist you in building better data models.
9. Access Data Easily
Power BI Desktop can retrieve data from a lot of locations—whether data resides on your machine or in the cloud. It doesn't matter whether the data is in structured form (such as rows and columns) or unstructured form (such as images or documents). Additional data sources are added each month.
10. Stay in Touch While Traveling
You don't need to be sitting at your desk to view your data. Power BI supports Android phone apps, iPhone apps, and Windows apps. You can view reports, get alerts, and make decisions remotely.
11. Integrate Power BI with Other Software
If you are a programmer, you can use something called an API (Application Programming Interface) to link Power BI to your website or existing application. This allows businesses to integrate Power BI capabilities into the existing applications.
New Power BI Features (Released in January)
Microsoft updates Power BI on a regular basis to improve it. Some of the amazing new features that were added recently are:
1. Hide Report Pages
Sometimes you might want to share just part of a report. Power BI now allows you to hide a handful of pages before sharing. Right-click on a page tab and select "Hide." Hidden pages will not appear to others, but you will still be able to see them while editing.
2. Alter Label Backgrounds
You can now set labels on charts and maps to your preferred background color. Your graphics thus look more pleasing, and people can read your labels more easily.
3. Adjust space between bars.
You now have an option for how far apart bars are in a bar chart. You can make them more or less separated, depending on how you want it to appear.
4. More Room for Axis Labels
If your bottom or side labels in your chart are getting cut off, you don't have to enlarge the whole chart. There is a new feature where you can enlarge the label space without enlarging the whole chart.
5. Ask "Top N" in Q&A
Power BI's natural language capability is now capable of interpreting questions such as "What are my top 3 best-selling products?" or "Top 5 departments by performance." It gives immediate and accurate and visual responses to such questions.
How to obtain Power BI certification?
We are an Education Technology company providing certification training courses to accelerate careers of working professionals worldwide. We impart training through instructor-led classroom workshops, instructor-led live virtual training sessions, and self-paced e-learning courses.
We have successfully conducted training sessions in 108 countries across the globe and enabled thousands of working professionals to enhance the scope of their careers.
Our enterprise training portfolio includes in-demand and globally recognized certification training courses in Project Management, Quality Management, Business Analysis, IT Service Management, Agile and Scrum, Cyber Security, Data Science, and Emerging Technologies. Download our Enterprise Training Catalog from https://www.icertglobal.com/corporate-training-for-enterprises.php and https://www.icertglobal.com/index.php
Popular Courses include:
-
Project Management: PMP, CAPM ,PMI RMP
-
Quality Management: Six Sigma Black Belt ,Lean Six Sigma Green Belt, Lean Management, Minitab,CMMI
-
Business Analysis: CBAP, CCBA, ECBA
-
Agile Training: PMI-ACP , CSM , CSPO
-
Scrum Training: CSM
-
DevOps
-
Program Management: PgMP
-
Cloud Technology: Exin Cloud Computing
-
Citrix Client Adminisration: Citrix Cloud Administration
The 10 top-paying certifications to target in 2025 are:
Conclusion
Power BI is a powerful tool that simplifies data analysis and visualization. Its ease of use and real-time data make it ideal for both professionals and students. To excel in Power BI and advance your career through passing the power BI exam and get certification, look for top-rated courses by iCert Global.
Contact Us For More Information:
Visit : www.icertglobal.com Email : info@icertglobal.com
Simple Database Management with Microsoft Access
In the present day, information is extremely valuable. Consequently, individuals utilize several tools to organize and make sense of it. One extremely useful tool is Microsoft Access. It is simple to use large sets of information in a manner where everything remains in order.
What is Microsoft Access?
Microsoft Access is a computer program made by Microsoft that helps you store and manage information. It comes with the Microsoft 365 set of programs. Microsoft Access is used to help users store, keep track of, and analyze data. Access was launched way back in 1992 and is one of the oldest programs still in use today.
Characteristics of Microsoft Access
1. Easy to Navigate
Access has an easy-to-use screen that lets you make tables, forms, and reports just by dragging and dropping things. You do not have to be a technology wizard to use its capabilities.
2. Pre-Designed Templates
It has templates to assist you in getting started. For instance, it has templates for inventory tracking, customer management, etc.
3. Smart Data Search (Queries)
Access enables you to search and structure your data in smart ways. Through sorting, filtering, or merging data between two tables, you can simply find what you are looking for.
4. Charts and Reports
You can make neat reports, charts, and summaries using the information you collect.
5. Custom Forms
You have the ability to design your own forms so that it is easy for users to insert or see data. You can add things like text boxes or buttons.
6. Automate Your Work with Macros
Access enables you to use macros to automate routine tasks—in this case, opening a form or performing a search—leaving you free to do other things.
7. Write Your Own Code
If you possess the talent of working with VBA (Visual Basic for Applications), then you can devise your own solutions and automate lengthy tasks.
8. Share with Others
You can allow other people to have access to your database and specify who can see or alter the data.
9. Interoperability with Other Microsoft Products
Access is Excel-compatible, Word-compatible, and compatible with other Microsoft applications. You can export or import data and apply it in so many different ways.

How Is Microsoft Access Different from Excel?
Let us talk about what Microsoft Excel is before we proceed to the differences. Excel is a program that enables you to deal with numbers and manage small sets of data. It is most proficient at performing simple calculations and creating charts.
How Microsoft Access Is Used ?
Microsoft Access contains several useful tools that make data management and understanding easier. Some of the applications of the way it is used are discussed below:
• Import from Excel or other databases.
• Design data viewing or entry forms
• Conduct searches (queries) to reveal in-depth information.
• Produce reports that can be printed or exported to PDF files
• Access the data using SQL
Main Components of Microsoft Access
Tables
This is where the data is kept, like a big table with rows and columns. You can store it all in one big table (a flat database) or break the data into many small related tables (a relational database).
Relational Databases
Rather than grouping all of it in one location, it is preferable to divide the data into separate tables that are related. This simplifies organization and searching.
Forms.
Forms allow users to enter or view information without directly having to deal with tables.
Macros
Macros are handy little programs that allow you to have routine things done automatically, like opening a form or running a search.
Modules
Modules are special collections of instructions in a programming language known as VBA. They let you do more advanced tasks.
Questions
Queries are searches that help you locate precise information from your tables. They are priceless, particularly when your database is packed with information.
Reports
Reports help you to sort and classify your data, so it is easy to read, share, or print.

How Microsoft Access is Constructed (Architecture) ?
Microsoft Access is a relational database management system that gives you the means to design and work with databases in a user-friendly interface.
Here's a look at its makeup:
• Tables: All your information in rows and columns
• Forms: Streamline the process of data entry and viewing.
• Questions: Find, structure, and filter the information you need.
• Reports: Present your data through charts, summaries, or graphs.
• Macros: Simplify tasks such as opening a form
• Modules: Code your own using VBA.
• Security: Decide who can look at or change the data.
With additional groups, Access can connect to large systems like SQL Server, where a large number of users can access the same database at the same time.
The Common Uses of Microsoft Access.
• Data Storage: Maintain a well-organized repository of important data.
• Inventory Management: Monitor items, locations, and inventory
• Customer Management (CRM): Keep and maintain customer information.
• Project Management: Track tasks and deadlines
• Employee Records: Keep employee information and work history
• Planning Events: Coordinate guest lists and RSVPs.
• Small Business Help: Monitor your finances, sales, and stock.
Types of Microsoft Access Databases
1. Flat File Databases
Simple and contains just one table—good for basic requirements.
2. Relational Databases
Employ multiple tables that refer to each other—best suited to organize complex data.
Microsoft Access Data Types
Access enables you to save different kinds of data. The following are the most common kinds:
• Attachment: Stores images or documents
• Auto Number: Automatically numbers each record
• Calculated: Makes calculations using data from other disciplines
• Currency: Stores money amounts
• Date/Time: Stores dates and times
• Hyperlink: Links to websites
• Long Text: Contains much text (up to 63,999 characters)
• Number: Stores numbers for calculations
• OLE Objects: Stores files like audio or video
• Short Text: Names of stores or brief information
• Yes/No: Holds single true or false values

How to obtain certification?
We are an Education Technology company providing certification training courses to accelerate careers of working professionals worldwide. We impart training through instructor-led classroom workshops, instructor-led live virtual training sessions, and self-paced e-learning courses.
We have successfully conducted training sessions in 108 countries across the globe and enabled thousands of working professionals to enhance the scope of their careers.
Our enterprise training portfolio includes in-demand and globally recognized certification training courses in Project Management, Quality Management, Business Analysis, IT Service Management, Agile and Scrum, Cyber Security, Data Science, and Emerging Technologies. Download our Enterprise Training Catalog from https://www.icertglobal.com/corporate-training-for-enterprises.php and https://www.icertglobal.com/index.php
Popular Courses include:
-
Project Management: PMP, CAPM ,PMI RMP
-
Quality Management: Six Sigma Black Belt ,Lean Six Sigma Green Belt, Lean Management, Minitab,CMMI
-
Business Analysis: CBAP, CCBA, ECBA
-
Agile Training: PMI-ACP , CSM , CSPO
-
Scrum Training: CSM
-
DevOps
-
Program Management: PgMP
-
Cloud Technology: Exin Cloud Computing
-
Citrix Client Adminisration: Citrix Cloud Administration
The 10 top-paying certifications to target in 2025 are:
Conclusion
Microsoft Access is a smart data work tool. You can simply monitor, track, and report information. Enroll in the courses at iCert Global to study Microsoft Access the right way.
Contact Us For More Information:
Visit : www.icertglobal.com Email : info@icertglobal.com
Read More
In the present day, information is extremely valuable. Consequently, individuals utilize several tools to organize and make sense of it. One extremely useful tool is Microsoft Access. It is simple to use large sets of information in a manner where everything remains in order.
What is Microsoft Access?
Microsoft Access is a computer program made by Microsoft that helps you store and manage information. It comes with the Microsoft 365 set of programs. Microsoft Access is used to help users store, keep track of, and analyze data. Access was launched way back in 1992 and is one of the oldest programs still in use today.
Characteristics of Microsoft Access
1. Easy to Navigate
Access has an easy-to-use screen that lets you make tables, forms, and reports just by dragging and dropping things. You do not have to be a technology wizard to use its capabilities.
2. Pre-Designed Templates
It has templates to assist you in getting started. For instance, it has templates for inventory tracking, customer management, etc.
3. Smart Data Search (Queries)
Access enables you to search and structure your data in smart ways. Through sorting, filtering, or merging data between two tables, you can simply find what you are looking for.
4. Charts and Reports
You can make neat reports, charts, and summaries using the information you collect.
5. Custom Forms
You have the ability to design your own forms so that it is easy for users to insert or see data. You can add things like text boxes or buttons.
6. Automate Your Work with Macros
Access enables you to use macros to automate routine tasks—in this case, opening a form or performing a search—leaving you free to do other things.
7. Write Your Own Code
If you possess the talent of working with VBA (Visual Basic for Applications), then you can devise your own solutions and automate lengthy tasks.
8. Share with Others
You can allow other people to have access to your database and specify who can see or alter the data.
9. Interoperability with Other Microsoft Products
Access is Excel-compatible, Word-compatible, and compatible with other Microsoft applications. You can export or import data and apply it in so many different ways.
How Is Microsoft Access Different from Excel?
Let us talk about what Microsoft Excel is before we proceed to the differences. Excel is a program that enables you to deal with numbers and manage small sets of data. It is most proficient at performing simple calculations and creating charts.
How Microsoft Access Is Used ?
Microsoft Access contains several useful tools that make data management and understanding easier. Some of the applications of the way it is used are discussed below:
• Import from Excel or other databases.
• Design data viewing or entry forms
• Conduct searches (queries) to reveal in-depth information.
• Produce reports that can be printed or exported to PDF files
• Access the data using SQL
Main Components of Microsoft Access
Tables
This is where the data is kept, like a big table with rows and columns. You can store it all in one big table (a flat database) or break the data into many small related tables (a relational database).
Relational Databases
Rather than grouping all of it in one location, it is preferable to divide the data into separate tables that are related. This simplifies organization and searching.
Forms.
Forms allow users to enter or view information without directly having to deal with tables.
Macros
Macros are handy little programs that allow you to have routine things done automatically, like opening a form or running a search.
Modules
Modules are special collections of instructions in a programming language known as VBA. They let you do more advanced tasks.
Questions
Queries are searches that help you locate precise information from your tables. They are priceless, particularly when your database is packed with information.
Reports
Reports help you to sort and classify your data, so it is easy to read, share, or print.
How Microsoft Access is Constructed (Architecture) ?
Microsoft Access is a relational database management system that gives you the means to design and work with databases in a user-friendly interface.
Here's a look at its makeup:
• Tables: All your information in rows and columns
• Forms: Streamline the process of data entry and viewing.
• Questions: Find, structure, and filter the information you need.
• Reports: Present your data through charts, summaries, or graphs.
• Macros: Simplify tasks such as opening a form
• Modules: Code your own using VBA.
• Security: Decide who can look at or change the data.
With additional groups, Access can connect to large systems like SQL Server, where a large number of users can access the same database at the same time.
The Common Uses of Microsoft Access.
• Data Storage: Maintain a well-organized repository of important data.
• Inventory Management: Monitor items, locations, and inventory
• Customer Management (CRM): Keep and maintain customer information.
• Project Management: Track tasks and deadlines
• Employee Records: Keep employee information and work history
• Planning Events: Coordinate guest lists and RSVPs.
• Small Business Help: Monitor your finances, sales, and stock.
Types of Microsoft Access Databases
1. Flat File Databases
Simple and contains just one table—good for basic requirements.
2. Relational Databases
Employ multiple tables that refer to each other—best suited to organize complex data.
Microsoft Access Data Types
Access enables you to save different kinds of data. The following are the most common kinds:
• Attachment: Stores images or documents
• Auto Number: Automatically numbers each record
• Calculated: Makes calculations using data from other disciplines
• Currency: Stores money amounts
• Date/Time: Stores dates and times
• Hyperlink: Links to websites
• Long Text: Contains much text (up to 63,999 characters)
• Number: Stores numbers for calculations
• OLE Objects: Stores files like audio or video
• Short Text: Names of stores or brief information
• Yes/No: Holds single true or false values
How to obtain certification?
We are an Education Technology company providing certification training courses to accelerate careers of working professionals worldwide. We impart training through instructor-led classroom workshops, instructor-led live virtual training sessions, and self-paced e-learning courses.
We have successfully conducted training sessions in 108 countries across the globe and enabled thousands of working professionals to enhance the scope of their careers.
Our enterprise training portfolio includes in-demand and globally recognized certification training courses in Project Management, Quality Management, Business Analysis, IT Service Management, Agile and Scrum, Cyber Security, Data Science, and Emerging Technologies. Download our Enterprise Training Catalog from https://www.icertglobal.com/corporate-training-for-enterprises.php and https://www.icertglobal.com/index.php
Popular Courses include:
-
Project Management: PMP, CAPM ,PMI RMP
-
Quality Management: Six Sigma Black Belt ,Lean Six Sigma Green Belt, Lean Management, Minitab,CMMI
-
Business Analysis: CBAP, CCBA, ECBA
-
Agile Training: PMI-ACP , CSM , CSPO
-
Scrum Training: CSM
-
DevOps
-
Program Management: PgMP
-
Cloud Technology: Exin Cloud Computing
-
Citrix Client Adminisration: Citrix Cloud Administration
The 10 top-paying certifications to target in 2025 are:
Conclusion
Microsoft Access is a smart data work tool. You can simply monitor, track, and report information. Enroll in the courses at iCert Global to study Microsoft Access the right way.
Contact Us For More Information:
Visit : www.icertglobal.com Email : info@icertglobal.com

Top 11 Statistical Tools for Effective Data Research
Many sectors rely on usual evidence and proof generation based on data. The evidence-based practice era relies primarily on researchers' ability to report out on findings. Stats have always been involved in other decisions made by leaders and executives when making decisions. Statistically working and visually displaying data can appear to be overwhelming.
Here is a list of the common statistical tools:
1. R Considering R if you are going to work with data - this is one of the best tools you can use as R is an open-source statistics option that is free! Every researcher employing statistics uses R and the number of productive tools available to store and process your data is great! Although it takes a while to learn R is a power use your data statistically, but processing takes time.
2. Python -Python owns a versatile language which has increased its use in analyses and stats especially as it relates to research and analysis. Python is useful to bring together statically programming and the other experts that collects and analyzes text, organizes tests, analyzes photos and so forth.

3. GraphPad Prism - GraphPad Prism is an excellent tool to do scientific charts, graphs, fitting curves, and make stats easier to use. Prism has many different analyses, t-tests, comparisons, study tables, survival, etc.
4. SPSS (Statistical Package for the Social Sciences) - SPSS is a very common tool to study human behavior. SPSS is a straightforward program to use, because of its clean interface.
5. SAS (Statistical Analysis System) - SAS is a very good statistical analysis tool. SAS is a very powerful program, as used in healthcare, as well as business. SAS allows you to complete advanced statistics as well as graphs and charts.
6. Stata - Stata is a strong technology tool as well, one that social science researchers, researchers in economics, biology, and political science also use.
7. Minitab - Minitab is a good option because it is usable by both novices and experts. You can perform all kinds of statistical analysis and produce a variety of graphs, including histograms and scatter plots.
8. Excel - Excel can be good for statistical analysis too, but is better for doing simple data work. Excel does not independently perform statistical operations, but you can depict data and use simple stats with it.

9. MATLAB - MATLAB is a programming language/tool often used by engineers and scientists. MATLAB allows users to program code to solve specific problems. It allows the user to customize their work as needed, and gives them flexibility.
10. JMP - JMP is an analysis tool developed by scientists and engineers with the intent to aid users in the processing of data and uncovering key patterns.
11. Tableau - Tableau is an analysis tool that is used to turn data into visually appealing views. Tableau is well established in data dashboards, connecting large amounts of data effectively while creating a simple visual for the user.
How to obtain certification?
We are an Education Technology company providing certification training courses to accelerate careers of working professionals worldwide. We impart training through instructor-led classroom workshops, instructor-led live virtual training sessions, and self-paced e-learning courses.
We have successfully conducted training sessions in 108 countries across the globe and enabled thousands of working professionals to enhance the scope of their careers.
Our enterprise training portfolio includes in-demand and globally recognized certification training courses in Project Management, Quality Management, Business Analysis, IT Service Management, Agile and Scrum, Cyber Security, Data Science, and Emerging Technologies. Download our Enterprise Training Catalog from https://www.icertglobal.com/corporate-training-for-enterprises.php and https://www.icertglobal.com/index.php
Popular Courses include:
-
Project Management: PMP, CAPM ,PMI RMP
-
Quality Management: Six Sigma Black Belt ,Lean Six Sigma Green Belt, Lean Management, Minitab,CMMI
-
Business Analysis: CBAP, CCBA, ECBA
-
Agile Training: PMI-ACP , CSM , CSPO
-
Scrum Training: CSM
-
DevOps
-
Program Management: PgMP
-
Cloud Technology: Exin Cloud Computing
-
Citrix Client Adminisration: Citrix Cloud Administration
The 10 top-paying certifications to target in 2025 are:
Conclusion
Having good knowledge of all the essential statistical tools is central to carrying out good research and obtaining reliable results and valid interpretations. The tools you select can help you avoid misleading conclusions and good decision-making. If you want to learn more about becoming a data analytics expert consider taking an iCert Global course or certification.
FAQs
1. What are the common uses for statistical tools?
Some methods in research use statistics and statistical tools to support claims, help consolidate and make sense from large datasets, help visually represent a complex data set or pull a lot of things together quickly.
2. Are there free statistical tools?
There are many commercial and open-source statistical analysis tools available. Some free tools include TIMi Suite, MiniTab, Grapher, XLSTAT, NumXL, Posit, Qualtrics DesignXM, and SAS Viya.
3. Can I use Tableau to perform statistical analysis?
Tableau is essentially a statistical data analysis tool that has been developed so that anyone can use it to perform the analysis of statistical data.
Contact Us For More Information:
Visit : www.icertglobal.com Email : info@icertglobal.com
Read More
Many sectors rely on usual evidence and proof generation based on data. The evidence-based practice era relies primarily on researchers' ability to report out on findings. Stats have always been involved in other decisions made by leaders and executives when making decisions. Statistically working and visually displaying data can appear to be overwhelming.
Here is a list of the common statistical tools:
1. R Considering R if you are going to work with data - this is one of the best tools you can use as R is an open-source statistics option that is free! Every researcher employing statistics uses R and the number of productive tools available to store and process your data is great! Although it takes a while to learn R is a power use your data statistically, but processing takes time.
2. Python -Python owns a versatile language which has increased its use in analyses and stats especially as it relates to research and analysis. Python is useful to bring together statically programming and the other experts that collects and analyzes text, organizes tests, analyzes photos and so forth.
3. GraphPad Prism - GraphPad Prism is an excellent tool to do scientific charts, graphs, fitting curves, and make stats easier to use. Prism has many different analyses, t-tests, comparisons, study tables, survival, etc.
4. SPSS (Statistical Package for the Social Sciences) - SPSS is a very common tool to study human behavior. SPSS is a straightforward program to use, because of its clean interface.
5. SAS (Statistical Analysis System) - SAS is a very good statistical analysis tool. SAS is a very powerful program, as used in healthcare, as well as business. SAS allows you to complete advanced statistics as well as graphs and charts.
6. Stata - Stata is a strong technology tool as well, one that social science researchers, researchers in economics, biology, and political science also use.
7. Minitab - Minitab is a good option because it is usable by both novices and experts. You can perform all kinds of statistical analysis and produce a variety of graphs, including histograms and scatter plots.
8. Excel - Excel can be good for statistical analysis too, but is better for doing simple data work. Excel does not independently perform statistical operations, but you can depict data and use simple stats with it.
9. MATLAB - MATLAB is a programming language/tool often used by engineers and scientists. MATLAB allows users to program code to solve specific problems. It allows the user to customize their work as needed, and gives them flexibility.
10. JMP - JMP is an analysis tool developed by scientists and engineers with the intent to aid users in the processing of data and uncovering key patterns.
11. Tableau - Tableau is an analysis tool that is used to turn data into visually appealing views. Tableau is well established in data dashboards, connecting large amounts of data effectively while creating a simple visual for the user.
How to obtain certification?
We are an Education Technology company providing certification training courses to accelerate careers of working professionals worldwide. We impart training through instructor-led classroom workshops, instructor-led live virtual training sessions, and self-paced e-learning courses.
We have successfully conducted training sessions in 108 countries across the globe and enabled thousands of working professionals to enhance the scope of their careers.
Our enterprise training portfolio includes in-demand and globally recognized certification training courses in Project Management, Quality Management, Business Analysis, IT Service Management, Agile and Scrum, Cyber Security, Data Science, and Emerging Technologies. Download our Enterprise Training Catalog from https://www.icertglobal.com/corporate-training-for-enterprises.php and https://www.icertglobal.com/index.php
Popular Courses include:
-
Project Management: PMP, CAPM ,PMI RMP
-
Quality Management: Six Sigma Black Belt ,Lean Six Sigma Green Belt, Lean Management, Minitab,CMMI
-
Business Analysis: CBAP, CCBA, ECBA
-
Agile Training: PMI-ACP , CSM , CSPO
-
Scrum Training: CSM
-
DevOps
-
Program Management: PgMP
-
Cloud Technology: Exin Cloud Computing
-
Citrix Client Adminisration: Citrix Cloud Administration
The 10 top-paying certifications to target in 2025 are:
Conclusion
Having good knowledge of all the essential statistical tools is central to carrying out good research and obtaining reliable results and valid interpretations. The tools you select can help you avoid misleading conclusions and good decision-making. If you want to learn more about becoming a data analytics expert consider taking an iCert Global course or certification.
FAQs
1. What are the common uses for statistical tools?
Some methods in research use statistics and statistical tools to support claims, help consolidate and make sense from large datasets, help visually represent a complex data set or pull a lot of things together quickly.
2. Are there free statistical tools?
There are many commercial and open-source statistical analysis tools available. Some free tools include TIMi Suite, MiniTab, Grapher, XLSTAT, NumXL, Posit, Qualtrics DesignXM, and SAS Viya.
3. Can I use Tableau to perform statistical analysis?
Tableau is essentially a statistical data analysis tool that has been developed so that anyone can use it to perform the analysis of statistical data.
Contact Us For More Information:
Visit : www.icertglobal.com Email : info@icertglobal.com
Beginner Tableau Projects to Master in 2025
Tableau is a widely used computer program, which most organizations and IT departments utilize to visualize and report data. Tableau projects help you connect to different sources of data, examine the data, and generate comprehensible graphics in an effort to familiarize yourself with the data. Tableau projects are preferred by business analysts because they can share the data with others, who are in the company, and work with the result immediately. Through collaboration of data from different sources, they transform it into useful information, which helps individuals to make informed data-based decisions.
What are Tableau Projects?
Tableau projects show you how to utilize the tools to create data visual reports. The projects show you how to look at data and how to present it in a straightforward manner to your audience.
Having multiple Tableau projects will enable you to learn more, get better at your skills, and have your resume look great. This is whether you have done any Tableau certifications or learned by yourself.

Skill Development
Creating Tableau projects will help you learn a lot about managing and analyzing data. Finishing Tableau projects will give you the opportunity to practice five main skills. Learning Tableau will give you valuable skills that you can use in most careers.
1. Data Analysis: Tableau projects will need you to look at a lot of data. You will use different kinds of data and answer key questions that help businesses decide what to do.
2. Data Visualization: Tableau projects will assist you in becoming more proficient in presenting data in graphical forms.
3. Business Decisions: Business intelligence helps people understand data so they can make choices.
4. RDBMS: You will also study various database systems such as MySQL, Oracle, and Microsoft SQL Server.
5. Data Modelling: Data modeling facilitates easier organization and understanding of data. In Tableau, you will discover how data is modeled so that you can handle it better.

Tableau Projects to Practice
- As a new professional, it will assist you to understand how various tools of data visualization should be used and then improve the outcome depending on the client's requirements.
- Having several projects to show will help you learn more, develop your skills, and make your resume stand out, whether you’ve earned Tableau certifications or learned it on your own.
Patient Risk Health Dashboard
This Tableau project concept is from the medical sector. It makes you more effective at managing data through large datasets. In this project, you will gather and aggregate patient information from a hospital into Tableau. The objective is to identify and forecast any health hazards based on this information.
Stock Market Analysis Dashboard
This project contains much data that keep on fluctuating. The stock market creates a lot of data that can be analyzed. To depict how the stock market index is fluctuating along with its highest and lowest points, you can use various types of charts such as area and trend charts. Pie charts and bar charts can also be used to represent the number of stocks traded.
Covid-19 Analysis Dashboard
The pandemic of Covid-19 hit the entire world. With so many cases, it was hard for governments to realize how serious the situation was. But with the help of tools such as Tableau, analysts were able to utilize government data to present the actual picture around the globe.
Global Market Analysis
This project will show you what real companies are actually doing. If you succeed with this project, you will show that you are able to solve business problems by analyzing data and producing the best visualizations to illustrate your results.
Helpdesk Ticket Dashboard
This helpdesk ticket dashboard allows experts to view how they are performing when it comes to client tickets. It displays information like open tickets and closed tickets, response time, and the status of a ticket.
Terrorism Analysis Dashboard
This Tableau dashboard allows you to view the areas of the world where there are the highest terrorist attacks. You can also use line graphs to look at the patterns of attacks over the years. By analyzing using Tableau, you can make predictions to prevent future attacks.
Account Management Dashboard
For any company that has products to sell, it is helpful to know where every customer is. This dashboard allows sales managers and analysts to observe how the sales are going. When do you use it? You can use it to establish sales targets by observing who the salespeople are selling to, what they are selling, and where they are selling.
Credit Card Fraud Detection Dashboard
The issue of credit card fraud is more prominent since there are more users of credit cards. Through this project, you will be analyzing a data set of credit card transactions to look for any suspicious trends.
Global Dashboard to Identify Suicide Rate
This project compares suicide rates over a period of time and looks for trends. It uses data like the Human Development Index, Gross Domestic Product (GDP), and other information like age, gender, and region.
Government Budget Summary
This project examines how money is spent and received by the government. You can utilize various factors in a bid to further elaborate the project. The more data you input, the more detailed your analysis and graphs will be.

Concepts for Visualizing Time Series Data
One of the best methods of learning about new technology is through a time-series data visualization project. The project graphs data over time and shows how things evolve day by day or year by year.
How to obtain certification?
We are an Education Technology company providing certification training courses to accelerate careers of working professionals worldwide. We impart training through instructor-led classroom workshops, instructor-led live virtual training sessions, and self-paced e-learning courses.
We have successfully conducted training sessions in 108 countries across the globe and enabled thousands of working professionals to enhance the scope of their careers.
Our enterprise training portfolio includes in-demand and globally recognized certification training courses in Project Management, Quality Management, Business Analysis, IT Service Management, Agile and Scrum, Cyber Security, Data Science, and Emerging Technologies. Download our Enterprise Training Catalog from https://www.icertglobal.com/corporate-training-for-enterprises.php and https://www.icertglobal.com/index.php
Popular Courses include:
-
Project Management: PMP, CAPM ,PMI RMP
-
Quality Management: Six Sigma Black Belt ,Lean Six Sigma Green Belt, Lean Management, Minitab,CMMI
-
Business Analysis: CBAP, CCBA, ECBA
-
Agile Training: PMI-ACP , CSM , CSPO
-
Scrum Training: CSM
-
DevOps
-
Program Management: PgMP
-
Cloud Technology: Exin Cloud Computing
-
Citrix Client Adminisration: Citrix Cloud Administration
The 10 top-paying certifications to target in 2025 are:
Conclusion
This blog will take you through how to start creating projects using Tableau, what you can learn, and some sample projects. If you want to learn more visit web sites for more course . If you want to get certified in Tableau, click below to learn more about iCert Global's Data Visualization Using Tableau Training and Certification. You can also subscribe to us on YouTube for additional free tutorials. Make sure to check out the Resources page on this blog for additional useful links and information!.
Contact Us For More Information:
Visit : www.icertglobal.com Email : info@icertglobal.com
Read More
Tableau is a widely used computer program, which most organizations and IT departments utilize to visualize and report data. Tableau projects help you connect to different sources of data, examine the data, and generate comprehensible graphics in an effort to familiarize yourself with the data. Tableau projects are preferred by business analysts because they can share the data with others, who are in the company, and work with the result immediately. Through collaboration of data from different sources, they transform it into useful information, which helps individuals to make informed data-based decisions.
What are Tableau Projects?
Tableau projects show you how to utilize the tools to create data visual reports. The projects show you how to look at data and how to present it in a straightforward manner to your audience.
Having multiple Tableau projects will enable you to learn more, get better at your skills, and have your resume look great. This is whether you have done any Tableau certifications or learned by yourself.
Skill Development
Creating Tableau projects will help you learn a lot about managing and analyzing data. Finishing Tableau projects will give you the opportunity to practice five main skills. Learning Tableau will give you valuable skills that you can use in most careers.
1. Data Analysis: Tableau projects will need you to look at a lot of data. You will use different kinds of data and answer key questions that help businesses decide what to do.
2. Data Visualization: Tableau projects will assist you in becoming more proficient in presenting data in graphical forms.
3. Business Decisions: Business intelligence helps people understand data so they can make choices.
4. RDBMS: You will also study various database systems such as MySQL, Oracle, and Microsoft SQL Server.
5. Data Modelling: Data modeling facilitates easier organization and understanding of data. In Tableau, you will discover how data is modeled so that you can handle it better.
Tableau Projects to Practice
- As a new professional, it will assist you to understand how various tools of data visualization should be used and then improve the outcome depending on the client's requirements.
- Having several projects to show will help you learn more, develop your skills, and make your resume stand out, whether you’ve earned Tableau certifications or learned it on your own.
Patient Risk Health Dashboard
This Tableau project concept is from the medical sector. It makes you more effective at managing data through large datasets. In this project, you will gather and aggregate patient information from a hospital into Tableau. The objective is to identify and forecast any health hazards based on this information.
Stock Market Analysis Dashboard
This project contains much data that keep on fluctuating. The stock market creates a lot of data that can be analyzed. To depict how the stock market index is fluctuating along with its highest and lowest points, you can use various types of charts such as area and trend charts. Pie charts and bar charts can also be used to represent the number of stocks traded.
Covid-19 Analysis Dashboard
The pandemic of Covid-19 hit the entire world. With so many cases, it was hard for governments to realize how serious the situation was. But with the help of tools such as Tableau, analysts were able to utilize government data to present the actual picture around the globe.
Global Market Analysis
This project will show you what real companies are actually doing. If you succeed with this project, you will show that you are able to solve business problems by analyzing data and producing the best visualizations to illustrate your results.
Helpdesk Ticket Dashboard
This helpdesk ticket dashboard allows experts to view how they are performing when it comes to client tickets. It displays information like open tickets and closed tickets, response time, and the status of a ticket.
Terrorism Analysis Dashboard
This Tableau dashboard allows you to view the areas of the world where there are the highest terrorist attacks. You can also use line graphs to look at the patterns of attacks over the years. By analyzing using Tableau, you can make predictions to prevent future attacks.
Account Management Dashboard
For any company that has products to sell, it is helpful to know where every customer is. This dashboard allows sales managers and analysts to observe how the sales are going. When do you use it? You can use it to establish sales targets by observing who the salespeople are selling to, what they are selling, and where they are selling.
Credit Card Fraud Detection Dashboard
The issue of credit card fraud is more prominent since there are more users of credit cards. Through this project, you will be analyzing a data set of credit card transactions to look for any suspicious trends.
Global Dashboard to Identify Suicide Rate
This project compares suicide rates over a period of time and looks for trends. It uses data like the Human Development Index, Gross Domestic Product (GDP), and other information like age, gender, and region.
Government Budget Summary
This project examines how money is spent and received by the government. You can utilize various factors in a bid to further elaborate the project. The more data you input, the more detailed your analysis and graphs will be.
Concepts for Visualizing Time Series Data
One of the best methods of learning about new technology is through a time-series data visualization project. The project graphs data over time and shows how things evolve day by day or year by year.
How to obtain certification?
We are an Education Technology company providing certification training courses to accelerate careers of working professionals worldwide. We impart training through instructor-led classroom workshops, instructor-led live virtual training sessions, and self-paced e-learning courses.
We have successfully conducted training sessions in 108 countries across the globe and enabled thousands of working professionals to enhance the scope of their careers.
Our enterprise training portfolio includes in-demand and globally recognized certification training courses in Project Management, Quality Management, Business Analysis, IT Service Management, Agile and Scrum, Cyber Security, Data Science, and Emerging Technologies. Download our Enterprise Training Catalog from https://www.icertglobal.com/corporate-training-for-enterprises.php and https://www.icertglobal.com/index.php
Popular Courses include:
-
Project Management: PMP, CAPM ,PMI RMP
-
Quality Management: Six Sigma Black Belt ,Lean Six Sigma Green Belt, Lean Management, Minitab,CMMI
-
Business Analysis: CBAP, CCBA, ECBA
-
Agile Training: PMI-ACP , CSM , CSPO
-
Scrum Training: CSM
-
DevOps
-
Program Management: PgMP
-
Cloud Technology: Exin Cloud Computing
-
Citrix Client Adminisration: Citrix Cloud Administration
The 10 top-paying certifications to target in 2025 are:
Conclusion
This blog will take you through how to start creating projects using Tableau, what you can learn, and some sample projects. If you want to learn more visit web sites for more course . If you want to get certified in Tableau, click below to learn more about iCert Global's Data Visualization Using Tableau Training and Certification. You can also subscribe to us on YouTube for additional free tutorials. Make sure to check out the Resources page on this blog for additional useful links and information!.
Contact Us For More Information:
Visit : www.icertglobal.com Email : info@icertglobal.com
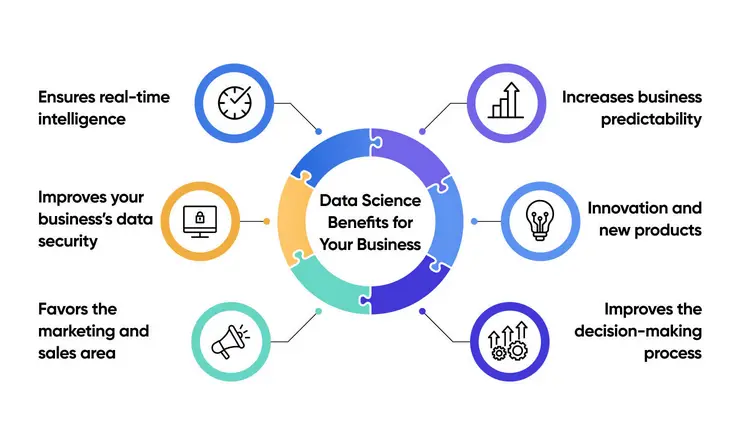
The Role of Data Science in Business
Without these talented individuals who are able to make new technology into useful concepts, Big Data isn't that significant. Now, most businesses are employing Big Data to make their work better. That's why data scientists, who are able to derive valuable information from lots of data, are so significant.
Today, companies are engulfed in data. For instance, a report indicated that Big Data initiatives in the U.S. healthcare system can save as much as $450 billion. However, if the data is inaccurate or not utilized effectively, it would end up costing the U.S. approximately $3.1 trillion every year.

It's clear that it's well worth working with and understanding data. That's where data scientists come in. Business leaders have heard that data science is a great profession and that data scientists are kind of heroes of our time, but many still have no idea how valuable they are. Let's look at how data science can help businesses. Achieve your objectives with our professional business courses.
In this article, we will explain how data scientists help businesses by:
Assisting leaders in making better-informed decisions.
Identifying patterns that shape future directions
Inspiring teams to adopt improved practices and heed significant concerns.
Finding new business opportunities
Decision-making based on facts and statistics.
Experimenting with ideas to determine what works
Discovering and cultivating the highest-value customer segments
Helping to choose the appropriate candidates for the position.
What Does a Data Scientist Do?
Most data scientists are skilled in math, statistics, and computer science. They can also display data in charts, recognize patterns in large datasets, and handle data properly. Many are skilled in cloud tools, data system design, and storing large data.
How Companies Benefit from Data Science
1. Spotting risks and stopping fraud:
Data scientists hunt for data that appears suspicious or doesn't add up. They use certain software to identify potential fraud early on and raise alerts so teams can move quickly.
2. Offering the appropriate products:
Data science assists businesses in knowing when and where their goods are selling most. This assists them in terms of offering the correct products at the correct moment and even coming up with new ones depending on what individuals need.
3. Designing improved customer experiences:
With information, companies can understand what their customers like. This enables their sales and marketing departments to craft promotions and ads that appear personalized and beneficial to every customer.
Why Data Science?
8 Ways a Data Scientist Benefits a Business :
1. Helping Leaders Make Better Decisions
A data scientist collaborates with senior management in a manner that they can view and use data. It assists leaders in decision-making in an informed way, based on facts and figures of the company.
2. Setting Goals with Trends
Data scientists look for trends in the company's information. Then they suggest what can be done in an effort to improve the company and to make customers more satisfied.
3. Helping Teams Use Smart Tools
Data scientists teach employees how to utilize tools that enable them to learn from data. This enables teams to focus on the largest challenges and discover improved ideas.
4. Discovering New Areas of Improvement
Data scientists would typically want to know how. They seek what they can accomplish better with information and create additional tools to access more valuable facts.
5. Choosing Wisely with Real Evidence
Data scientists assist companies to make informed decisions from facts, not assumptions. They create models from past data to experiment with various hypotheses. This enables the company to choose the best option with the least risk.
6. Experimenting with What Is Effective
Deciding is where it begins. A data scientist also verifies whether the decision was a good one. They analyze the key numbers (referred to as metrics) to understand how much a change benefited the company.
7. Finding the Right Customers
Companies generally collect customer data through means such as Google Analytics and questionnaires. Having the data is one thing, however. A data scientist aggregates all this data so that they get a better sense of the audience. This assists companies to be able to sell the right product to the right people—and to earn more money.

8. Hiring the Right People
It is time-consuming to browse through resumes. Data scientists make it easy. They leverage social media data, job boards, and company records to identify the most suitable candidate for the position. It saves time and enables companies to hire faster and better.
How to obtain Data Science certification?
We are an Education Technology company providing certification training courses to accelerate careers of working professionals worldwide. We impart training through instructor-led classroom workshops, instructor-led live virtual training sessions, and self-paced e-learning courses.
We have successfully conducted training sessions in 108 countries across the globe and enabled thousands of working professionals to enhance the scope of their careers.
Our enterprise training portfolio includes in-demand and globally recognized certification training courses in Project Management, Quality Management, Business Analysis, IT Service Management, Agile and Scrum, Cyber Security, Data Science, and Emerging Technologies. Download our Enterprise Training Catalog from https://www.icertglobal.com/corporate-training-for-enterprises.php and https://www.icertglobal.com/index.php
Popular Courses include:
-
Project Management: PMP, CAPM ,PMI RMP
-
Quality Management: Six Sigma Black Belt ,Lean Six Sigma Green Belt, Lean Management, Minitab,CMMI
-
Business Analysis: CBAP, CCBA, ECBA
-
Agile Training: PMI-ACP , CSM , CSPO
-
Scrum Training: CSM
-
DevOps
-
Program Management: PgMP
-
Cloud Technology: Exin Cloud Computing
-
Citrix Client Adminisration: Citrix Cloud Administration
The 10 top-paying certifications to target in 2025 are:
Conclusion:
It's not only about numbers; data science enables us to make better decisions, delight customers, and build stronger teams. Data scientists enable leaders to make better decisions and hire the right people for a job, and that is a big effect on everything in a business.
If businesses harness their data well, they can innovate quicker, operate more efficiently, and remain ahead. Data today is not only beneficial—it is powerful.
Want to become part of this fascinating world? Start your journey with our Caltech Data Science Program and acquire the skills to become a data master. The future is full of data—get ready for it!
Contact Us For More Information:
Visit : www.icertglobal.com Email : info@icertglobal.com
Read More
Without these talented individuals who are able to make new technology into useful concepts, Big Data isn't that significant. Now, most businesses are employing Big Data to make their work better. That's why data scientists, who are able to derive valuable information from lots of data, are so significant.
Today, companies are engulfed in data. For instance, a report indicated that Big Data initiatives in the U.S. healthcare system can save as much as $450 billion. However, if the data is inaccurate or not utilized effectively, it would end up costing the U.S. approximately $3.1 trillion every year.
It's clear that it's well worth working with and understanding data. That's where data scientists come in. Business leaders have heard that data science is a great profession and that data scientists are kind of heroes of our time, but many still have no idea how valuable they are. Let's look at how data science can help businesses. Achieve your objectives with our professional business courses.
In this article, we will explain how data scientists help businesses by:
Assisting leaders in making better-informed decisions.
Identifying patterns that shape future directions
Inspiring teams to adopt improved practices and heed significant concerns.
Finding new business opportunities
Decision-making based on facts and statistics.
Experimenting with ideas to determine what works
Discovering and cultivating the highest-value customer segments
Helping to choose the appropriate candidates for the position.
What Does a Data Scientist Do?
Most data scientists are skilled in math, statistics, and computer science. They can also display data in charts, recognize patterns in large datasets, and handle data properly. Many are skilled in cloud tools, data system design, and storing large data.
How Companies Benefit from Data Science
1. Spotting risks and stopping fraud:
Data scientists hunt for data that appears suspicious or doesn't add up. They use certain software to identify potential fraud early on and raise alerts so teams can move quickly.
2. Offering the appropriate products:
Data science assists businesses in knowing when and where their goods are selling most. This assists them in terms of offering the correct products at the correct moment and even coming up with new ones depending on what individuals need.
3. Designing improved customer experiences:
With information, companies can understand what their customers like. This enables their sales and marketing departments to craft promotions and ads that appear personalized and beneficial to every customer.
Why Data Science?
8 Ways a Data Scientist Benefits a Business :
1. Helping Leaders Make Better Decisions
A data scientist collaborates with senior management in a manner that they can view and use data. It assists leaders in decision-making in an informed way, based on facts and figures of the company.
2. Setting Goals with Trends
Data scientists look for trends in the company's information. Then they suggest what can be done in an effort to improve the company and to make customers more satisfied.
3. Helping Teams Use Smart Tools
Data scientists teach employees how to utilize tools that enable them to learn from data. This enables teams to focus on the largest challenges and discover improved ideas.
4. Discovering New Areas of Improvement
Data scientists would typically want to know how. They seek what they can accomplish better with information and create additional tools to access more valuable facts.
5. Choosing Wisely with Real Evidence
Data scientists assist companies to make informed decisions from facts, not assumptions. They create models from past data to experiment with various hypotheses. This enables the company to choose the best option with the least risk.
6. Experimenting with What Is Effective
Deciding is where it begins. A data scientist also verifies whether the decision was a good one. They analyze the key numbers (referred to as metrics) to understand how much a change benefited the company.
7. Finding the Right Customers
Companies generally collect customer data through means such as Google Analytics and questionnaires. Having the data is one thing, however. A data scientist aggregates all this data so that they get a better sense of the audience. This assists companies to be able to sell the right product to the right people—and to earn more money.
8. Hiring the Right People
It is time-consuming to browse through resumes. Data scientists make it easy. They leverage social media data, job boards, and company records to identify the most suitable candidate for the position. It saves time and enables companies to hire faster and better.
How to obtain Data Science certification?
We are an Education Technology company providing certification training courses to accelerate careers of working professionals worldwide. We impart training through instructor-led classroom workshops, instructor-led live virtual training sessions, and self-paced e-learning courses.
We have successfully conducted training sessions in 108 countries across the globe and enabled thousands of working professionals to enhance the scope of their careers.
Our enterprise training portfolio includes in-demand and globally recognized certification training courses in Project Management, Quality Management, Business Analysis, IT Service Management, Agile and Scrum, Cyber Security, Data Science, and Emerging Technologies. Download our Enterprise Training Catalog from https://www.icertglobal.com/corporate-training-for-enterprises.php and https://www.icertglobal.com/index.php
Popular Courses include:
-
Project Management: PMP, CAPM ,PMI RMP
-
Quality Management: Six Sigma Black Belt ,Lean Six Sigma Green Belt, Lean Management, Minitab,CMMI
-
Business Analysis: CBAP, CCBA, ECBA
-
Agile Training: PMI-ACP , CSM , CSPO
-
Scrum Training: CSM
-
DevOps
-
Program Management: PgMP
-
Cloud Technology: Exin Cloud Computing
-
Citrix Client Adminisration: Citrix Cloud Administration
The 10 top-paying certifications to target in 2025 are:
Conclusion:
It's not only about numbers; data science enables us to make better decisions, delight customers, and build stronger teams. Data scientists enable leaders to make better decisions and hire the right people for a job, and that is a big effect on everything in a business.
If businesses harness their data well, they can innovate quicker, operate more efficiently, and remain ahead. Data today is not only beneficial—it is powerful.
Want to become part of this fascinating world? Start your journey with our Caltech Data Science Program and acquire the skills to become a data master. The future is full of data—get ready for it!
Contact Us For More Information:
Visit : www.icertglobal.com Email : info@icertglobal.com

The Key Steps in Data Science Modeling
Data science modeling is the process of applying data to illustrate how things occur in the real world. Here, computer programs known as algorithms manipulate the
data to identify patterns, predict, or learn something new. Data scientists utilize the models to give insightful answers and make evidence-based decisions based on the data.

Grasping Data Science Modeling
Data science modeling is applying data to enable computers to learn and solve real-world issues. It involves such phases as selecting an appropriate method (termed an algorithm), tweaking it on historic data, proving it on novel data, and tweaking it for improved performance.
There are numerous kinds of models, such as:
- Regression
- Sorting
- Clustering
- Deep learning
Your model selection is based on the type of problem and what you are trying to do.
Types of Data Models
There are three primary types of data models employed in data science:
1. Relational Model
- Saves information in tables composed of rows and columns.
- Simple to use and comprehend.
- Widely used in databases
2. Hierarchical Model
- Shows information in tree structure (e.g., family trees)
- Ideal for one-to-many relationships
- It is harder to look through if it is deep.
3. Network Model
- Comparable to hierarchical model but permits greater connections
- Can handle more complex relationships.
- More challenging to control and understand

Each model is good and bad in its own ways. Choosing the best model is up to your data and what your project demands.
9 Steps of Data Science Modeling
Here are the 9 simple steps:
1. Read the problem you need to solve.
2. Gather accurate data
3. Edit the data to make it correct.
4. Analyze the data to comprehend it further.
5. Choose the best model for your data
6. Train the model on your data.
7. Test the model to find out how good it is.
8. Enhance the model to make it more accurate
9. Make a prediction or decision using the model.
If you want to learn more, a course in Data Science with Python can help you understand these steps in depth and implement them with real projects.
Levels of Data Abstraction
Data abstraction in data science is the act of looking at the key aspects of the data without revealing the intricate inner mechanisms of things.
There are three levels of data abstraction:
1. Physical Level
This is the lowest level. It describes how data is stored in memory, for example, by means of computer data structures, bits, and bytes.
2. Logical Level
This stage is further with the organization of the data rather than where it is stored. It organizes data into rows, columns, and tables in a form that makes it easier to understand and use.
3. View Level
This is the most advanced level. It provides various users with various means of viewing the same information, depending on what they require. This makes individuals utilize the information more conveniently and make improved decisions.
Types of Data Models
Some typical instances of data models employed in data science are:
• Entity-Relationship (ER) Model: It illustrates how different things (named as entities) are connected within a database.
• Relational Model: Places data in tables constructed of rows and columns.
• Hierarchical Model: Shows data in tree form, useful if one item is connected to many others.
• Network Model: Less organized than the tree model; can handle more sophisticated relationships among data.

All models assist in structuring and comprehending data better.
Principal Modeling Techniques in Data Science
A few important modeling techniques applied in data science are:
1. Linear Regression
It is used to predict an outcome given input data. It fits a line that best represents the data and displays the variables' relationship.
2. Decision Trees
A tree-like structure that assists in decision-making. Every "branch" is a decision, and the "leaves" are results. It is simple to comprehend and utilize for classification and prediction.
3. Logistische Regression
Even though it is referred to as "regression," it is used for classification—like putting things into "yes or no" bins.
4. Clustering
This groups similar items of information together. It is useful for finding patterns in the data and for looking at data when you do not know the answers in advance.
5. Random Forest
It is a collection of numerous decision trees. It gives more and improved predictions through their output in combination. It can be used for prediction and classification issues.
These modeling techniques enable data scientists to observe patterns, predict, and inform more informed decisions in health, business, and technology.
How to Improve Data Science Modeling
To enhance your data science models, use the following tips:
1. Know Your Data First
Before you build a model, you must have a good idea of your data. That means cleaning the data, choosing the appropriate features (important elements), and preparing it.
2. Pick the Right Algorithm
Choose the model or approach that best fits your data and what you want to accomplish. Some are most appropriate for particular issues. Try others to see which provides the most optimal solution.
3. Tune the Model Settings
Each algorithm has parameters you can adjust to get it to perform better. Experimenting and adjusting those parameters can get your model to perform better.
4. Test and Validate Your Model
Use techniques such as cross-validation to try your model on several data sets. This informs you how it works in true-life scenarios and allows you to recognize how you can improve it.
Where Data Science Is Applied (Applications) ?
Data science finds application in numerous fields, including:
• Finance: for smart trading, risk management, and fraud detection
• Healthcare: to watch over patients, guess illnesses, and provide the correct medicine
• Marketing: to recommend products, manage customers, and show appropriate ads
Want to know more?
You can always study Data Science to learn more about these fields in depth.
Shortcomings of Data Modeling
Data modeling is useful, but it is not without some limitations:
• Not Always True: Certain models rely on straightforward relationships that don't always occur in the real world.
• Overfitting: A model may do well on training data but not on new data.
• It Takes Time and Power: Developing models from big data is time-consuming and needs a lot of computer power.
How Data Modeling Has Changed Over Time ?
As data science gained popularity, data modeling also gained traction. Individuals have found new ways to build improved models by:
- Using improved math methods
- Enhanced algorithms
- Knowing more about the sectors they're working in (like healthcare, business, etc.)
Data modeling can only improve with time and more knowledge, no matter the restraints.
Data Modeling Tools
Choosing the right data modeling tool is critical. Some of the most commonly used are:
• ER/Studio: It assists you in designing, describing, and communicating data models within a full framework.
• PowerDesigner: Simple to use and suitable for large projects such as company planning and data design.
• Draw.io and Lucidchart: They are easy to use and perfect for collaboration. Users prefer to use them a lot because they are simple.

Each tool has its pros and cons. As you begin a Data Science course, it is a good idea to know which one is ideal for your project.
How to obtain Data Science certification?
We are an Education Technology company providing certification training courses to accelerate careers of working professionals worldwide. We impart training through instructor-led classroom workshops, instructor-led live virtual training sessions, and self-paced e-learning courses.
We have successfully conducted training sessions in 108 countries across the globe and enabled thousands of working professionals to enhance the scope of their careers.
Our enterprise training portfolio includes in-demand and globally recognized certification training courses in Project Management, Quality Management, Business Analysis, IT Service Management, Agile and Scrum, Cyber Security, Data Science, and Emerging Technologies. Download our Enterprise Training Catalog from https://www.icertglobal.com/corporate-training-for-enterprises.php and https://www.icertglobal.com/index.php
Popular Courses include:
-
Project Management: PMP, CAPM ,PMI RMP
-
Quality Management: Six Sigma Black Belt ,Lean Six Sigma Green Belt, Lean Management, Minitab,CMMI
-
Business Analysis: CBAP, CCBA, ECBA
-
Agile Training: PMI-ACP , CSM , CSPO
-
Scrum Training: CSM
-
DevOps
-
Program Management: PgMP
-
Cloud Technology: Exin Cloud Computing
-
Citrix Client Adminisration: Citrix Cloud Administration
The 10 top-paying certifications to target in 2024 are:
Conclusion
Data modeling is a significant aspect of data science that enables us to convert raw data into intelligent and meaningful insights. Through processes such as data collection, data cleansing, and model creation, we are able to tackle real-world issues in healthcare, business, and other areas.
With such powerful tools as AWS SageMaker, data modeling is faster and easier. If you would like to learn these and have a brighter future ahead, iCert Global has the appropriate courses to assist you to start.
Get started with iCert Global and discover the strength of data!
Frequently Asked Questions (FAQs)
Do I need to be mathematically and coding acutely skilled to begin data science modeling?
Not at all. You don't need to be an expert, but having some programming and math knowledge will help a long way.
Which tools or languages are utilized for data science modeling?
People typically use tools like Python and TensorFlow. They help create and train models.
How much information do I need to begin creating a model?
It depends on your project, but you must have sufficient data so that your model would learn and provide good results.
How does data modeling work?
The process of data modeling contains some significant steps:
1. Collecting Data – Obtain the data you require.
2. Data Cleaning – Correct any inconsistencies or missing values
3. Exploratory Data Analysis – Look at the data to observe patterns.
4. Building and Testing the Model – Make your model and check it.
5. Deployment – Use the model in real life to make a prediction or decision
How does AWS assist with data modeling?
AWS (Amazon Web Services) provides methods that assist in simplifying and enhancing data modeling. Some of the popular ones are Amazon SageMaker.
SageMaker helps you:
• Make models quicker
• Easy to model and train
• Use the model on a large scale (even for large corporations)
It's like having a fantastic computer lab on the Internet to assist you with your data science tasks!
Contact Us For More Information:
Visit : www.icertglobal.com Email : info@icertglobal.com
Read More
Data science modeling is the process of applying data to illustrate how things occur in the real world. Here, computer programs known as algorithms manipulate the
data to identify patterns, predict, or learn something new. Data scientists utilize the models to give insightful answers and make evidence-based decisions based on the data.
Grasping Data Science Modeling
Data science modeling is applying data to enable computers to learn and solve real-world issues. It involves such phases as selecting an appropriate method (termed an algorithm), tweaking it on historic data, proving it on novel data, and tweaking it for improved performance.
There are numerous kinds of models, such as:
- Regression
- Sorting
- Clustering
- Deep learning
Your model selection is based on the type of problem and what you are trying to do.
Types of Data Models
There are three primary types of data models employed in data science:
1. Relational Model
- Saves information in tables composed of rows and columns.
- Simple to use and comprehend.
- Widely used in databases
2. Hierarchical Model
- Shows information in tree structure (e.g., family trees)
- Ideal for one-to-many relationships
- It is harder to look through if it is deep.
3. Network Model
- Comparable to hierarchical model but permits greater connections
- Can handle more complex relationships.
- More challenging to control and understand
Each model is good and bad in its own ways. Choosing the best model is up to your data and what your project demands.
9 Steps of Data Science Modeling
Here are the 9 simple steps:
1. Read the problem you need to solve.
2. Gather accurate data
3. Edit the data to make it correct.
4. Analyze the data to comprehend it further.
5. Choose the best model for your data
6. Train the model on your data.
7. Test the model to find out how good it is.
8. Enhance the model to make it more accurate
9. Make a prediction or decision using the model.
If you want to learn more, a course in Data Science with Python can help you understand these steps in depth and implement them with real projects.
Levels of Data Abstraction
Data abstraction in data science is the act of looking at the key aspects of the data without revealing the intricate inner mechanisms of things.
There are three levels of data abstraction:
1. Physical Level
This is the lowest level. It describes how data is stored in memory, for example, by means of computer data structures, bits, and bytes.
2. Logical Level
This stage is further with the organization of the data rather than where it is stored. It organizes data into rows, columns, and tables in a form that makes it easier to understand and use.
3. View Level
This is the most advanced level. It provides various users with various means of viewing the same information, depending on what they require. This makes individuals utilize the information more conveniently and make improved decisions.
Types of Data Models
Some typical instances of data models employed in data science are:
• Entity-Relationship (ER) Model: It illustrates how different things (named as entities) are connected within a database.
• Relational Model: Places data in tables constructed of rows and columns.
• Hierarchical Model: Shows data in tree form, useful if one item is connected to many others.
• Network Model: Less organized than the tree model; can handle more sophisticated relationships among data.
All models assist in structuring and comprehending data better.
Principal Modeling Techniques in Data Science
A few important modeling techniques applied in data science are:
1. Linear Regression
It is used to predict an outcome given input data. It fits a line that best represents the data and displays the variables' relationship.
2. Decision Trees
A tree-like structure that assists in decision-making. Every "branch" is a decision, and the "leaves" are results. It is simple to comprehend and utilize for classification and prediction.
3. Logistische Regression
Even though it is referred to as "regression," it is used for classification—like putting things into "yes or no" bins.
4. Clustering
This groups similar items of information together. It is useful for finding patterns in the data and for looking at data when you do not know the answers in advance.
5. Random Forest
It is a collection of numerous decision trees. It gives more and improved predictions through their output in combination. It can be used for prediction and classification issues.
These modeling techniques enable data scientists to observe patterns, predict, and inform more informed decisions in health, business, and technology.
How to Improve Data Science Modeling
To enhance your data science models, use the following tips:
1. Know Your Data First
Before you build a model, you must have a good idea of your data. That means cleaning the data, choosing the appropriate features (important elements), and preparing it.
2. Pick the Right Algorithm
Choose the model or approach that best fits your data and what you want to accomplish. Some are most appropriate for particular issues. Try others to see which provides the most optimal solution.
3. Tune the Model Settings
Each algorithm has parameters you can adjust to get it to perform better. Experimenting and adjusting those parameters can get your model to perform better.
4. Test and Validate Your Model
Use techniques such as cross-validation to try your model on several data sets. This informs you how it works in true-life scenarios and allows you to recognize how you can improve it.
Where Data Science Is Applied (Applications) ?
Data science finds application in numerous fields, including:
• Finance: for smart trading, risk management, and fraud detection
• Healthcare: to watch over patients, guess illnesses, and provide the correct medicine
• Marketing: to recommend products, manage customers, and show appropriate ads
Want to know more?
You can always study Data Science to learn more about these fields in depth.
Shortcomings of Data Modeling
Data modeling is useful, but it is not without some limitations:
• Not Always True: Certain models rely on straightforward relationships that don't always occur in the real world.
• Overfitting: A model may do well on training data but not on new data.
• It Takes Time and Power: Developing models from big data is time-consuming and needs a lot of computer power.
How Data Modeling Has Changed Over Time ?
As data science gained popularity, data modeling also gained traction. Individuals have found new ways to build improved models by:
- Using improved math methods
- Enhanced algorithms
- Knowing more about the sectors they're working in (like healthcare, business, etc.)
Data modeling can only improve with time and more knowledge, no matter the restraints.
Data Modeling Tools
Choosing the right data modeling tool is critical. Some of the most commonly used are:
• ER/Studio: It assists you in designing, describing, and communicating data models within a full framework.
• PowerDesigner: Simple to use and suitable for large projects such as company planning and data design.
• Draw.io and Lucidchart: They are easy to use and perfect for collaboration. Users prefer to use them a lot because they are simple.
Each tool has its pros and cons. As you begin a Data Science course, it is a good idea to know which one is ideal for your project.
How to obtain Data Science certification?
We are an Education Technology company providing certification training courses to accelerate careers of working professionals worldwide. We impart training through instructor-led classroom workshops, instructor-led live virtual training sessions, and self-paced e-learning courses.
We have successfully conducted training sessions in 108 countries across the globe and enabled thousands of working professionals to enhance the scope of their careers.
Our enterprise training portfolio includes in-demand and globally recognized certification training courses in Project Management, Quality Management, Business Analysis, IT Service Management, Agile and Scrum, Cyber Security, Data Science, and Emerging Technologies. Download our Enterprise Training Catalog from https://www.icertglobal.com/corporate-training-for-enterprises.php and https://www.icertglobal.com/index.php
Popular Courses include:
-
Project Management: PMP, CAPM ,PMI RMP
-
Quality Management: Six Sigma Black Belt ,Lean Six Sigma Green Belt, Lean Management, Minitab,CMMI
-
Business Analysis: CBAP, CCBA, ECBA
-
Agile Training: PMI-ACP , CSM , CSPO
-
Scrum Training: CSM
-
DevOps
-
Program Management: PgMP
-
Cloud Technology: Exin Cloud Computing
-
Citrix Client Adminisration: Citrix Cloud Administration
The 10 top-paying certifications to target in 2024 are:
Conclusion
Data modeling is a significant aspect of data science that enables us to convert raw data into intelligent and meaningful insights. Through processes such as data collection, data cleansing, and model creation, we are able to tackle real-world issues in healthcare, business, and other areas.
With such powerful tools as AWS SageMaker, data modeling is faster and easier. If you would like to learn these and have a brighter future ahead, iCert Global has the appropriate courses to assist you to start.
Get started with iCert Global and discover the strength of data!
Frequently Asked Questions (FAQs)
Do I need to be mathematically and coding acutely skilled to begin data science modeling?
Not at all. You don't need to be an expert, but having some programming and math knowledge will help a long way.
Which tools or languages are utilized for data science modeling?
People typically use tools like Python and TensorFlow. They help create and train models.
How much information do I need to begin creating a model?
It depends on your project, but you must have sufficient data so that your model would learn and provide good results.
How does data modeling work?
The process of data modeling contains some significant steps:
1. Collecting Data – Obtain the data you require.
2. Data Cleaning – Correct any inconsistencies or missing values
3. Exploratory Data Analysis – Look at the data to observe patterns.
4. Building and Testing the Model – Make your model and check it.
5. Deployment – Use the model in real life to make a prediction or decision
How does AWS assist with data modeling?
AWS (Amazon Web Services) provides methods that assist in simplifying and enhancing data modeling. Some of the popular ones are Amazon SageMaker.
SageMaker helps you:
• Make models quicker
• Easy to model and train
• Use the model on a large scale (even for large corporations)
It's like having a fantastic computer lab on the Internet to assist you with your data science tasks!
Contact Us For More Information:
Visit : www.icertglobal.com Email : info@icertglobal.com

Start Your Power BI Journey with These Projects
Power BI is a convenient utility that helps you take boring numbers and turn them into interesting charts and easy-to-read pictures. But to be able to master it, you must do more than just read about it — you must practice!
Power BI projects are useful. By doing real-life examples, you will learn how to present data effectively and build a portfolio that will impress teachers or your future employers.
Best Power BI Projects to Attempt
We broke down the project ideas into two levels: Basic and Advanced.
The basic projects are ideal for novices who are just beginning.

The advanced projects are for individuals who would like to learn more and perform more complex work with data.
Learn Power BI with Real Projects
Power BI is a robust instrument that assists in transforming perplexing numbers into easily comprehensible, colorful charts, and graphs. It assists individuals in discovering patterns and making reasonable decisions based on data.
In order to really learn Power BI, you must do more than read. You must apply yourself to doing work on real projects. This is the most effective way to improve your skills.
Top Power BI Projects for Beginner and Intermediate Students
We have two categories of projects. Basic projects are for beginners. Advanced projects are for those who want to learn more and explore deeper.
Sales Performance Dashboard
The objective of this project is to illustrate how well a company is doing in sales.
For this assignment, you will generate graphs that show sales by region, product, and salesperson. You will have drop-downs so that the users can choose different dates, locations, or products to look at.
1. Customer Behavior Analysis
The aim of this project is to determine what customers like and how they purchase products.
You will analyze what individuals buy and when they buy it. You will then create charts displaying these buying patterns and how often individuals return.
Key Features
You will present information regarding the customers' age, gender, and location. You will also observe what they purchase, how frequently they purchase, and categorize them based on how they shop and how much they spend.
Strengths
This enables companies to understand their customers better. They can produce improved advertisements and promotions that align with what customers need. This can fulfill customers and cause them to return more.
3. Supply Chain Management
The aim of this project is to monitor how products travel from suppliers to customers.
Here in this project, you will create dashboards that display how suppliers are performing, how much inventory is remaining, how long the deliveries are taking, and how much everything will be costing. You can even use data to predict what future inventory will be needed or detect problems before they occur.
4. Money Health Dashboard
The purpose of this project is to demonstrate how a company is handling its finances. This is highly significant for small and medium-sized businesses.
You will create graphs that show income, spending, savings, and profits. You can help the business plan its spending and forecast what might be done with money in the future.
5. Human Resources Analytics
You will make dashboards that show how well the company is doing with hiring, keeping workers, and how happy and helpful employees are. You can also use data to guess how many people the company might need to hire in the future.
6. Healthcare Patient Monitoring
This project assists physicians and nurses in giving patients improved care.
You will verify patient results, treatment plans, the number of beds occupied, and the amount of medical equipment available. You can also review patient feedback and recovery times.
7. Real estate market trends.
This project educates individuals on the real estate market to enable them to make informed choices.
You can see house prices, what people pay as rent, how many houses are for sale, and what the economy is like. You can also display maps which indicate where the best places are to purchase or construct homes.
8. Environmental Impact Analysis
This project explores how a business affects the planet.
You will create dashboards that illustrate the amount of water, energy, and material used. You will also investigate aspects such as recycling and waste. You can also establish how much pollution is caused and whether the company is obeying green laws.
9. Enhancing Retail Stock and Sales
The project assists the stores in knowing how much inventory to maintain.
You will observe how things are selling at different times, seasons, and promotions. You can utilize this in order to make an estimation on how much of every product the store needs.
It prevents stores from having too little or too much of anything. It is a cost-effective and customer-friendly approach because customers' desired products are always available.
10. Educational Performance and Use of Resources
This project helps schools to improve by making use of information.

You will observe how students are doing in school. You can observe how teachers, buildings, and computers are utilized. You will examine how good school programs are.
11. Airport Authority Data Study
This project makes airports function more efficiently.
You will track data about flight delays, flight cancellations, the duration of operations on the ground, and what passengers think. This information helps airport workers make sound decisions, especially in case of issues like delays or emergencies.
Main Features
1. Most Popular Movies and Shows: You can use bar graphs to display what kinds of shows or movies are watched the most.
2. Long-term subscriptions: Display the timeline of the number of individuals subscribing over time. Use cards to display key stats such as total viewers, most-watched hits, and the rate at which the platform is growing.
Advantages
• Know the Audience: This dashboard tells you about what type of shows people like most and where they watch them.
• Increase Subscriptions: By observing how subscriptions fluctuate, you can determine how to get more individuals to subscribe or retain them for a longer duration.
• More Viewers: By examining important numbers, sites are able to discover more about retaining viewers.
How Power BI Has Evolved Over Time
Earlier, Business Intelligence (BI) tools used to just collect various types of data and give individuals reports. But as time passed, these tools became very intelligent. Now, they are using Artificial Intelligence (AI) and Machine Learning to accomplish more.
What Comes Next after You Upload a Dataset ?
Once you upload your data file, a window named Query Editor will open. It is a tool that assists you in correcting or editing your data prior to your use of it in Power BI. You are able to choose what rows or columns you need, alter the data type, and have it all set to make charts and reports.
Power BI Views
There are three major views in Power BI. You may toggle between them using the buttons on the side. Each one assists you in something different:
1. Report View – This is where you build your dashboards and charts.
2. Data View – This will display the data in table view so that you can verify and edit it.
3. Model View – This explains how your tables are connected to one another.
View Report
The Report View is where you construct your reports and charts. Here, you can insert pages, rearrange the items, and construct your own with various charts. This is the central area to construct and organize your report as you desire.
Data View
The Data View enables you to view your data once it has been loaded into Power BI. You can view it in a table format, much like Excel. This enables you to quickly comprehend how your data looks and check to ensure everything is in order.
Model View (Relationship View)
The Model View shows you how all of your tables relate to each other. If your data comes from multiple sources, you can use this view to get a sense of how everything relates. It makes it easier to visualize large or complex data.
Power BI has many useful tools and features:
• Modeling Ribbon: This is a ribbon where you can accomplish a lot like add data, change data types, calculate with your data, and add charts.
• Fields List: This shows you all the information you've input. You can click on different sections, like tables or columns, to see the information.
• Navigation Pane: It assists you to toggle between various views in Power BI, such as report view, data view, and model view.
• Visualization Pane: This provides you with more than 30 chart and visualization types to assist you in presenting your data in a fun and creative manner. If you wish, you can also browse the web for other chart types.

How to obtain Power BI certification?
We are an Education Technology company providing certification training courses to accelerate careers of working professionals worldwide. We impart training through instructor-led classroom workshops, instructor-led live virtual training sessions, and self-paced e-learning courses.
We have successfully conducted training sessions in 108 countries across the globe and enabled thousands of working professionals to enhance the scope of their careers.
Our enterprise training portfolio includes in-demand and globally recognized certification training courses in Project Management, Quality Management, Business Analysis, IT Service Management, Agile and Scrum, Cyber Security, Data Science, and Emerging Technologies. Download our Enterprise Training Catalog from https://www.icertglobal.com/corporate-training-for-enterprises.php and https://www.icertglobal.com/index.php
Popular Courses include:
-
Project Management: PMP, CAPM ,PMI RMP
-
Quality Management: Six Sigma Black Belt ,Lean Six Sigma Green Belt, Lean Management, Minitab,CMMI
-
Business Analysis: CBAP, CCBA, ECBA
-
Agile Training: PMI-ACP , CSM , CSPO
-
Scrum Training: CSM
-
DevOps
-
Program Management: PgMP
-
Cloud Technology: Exin Cloud Computing
-
Citrix Client Adminisration: Citrix Cloud Administration
The 10 top-paying certifications to target in 2024 are:
Conclusion
If you wish to begin a career in Business Intelligence or Power BI, iCert Global's Power BI Certification Program is the best place to begin. By studying through this course, you learn to manage data, make charts, and identify useful insights in order to empower businesses to take well-informed decisions. With this program, you can establish your expertise and become a professional in data analytics.
Want to learn more? See iCert Global's best Data Analytics Courses and Certifications!
FAQs
1. What are Power BI used by businesses for?
Power BI is a business application that enables companies to make sound decisions through converting data into simple-to-understand reports and charts.
2. How do the other Microsoft tools integrate with Power BI?
Power BI is integrated with other Microsoft applications. When you open a Power BI file, it loads your data so that you can build reports and dashboards using powerful tools that execute in the background.
3. Does Power BI support big data?
Yes! Power BI, with a premium license, can hold plenty of data—up to 100 TB—and handle large files too.
4. What are the most frequent Power BI project problems?
Some of the issues are a cluttered user interface, slow performance, data-sharing limitations, and dealing with complex configurations.
5. How do I stay current with Power BI news and features?
You may follow Power BI on LinkedIn or Twitter to see the latest updates, new features, and useful tips.
Contact Us For More Information:
Visit : www.icertglobal.com Email : info@icertglobal.com
Read More
Power BI is a convenient utility that helps you take boring numbers and turn them into interesting charts and easy-to-read pictures. But to be able to master it, you must do more than just read about it — you must practice!
Power BI projects are useful. By doing real-life examples, you will learn how to present data effectively and build a portfolio that will impress teachers or your future employers.
Best Power BI Projects to Attempt
We broke down the project ideas into two levels: Basic and Advanced.
The basic projects are ideal for novices who are just beginning.
The advanced projects are for individuals who would like to learn more and perform more complex work with data.
Learn Power BI with Real Projects
Power BI is a robust instrument that assists in transforming perplexing numbers into easily comprehensible, colorful charts, and graphs. It assists individuals in discovering patterns and making reasonable decisions based on data.
In order to really learn Power BI, you must do more than read. You must apply yourself to doing work on real projects. This is the most effective way to improve your skills.
Top Power BI Projects for Beginner and Intermediate Students
We have two categories of projects. Basic projects are for beginners. Advanced projects are for those who want to learn more and explore deeper.
Sales Performance Dashboard
The objective of this project is to illustrate how well a company is doing in sales.
For this assignment, you will generate graphs that show sales by region, product, and salesperson. You will have drop-downs so that the users can choose different dates, locations, or products to look at.
1. Customer Behavior Analysis
The aim of this project is to determine what customers like and how they purchase products.
You will analyze what individuals buy and when they buy it. You will then create charts displaying these buying patterns and how often individuals return.
Key Features
You will present information regarding the customers' age, gender, and location. You will also observe what they purchase, how frequently they purchase, and categorize them based on how they shop and how much they spend.
Strengths
This enables companies to understand their customers better. They can produce improved advertisements and promotions that align with what customers need. This can fulfill customers and cause them to return more.
3. Supply Chain Management
The aim of this project is to monitor how products travel from suppliers to customers.
Here in this project, you will create dashboards that display how suppliers are performing, how much inventory is remaining, how long the deliveries are taking, and how much everything will be costing. You can even use data to predict what future inventory will be needed or detect problems before they occur.
4. Money Health Dashboard
The purpose of this project is to demonstrate how a company is handling its finances. This is highly significant for small and medium-sized businesses.
You will create graphs that show income, spending, savings, and profits. You can help the business plan its spending and forecast what might be done with money in the future.
5. Human Resources Analytics
You will make dashboards that show how well the company is doing with hiring, keeping workers, and how happy and helpful employees are. You can also use data to guess how many people the company might need to hire in the future.
6. Healthcare Patient Monitoring
This project assists physicians and nurses in giving patients improved care.
You will verify patient results, treatment plans, the number of beds occupied, and the amount of medical equipment available. You can also review patient feedback and recovery times.
7. Real estate market trends.
This project educates individuals on the real estate market to enable them to make informed choices.
You can see house prices, what people pay as rent, how many houses are for sale, and what the economy is like. You can also display maps which indicate where the best places are to purchase or construct homes.
8. Environmental Impact Analysis
This project explores how a business affects the planet.
You will create dashboards that illustrate the amount of water, energy, and material used. You will also investigate aspects such as recycling and waste. You can also establish how much pollution is caused and whether the company is obeying green laws.
9. Enhancing Retail Stock and Sales
The project assists the stores in knowing how much inventory to maintain.
You will observe how things are selling at different times, seasons, and promotions. You can utilize this in order to make an estimation on how much of every product the store needs.
It prevents stores from having too little or too much of anything. It is a cost-effective and customer-friendly approach because customers' desired products are always available.
10. Educational Performance and Use of Resources
This project helps schools to improve by making use of information.
You will observe how students are doing in school. You can observe how teachers, buildings, and computers are utilized. You will examine how good school programs are.
11. Airport Authority Data Study
This project makes airports function more efficiently.
You will track data about flight delays, flight cancellations, the duration of operations on the ground, and what passengers think. This information helps airport workers make sound decisions, especially in case of issues like delays or emergencies.
Main Features
1. Most Popular Movies and Shows: You can use bar graphs to display what kinds of shows or movies are watched the most.
2. Long-term subscriptions: Display the timeline of the number of individuals subscribing over time. Use cards to display key stats such as total viewers, most-watched hits, and the rate at which the platform is growing.
Advantages
• Know the Audience: This dashboard tells you about what type of shows people like most and where they watch them.
• Increase Subscriptions: By observing how subscriptions fluctuate, you can determine how to get more individuals to subscribe or retain them for a longer duration.
• More Viewers: By examining important numbers, sites are able to discover more about retaining viewers.
How Power BI Has Evolved Over Time
Earlier, Business Intelligence (BI) tools used to just collect various types of data and give individuals reports. But as time passed, these tools became very intelligent. Now, they are using Artificial Intelligence (AI) and Machine Learning to accomplish more.
What Comes Next after You Upload a Dataset ?
Once you upload your data file, a window named Query Editor will open. It is a tool that assists you in correcting or editing your data prior to your use of it in Power BI. You are able to choose what rows or columns you need, alter the data type, and have it all set to make charts and reports.
Power BI Views
There are three major views in Power BI. You may toggle between them using the buttons on the side. Each one assists you in something different:
1. Report View – This is where you build your dashboards and charts.
2. Data View – This will display the data in table view so that you can verify and edit it.
3. Model View – This explains how your tables are connected to one another.
View Report
The Report View is where you construct your reports and charts. Here, you can insert pages, rearrange the items, and construct your own with various charts. This is the central area to construct and organize your report as you desire.
Data View
The Data View enables you to view your data once it has been loaded into Power BI. You can view it in a table format, much like Excel. This enables you to quickly comprehend how your data looks and check to ensure everything is in order.
Model View (Relationship View)
The Model View shows you how all of your tables relate to each other. If your data comes from multiple sources, you can use this view to get a sense of how everything relates. It makes it easier to visualize large or complex data.
Power BI has many useful tools and features:
• Modeling Ribbon: This is a ribbon where you can accomplish a lot like add data, change data types, calculate with your data, and add charts.
• Fields List: This shows you all the information you've input. You can click on different sections, like tables or columns, to see the information.
• Navigation Pane: It assists you to toggle between various views in Power BI, such as report view, data view, and model view.
• Visualization Pane: This provides you with more than 30 chart and visualization types to assist you in presenting your data in a fun and creative manner. If you wish, you can also browse the web for other chart types.
How to obtain Power BI certification?
We are an Education Technology company providing certification training courses to accelerate careers of working professionals worldwide. We impart training through instructor-led classroom workshops, instructor-led live virtual training sessions, and self-paced e-learning courses.
We have successfully conducted training sessions in 108 countries across the globe and enabled thousands of working professionals to enhance the scope of their careers.
Our enterprise training portfolio includes in-demand and globally recognized certification training courses in Project Management, Quality Management, Business Analysis, IT Service Management, Agile and Scrum, Cyber Security, Data Science, and Emerging Technologies. Download our Enterprise Training Catalog from https://www.icertglobal.com/corporate-training-for-enterprises.php and https://www.icertglobal.com/index.php
Popular Courses include:
-
Project Management: PMP, CAPM ,PMI RMP
-
Quality Management: Six Sigma Black Belt ,Lean Six Sigma Green Belt, Lean Management, Minitab,CMMI
-
Business Analysis: CBAP, CCBA, ECBA
-
Agile Training: PMI-ACP , CSM , CSPO
-
Scrum Training: CSM
-
DevOps
-
Program Management: PgMP
-
Cloud Technology: Exin Cloud Computing
-
Citrix Client Adminisration: Citrix Cloud Administration
The 10 top-paying certifications to target in 2024 are:
Conclusion
If you wish to begin a career in Business Intelligence or Power BI, iCert Global's Power BI Certification Program is the best place to begin. By studying through this course, you learn to manage data, make charts, and identify useful insights in order to empower businesses to take well-informed decisions. With this program, you can establish your expertise and become a professional in data analytics.
Want to learn more? See iCert Global's best Data Analytics Courses and Certifications!
FAQs
1. What are Power BI used by businesses for?
Power BI is a business application that enables companies to make sound decisions through converting data into simple-to-understand reports and charts.
2. How do the other Microsoft tools integrate with Power BI?
Power BI is integrated with other Microsoft applications. When you open a Power BI file, it loads your data so that you can build reports and dashboards using powerful tools that execute in the background.
3. Does Power BI support big data?
Yes! Power BI, with a premium license, can hold plenty of data—up to 100 TB—and handle large files too.
4. What are the most frequent Power BI project problems?
Some of the issues are a cluttered user interface, slow performance, data-sharing limitations, and dealing with complex configurations.
5. How do I stay current with Power BI news and features?
You may follow Power BI on LinkedIn or Twitter to see the latest updates, new features, and useful tips.
Contact Us For More Information:
Visit : www.icertglobal.com Email : info@icertglobal.com

10 Powerful Data Science Trends in 2025
To learn data science basics, you need to work with and understand a lot of information. It’s important for people who are in the field or want to join it. But just knowing the facts isn’t enough—you need hands-on experience to impress employers. Picking the right data science project helps show your skills and prove what you can do.
Why Data Science Projects Matter Today
In today's world, data is more important than ever. Data science has grown from a small field to a big part of how businesses make decisions. These projects help companies find useful information in large amounts of data. This helps them improve their work and make better choices.

Data Science Projects Are Everywhere
1. The Rise of Big Data
We generate more information today than we ever have. Every time we surf the web or shop online, we are adding to the volume of information.
2. Changing the Way Businesses Work
Data science projects help businesses improve and grow. Companies use data to make better decisions, understand customers, and predict trends.
3. Improving Healthcare with Data
Data science has changed the way doctors treat patients and do research. By studying patient data, doctors can find better ways to diagnose and treat diseases.
4. Smarter Money Decisions
Banks and investors apply data science to identify risks, prevent fraud, and make informed financial decisions. Computer algorithms analyze previous market patterns.
5. Helping Society and the Environment
Data science isn’t just for businesses—it also helps the world. Scientists study climate change using data. Others use it to tackle issues like poverty and inequality.
Top 10 Data Science Projects of 2025
1. Data Scrubbing/Cleaning
Data cleaning is perhaps the most important but challenging data science mission. It means cleaning and sorting out dirty data. It may take some time because there is so much data. But knowing how to do this skill makes you a more attractive person to hire. Start by looking for dirty datasets to clean.
2. Exploratory Data Analysis (EDA)
Exploratory Data Analysis (EDA) is all about understanding your data better. You dive into the data to find patterns, trends, and any oddities. You might also test out some ideas and present your results using stats and graphs.
3. Interactive Data Visualization
Interactive Data Visualization is all about creating visual elements like dashboards, maps, and charts to show data in a more engaging way. Visuals help users grasp complex information quickly. They work better than plain text.
4. Clustering Methods
Clustering is the process of grouping similar items together. In data science, clustering algorithms help to categorize data based on shared characteristics. This project will help you show how to classify data into clusters, making it easier to analyze.
5. Machine Learning
Machine learning pervades everything, from autonomous vehicles to recommendation algorithms. It's a powerful data science tool. Contributing to a machine learning project demonstrates that you're up-to-date with technological trends.
6. Effective Communication Exercises
In data science, unless you are able to make other people see the worth of your data models, your work won't be of much value. Communication is very important in making your results worth something and understandable.
In this project, you will gather your research, clean the data, and create visuals. Then, focus on presenting everything clearly. The goal is to show that you can explain your findings in a simple and engaging way.
7. AI-Based Healthcare Predictions

With increased medical information than ever, data scientists are using AI and machine learning to predict such events as disease outbreaks, patient recovery, and treatment success. Such processes improve patient care, lower expenses, and optimize the healthcare system as a whole.
8. Autonomous Cars and Transportation Optimization
Data science is a part of the creation of autonomous vehicles and the improvement of transport systems. Data science is an area of activities that studies sensor data. They wish to make decisions in real-time and leverage AI. They wish to improve safety and efficiency in transport.
9. Climate Change Modeling
Data science is applied by climatologists to forecast climate change impacts. These operations work on enormous databases. They inform us about climate trends and predict extreme weather events. They also devise means to adapt or mitigate the effects of climate change.
10. Financial Market Forecasting
Data scientists are making the stock market and other economic trend forecasting better. By studying historical data, news sentiment, and market indicators, such efforts create more accurate models to predict stock prices, investment strategies, and market trends.
Tools and Technologies Required for Data Science Projects
Data science initiatives require various tools to enable gathering of data, analysis, and making valid conclusions from data. Tools operate at various levels of the data science process, ranging from data gathering to model deployment. Below is a description of tools you will require:
• Database Warehouses: Amazon Redshift, Google BigQuery, and Snowflake are utilized to store large datasets in a scalable and efficient manner.
• Databases: Relational databases such as PostgreSQL and MySQL, NoSQL databases such as MongoDB and Cassandra, and distributed file systems such as Hadoop HDFS can handle both structured and unstructured data.
• Data Collection Frameworks: Apache Kafka, Apache Flume, and AWS Kinesis are used in the process of collecting real-time data streams.
• Data Wrangling Tools: Python's Pandas and R's dplyr are essentials for data cleaning, data manipulation, and data preparation for analysis.
• Statistical Analysis Software: R and Python (with libraries such as NumPy, SciPy, and StatsModels) are used most frequently for statistical analysis.
Cloud Services and Other Major Tools for Data Science Projects
• Cloud Services: Cloud platforms such as AWS, Google Cloud, and Microsoft Azure offer good data processing, storage, and machine learning tools and services. They allow easy scaling and handling of big data science projects.
• Serverless Computing: AWS Lambda and Azure Functions allow you to run serverless, event-driven data processing, which is resource and time efficient because it auto-scales.
• Version Control: Version control software like Git, and GitHub and GitLab, have to be utilized for code change tracking, collaboration, and effective project management.
• Project Management Tools: Jira and Trello are tools that help teams plan a project, track tasks, and collaborate.
Some Further Reflections on the Best Data Science Projects of 2025
• Ethical Issues: As AI and machine learning implementations increase in the sensitive fields of healthcare, finance, and social welfare, ethical issues will gain more visibility. Maintaining transparency, justice, and data privacy of data science activities will be one of the most essential areas of interest in the future
•Interdisciplinary Collaboration: Most data science projects need collaboration between data scientists, business analysts, engineers, and domain experts.
• Data Security and Governance: As data keeps growing in value, organizations will be more concerned with data governance and security.
• AI Explainability: As AI models become increasingly sophisticated, the demand for them to expound on how they arrive at their conclusions has grown.
• Sustainability: Sustainability efforts must become mainstream in 2025. Data science can drive efficiency in resource utilization, reduce waste, and tackle challenges such as climate change and thus is an agenda-top priority for socially-responsible data science.

Choose and Enroll in the Right Course Today
Selecting the appropriate data science course or training is the key to any individual who is willing to learn or progress in the field. Whether you are new or you have experience, the appropriate course will allow you to acquire the knowledge and skills that you need to succeed.
How to obtain AI Certification?
We are an Education Technology company providing certification training courses to accelerate careers of working professionals worldwide. We impart training through instructor-led classroom workshops, instructor-led live virtual training sessions, and self-paced e-learning courses.
We have successfully conducted training sessions in 108 countries across the globe and enabled thousands of working professionals to enhance the scope of their careers.
Our enterprise training portfolio includes in-demand and globally recognized certification training courses in Project Management, Quality Management, Business Analysis, IT Service Management, Agile and Scrum, Cyber Security, Data Science, and Emerging Technologies. Download our Enterprise Training Catalog from https://www.icertglobal.com/corporate-training-for-enterprises.php and https://www.icertglobal.com/index.php
Popular Courses include:
-
Project Management: PMP, CAPM ,PMI RMP
-
Quality Management: Six Sigma Black Belt ,Lean Six Sigma Green Belt, Lean Management, Minitab,CMMI
-
Business Analysis: CBAP, CCBA, ECBA
-
Agile Training: PMI-ACP , CSM , CSPO
-
Scrum Training: CSM
-
DevOps
-
Program Management: PgMP
-
Cloud Technology: Exin Cloud Computing
-
Citrix Client Adminisration: Citrix Cloud Administration
The 10 top-paying certifications to target in 2025 are:
Conclusion
This program provides industry-best training from experienced faculty, educating you in the most critical machine learning and data science skills. You get hands-on exposure to best-in-class tools such as R, SAS, Python, Tableau, Hadoop, and Spark, making you practice-ready.
Start your path to a career in data science today! If you'd like more information about the program or to enroll, just ask.
Contact Us For More Information:
Visit : www.icertglobal.com Email : info@icertglobal.com
Read More
To learn data science basics, you need to work with and understand a lot of information. It’s important for people who are in the field or want to join it. But just knowing the facts isn’t enough—you need hands-on experience to impress employers. Picking the right data science project helps show your skills and prove what you can do.
Why Data Science Projects Matter Today
In today's world, data is more important than ever. Data science has grown from a small field to a big part of how businesses make decisions. These projects help companies find useful information in large amounts of data. This helps them improve their work and make better choices.
Data Science Projects Are Everywhere
1. The Rise of Big Data
We generate more information today than we ever have. Every time we surf the web or shop online, we are adding to the volume of information.
2. Changing the Way Businesses Work
Data science projects help businesses improve and grow. Companies use data to make better decisions, understand customers, and predict trends.
3. Improving Healthcare with Data
Data science has changed the way doctors treat patients and do research. By studying patient data, doctors can find better ways to diagnose and treat diseases.
4. Smarter Money Decisions
Banks and investors apply data science to identify risks, prevent fraud, and make informed financial decisions. Computer algorithms analyze previous market patterns.
5. Helping Society and the Environment
Data science isn’t just for businesses—it also helps the world. Scientists study climate change using data. Others use it to tackle issues like poverty and inequality.
Top 10 Data Science Projects of 2025
1. Data Scrubbing/Cleaning
Data cleaning is perhaps the most important but challenging data science mission. It means cleaning and sorting out dirty data. It may take some time because there is so much data. But knowing how to do this skill makes you a more attractive person to hire. Start by looking for dirty datasets to clean.
2. Exploratory Data Analysis (EDA)
Exploratory Data Analysis (EDA) is all about understanding your data better. You dive into the data to find patterns, trends, and any oddities. You might also test out some ideas and present your results using stats and graphs.
3. Interactive Data Visualization
Interactive Data Visualization is all about creating visual elements like dashboards, maps, and charts to show data in a more engaging way. Visuals help users grasp complex information quickly. They work better than plain text.
4. Clustering Methods
Clustering is the process of grouping similar items together. In data science, clustering algorithms help to categorize data based on shared characteristics. This project will help you show how to classify data into clusters, making it easier to analyze.
5. Machine Learning
Machine learning pervades everything, from autonomous vehicles to recommendation algorithms. It's a powerful data science tool. Contributing to a machine learning project demonstrates that you're up-to-date with technological trends.
6. Effective Communication Exercises
In data science, unless you are able to make other people see the worth of your data models, your work won't be of much value. Communication is very important in making your results worth something and understandable.
In this project, you will gather your research, clean the data, and create visuals. Then, focus on presenting everything clearly. The goal is to show that you can explain your findings in a simple and engaging way.
7. AI-Based Healthcare Predictions
With increased medical information than ever, data scientists are using AI and machine learning to predict such events as disease outbreaks, patient recovery, and treatment success. Such processes improve patient care, lower expenses, and optimize the healthcare system as a whole.
8. Autonomous Cars and Transportation Optimization
Data science is a part of the creation of autonomous vehicles and the improvement of transport systems. Data science is an area of activities that studies sensor data. They wish to make decisions in real-time and leverage AI. They wish to improve safety and efficiency in transport.
9. Climate Change Modeling
Data science is applied by climatologists to forecast climate change impacts. These operations work on enormous databases. They inform us about climate trends and predict extreme weather events. They also devise means to adapt or mitigate the effects of climate change.
10. Financial Market Forecasting
Data scientists are making the stock market and other economic trend forecasting better. By studying historical data, news sentiment, and market indicators, such efforts create more accurate models to predict stock prices, investment strategies, and market trends.
Tools and Technologies Required for Data Science Projects
Data science initiatives require various tools to enable gathering of data, analysis, and making valid conclusions from data. Tools operate at various levels of the data science process, ranging from data gathering to model deployment. Below is a description of tools you will require:
• Database Warehouses: Amazon Redshift, Google BigQuery, and Snowflake are utilized to store large datasets in a scalable and efficient manner.
• Databases: Relational databases such as PostgreSQL and MySQL, NoSQL databases such as MongoDB and Cassandra, and distributed file systems such as Hadoop HDFS can handle both structured and unstructured data.
• Data Collection Frameworks: Apache Kafka, Apache Flume, and AWS Kinesis are used in the process of collecting real-time data streams.
• Data Wrangling Tools: Python's Pandas and R's dplyr are essentials for data cleaning, data manipulation, and data preparation for analysis.
• Statistical Analysis Software: R and Python (with libraries such as NumPy, SciPy, and StatsModels) are used most frequently for statistical analysis.
Cloud Services and Other Major Tools for Data Science Projects
• Cloud Services: Cloud platforms such as AWS, Google Cloud, and Microsoft Azure offer good data processing, storage, and machine learning tools and services. They allow easy scaling and handling of big data science projects.
• Serverless Computing: AWS Lambda and Azure Functions allow you to run serverless, event-driven data processing, which is resource and time efficient because it auto-scales.
• Version Control: Version control software like Git, and GitHub and GitLab, have to be utilized for code change tracking, collaboration, and effective project management.
• Project Management Tools: Jira and Trello are tools that help teams plan a project, track tasks, and collaborate.
Some Further Reflections on the Best Data Science Projects of 2025
• Ethical Issues: As AI and machine learning implementations increase in the sensitive fields of healthcare, finance, and social welfare, ethical issues will gain more visibility. Maintaining transparency, justice, and data privacy of data science activities will be one of the most essential areas of interest in the future
•Interdisciplinary Collaboration: Most data science projects need collaboration between data scientists, business analysts, engineers, and domain experts.
• Data Security and Governance: As data keeps growing in value, organizations will be more concerned with data governance and security.
• AI Explainability: As AI models become increasingly sophisticated, the demand for them to expound on how they arrive at their conclusions has grown.
• Sustainability: Sustainability efforts must become mainstream in 2025. Data science can drive efficiency in resource utilization, reduce waste, and tackle challenges such as climate change and thus is an agenda-top priority for socially-responsible data science.
Choose and Enroll in the Right Course Today
Selecting the appropriate data science course or training is the key to any individual who is willing to learn or progress in the field. Whether you are new or you have experience, the appropriate course will allow you to acquire the knowledge and skills that you need to succeed.
How to obtain AI Certification?
We are an Education Technology company providing certification training courses to accelerate careers of working professionals worldwide. We impart training through instructor-led classroom workshops, instructor-led live virtual training sessions, and self-paced e-learning courses.
We have successfully conducted training sessions in 108 countries across the globe and enabled thousands of working professionals to enhance the scope of their careers.
Our enterprise training portfolio includes in-demand and globally recognized certification training courses in Project Management, Quality Management, Business Analysis, IT Service Management, Agile and Scrum, Cyber Security, Data Science, and Emerging Technologies. Download our Enterprise Training Catalog from https://www.icertglobal.com/corporate-training-for-enterprises.php and https://www.icertglobal.com/index.php
Popular Courses include:
-
Project Management: PMP, CAPM ,PMI RMP
-
Quality Management: Six Sigma Black Belt ,Lean Six Sigma Green Belt, Lean Management, Minitab,CMMI
-
Business Analysis: CBAP, CCBA, ECBA
-
Agile Training: PMI-ACP , CSM , CSPO
-
Scrum Training: CSM
-
DevOps
-
Program Management: PgMP
-
Cloud Technology: Exin Cloud Computing
-
Citrix Client Adminisration: Citrix Cloud Administration
The 10 top-paying certifications to target in 2025 are:
Conclusion
This program provides industry-best training from experienced faculty, educating you in the most critical machine learning and data science skills. You get hands-on exposure to best-in-class tools such as R, SAS, Python, Tableau, Hadoop, and Spark, making you practice-ready.
Start your path to a career in data science today! If you'd like more information about the program or to enroll, just ask.
Contact Us For More Information:
Visit : www.icertglobal.com Email : info@icertglobal.com
From Data to Decisions Descriptive Statistics Explained
What is Statistical Analysis?
Statistical analysis is a process of collecting and analyzing data to determine patterns and trends. Statistical analysis eliminates errors in data analysis using numbers and facts. Statistical analysis is needed in understanding studies, building models, and developing surveys.
In fields like artificial intelligence and machine learning, statistical analysis helps to manage gigantic amounts of data and translate them into useful information. In other words, it helps to make people understand raw data and draw meaningful inferences.
Statistics aid firms in making informed choices. They predict what will occur in the future based on what happened in the past. It interprets numbers into useful information. It aids firms, researchers, and other professionals.

Types of Statistical Analysis
There are six general categories of statistical analysis :
Descriptive Analysis
This type shows and summarizes information in the modes of charts, graphs, and tables. It shows complex information in a straightforward way but never concludes.
Inferential Analysis
This kind of analysis examines data and draws conclusions. It explores the relationship between items and predicts an entire group.
Predictive Analysis
Predictive analysis examines past trends. It uses data models, machine learning, artificial intelligence to forecast future events.
Prescriptive Analysis
This form of chart indicates the best action for a given result. It allows companies to make intelligent decisions.
Exploratory Data Analysis
Exploratory data analysis uncovers patterns in the data that are not self-evident. It also considers the interaction between various pieces of information.
Causal Analysis
Causal analysis establishes cause-and-effect relationships between data. Causal analysis tells firms why an event happened and how it impacts other variables.

Why is Statistical Analysis Important?
Statistical analysis is of great assistance.It condenses lots of information into easy and concise conclusions. It assists organizations and researchers to prepare more effective studies, surveys, and experiments. It forecast the future on the basis of information from the past. It assists professionals of every profession ranging from science and finance to marketing. It also supports informed business and research and governmental decision-making.
Statistical analysis is utilized by business managers, scientists, politicians, and banks. It helps them make data-driven decisions and interpret data. It is one of the most important contributors in today's data-driven world.
Benefits of Statistical Analysis
Statistical analysis is a valuable asset. It helps individuals and businesses to make better decisions. A few of the best benefits are:
•Better decision-making: Measures sales, income, and expenditure on a month-by-month, quarter-by-quarter, and annual basis. It results in enhanced business decisions.
• Problem-Solving: Determines problems or failure causes and recommends solutions. It can establish causes of increased costs and eliminate wasteful spending.
• Market Research: Helps in market trend analysis, customer analysis, and formulating effective marketing strategies.

• Increased Efficiency: Increases efficiency by automating various processes and minimizing errors.
Steps of Statistical Analysis
To perform statistical analysis, follow these five big steps:
1. Understand the Data: Familiarize and identify data you will analyze.
2. Connect to the Population: Identify how the sample data relates to the entire population.
3. Construct a Model: Construct a model that demonstrates how data relates to the population.
4. Test the Model: Verify that the model is accurate and reliable.
5. Predict Future Trends: Use predictive analysis to predict future happenings based on past data.
Common Statistical Analysis Methods
There are numerous statistical analysis techniques. Five of the most commonly applied are:
• Mean (Average): A basic method of determining the general direction in a set of numbers by adding all the numbers together and dividing by the amount of them.
• Standard Deviation: Shows how far the data points are from the mean. It enables you to see how much the outcomes differ.
• Regression Analysis: Shows how variables are related and predicts trends.
• Hypothesis Testing: It tests hypotheses and verifies if data supports them.
• Sample Size Determination: Determines a representative small population from a large population to research.
Role of Statistical Software
The majority of companies use AI and machine learning software. This is because, statistically, human analysis is very time-consuming and tiresome. Such software:
• Perform high accuracy calculations automatically.
• Instantly recognize patterns and trends.
• Make charts, graphs, and tables in minutes.
Career in Statistical Analysis
Statistical analysis is a profession that offers many opportunities across many fields. This is how you can start and advance a career in it:
Entry-Level Positions
The majority of individuals begin their professional life as Data Analysts. You can enter this profession with:
• A diploma or certificate in data analysis at the high school level.
• A BSc in Maths, Computer Sciences, or Stats is preferred but Business, Econ, and SS can be applied.
• Career shift through gaining statistical analysis through an online course or certificate.
Pathway to Become a Data Scientist
A Statistical Analyst role can be a great stepping stone into higher-level data roles. Data Scientists tend to hold higher-level roles with more complex specifications in:
• Statistical tools and software (e.g., R, Python, or SQL).
• Predictive modeling and analytics to project and examine trends.
• Programming skills to handle and process big data.
Skills for Growth
Future Statistical Analysts and Data Analysts need to learn to:
• Python, R, or SQL programming languages.
• Database management and data visualization with tools such as Tableau.
• Data preparation and cleaning to ensure accuracy.
• Advanced statistical modeling to dissect intricate datasets.

Career Advancement
• Senior Data Analyst: Oversee analytical projects and mentor junior analysts.
• Lead Statistical Analyst: Oversee a team of analysts and lead data-driven decision making.
• Data Scientist: Use artificial intelligence and machine learning to process large data sets.
To develop a career in data science and analytics, keep upgrading your technical skills. Also, gain hands-on experience.
How to obtain Data Science certification?
We are an Education Technology company providing certification training courses to accelerate careers of working professionals worldwide. We impart training through instructor-led classroom workshops, instructor-led live virtual training sessions, and self-paced e-learning courses.
We have successfully conducted training sessions in 108 countries across the globe and enabled thousands of working professionals to enhance the scope of their careers.
Our enterprise training portfolio includes in-demand and globally recognized certification training courses in Project Management, Quality Management, Business Analysis, IT Service Management, Agile and Scrum, Cyber Security, Data Science, and Emerging Technologies. Download our Enterprise Training Catalog from https://www.icertglobal.com/corporate-training-for-enterprises.php and https://www.icertglobal.com/index.php
Popular Courses include:
-
Project Management: PMP, CAPM ,PMI RMP
-
Quality Management: Six Sigma Black Belt ,Lean Six Sigma Green Belt, Lean Management, Minitab,CMMI
-
Business Analysis: CBAP, CCBA, ECBA
-
Agile Training: PMI-ACP , CSM , CSPO
-
Scrum Training: CSM
-
DevOps
-
Program Management: PgMP
-
Cloud Technology: Exin Cloud Computing
-
Citrix Client Adminisration: Citrix Cloud Administration
The 10 top-paying certifications to target in 2025 are:
Master Today's Statistics with iCert Global!
We hope this article has been able to persuade you why statistical analysis is necessary in most industries. Statistical analysis has become simpler and faster with the introduction of AI.
If you're someone who loves data and numbers, this is your moment to shine! Look at iCert Global's Data Analytics course. It focuses on hands-on application and has hands-on projects. This is where you can start with Artificial Intelligence and Data Science!
Contact Us For More Information:
Visit : www.icertglobal.com Email : info@icertglobal.com
Read More
What is Statistical Analysis?
Statistical analysis is a process of collecting and analyzing data to determine patterns and trends. Statistical analysis eliminates errors in data analysis using numbers and facts. Statistical analysis is needed in understanding studies, building models, and developing surveys.
In fields like artificial intelligence and machine learning, statistical analysis helps to manage gigantic amounts of data and translate them into useful information. In other words, it helps to make people understand raw data and draw meaningful inferences.
Statistics aid firms in making informed choices. They predict what will occur in the future based on what happened in the past. It interprets numbers into useful information. It aids firms, researchers, and other professionals.
Types of Statistical Analysis
There are six general categories of statistical analysis :
Descriptive Analysis
This type shows and summarizes information in the modes of charts, graphs, and tables. It shows complex information in a straightforward way but never concludes.
Inferential Analysis
This kind of analysis examines data and draws conclusions. It explores the relationship between items and predicts an entire group.
Predictive Analysis
Predictive analysis examines past trends. It uses data models, machine learning, artificial intelligence to forecast future events.
Prescriptive Analysis
This form of chart indicates the best action for a given result. It allows companies to make intelligent decisions.
Exploratory Data Analysis
Exploratory data analysis uncovers patterns in the data that are not self-evident. It also considers the interaction between various pieces of information.
Causal Analysis
Causal analysis establishes cause-and-effect relationships between data. Causal analysis tells firms why an event happened and how it impacts other variables.
Why is Statistical Analysis Important?
Statistical analysis is of great assistance.It condenses lots of information into easy and concise conclusions. It assists organizations and researchers to prepare more effective studies, surveys, and experiments. It forecast the future on the basis of information from the past. It assists professionals of every profession ranging from science and finance to marketing. It also supports informed business and research and governmental decision-making.
Statistical analysis is utilized by business managers, scientists, politicians, and banks. It helps them make data-driven decisions and interpret data. It is one of the most important contributors in today's data-driven world.
Benefits of Statistical Analysis
Statistical analysis is a valuable asset. It helps individuals and businesses to make better decisions. A few of the best benefits are:
•Better decision-making: Measures sales, income, and expenditure on a month-by-month, quarter-by-quarter, and annual basis. It results in enhanced business decisions.
• Problem-Solving: Determines problems or failure causes and recommends solutions. It can establish causes of increased costs and eliminate wasteful spending.
• Market Research: Helps in market trend analysis, customer analysis, and formulating effective marketing strategies.
• Increased Efficiency: Increases efficiency by automating various processes and minimizing errors.
Steps of Statistical Analysis
To perform statistical analysis, follow these five big steps:
1. Understand the Data: Familiarize and identify data you will analyze.
2. Connect to the Population: Identify how the sample data relates to the entire population.
3. Construct a Model: Construct a model that demonstrates how data relates to the population.
4. Test the Model: Verify that the model is accurate and reliable.
5. Predict Future Trends: Use predictive analysis to predict future happenings based on past data.
Common Statistical Analysis Methods
There are numerous statistical analysis techniques. Five of the most commonly applied are:
• Mean (Average): A basic method of determining the general direction in a set of numbers by adding all the numbers together and dividing by the amount of them.
• Standard Deviation: Shows how far the data points are from the mean. It enables you to see how much the outcomes differ.
• Regression Analysis: Shows how variables are related and predicts trends.
• Hypothesis Testing: It tests hypotheses and verifies if data supports them.
• Sample Size Determination: Determines a representative small population from a large population to research.
Role of Statistical Software
The majority of companies use AI and machine learning software. This is because, statistically, human analysis is very time-consuming and tiresome. Such software:
• Perform high accuracy calculations automatically.
• Instantly recognize patterns and trends.
• Make charts, graphs, and tables in minutes.
Career in Statistical Analysis
Statistical analysis is a profession that offers many opportunities across many fields. This is how you can start and advance a career in it:
Entry-Level Positions
The majority of individuals begin their professional life as Data Analysts. You can enter this profession with:
• A diploma or certificate in data analysis at the high school level.
• A BSc in Maths, Computer Sciences, or Stats is preferred but Business, Econ, and SS can be applied.
• Career shift through gaining statistical analysis through an online course or certificate.
Pathway to Become a Data Scientist
A Statistical Analyst role can be a great stepping stone into higher-level data roles. Data Scientists tend to hold higher-level roles with more complex specifications in:
• Statistical tools and software (e.g., R, Python, or SQL).
• Predictive modeling and analytics to project and examine trends.
• Programming skills to handle and process big data.
Skills for Growth
Future Statistical Analysts and Data Analysts need to learn to:
• Python, R, or SQL programming languages.
• Database management and data visualization with tools such as Tableau.
• Data preparation and cleaning to ensure accuracy.
• Advanced statistical modeling to dissect intricate datasets.
Career Advancement
• Senior Data Analyst: Oversee analytical projects and mentor junior analysts.
• Lead Statistical Analyst: Oversee a team of analysts and lead data-driven decision making.
• Data Scientist: Use artificial intelligence and machine learning to process large data sets.
To develop a career in data science and analytics, keep upgrading your technical skills. Also, gain hands-on experience.
How to obtain Data Science certification?
We are an Education Technology company providing certification training courses to accelerate careers of working professionals worldwide. We impart training through instructor-led classroom workshops, instructor-led live virtual training sessions, and self-paced e-learning courses.
We have successfully conducted training sessions in 108 countries across the globe and enabled thousands of working professionals to enhance the scope of their careers.
Our enterprise training portfolio includes in-demand and globally recognized certification training courses in Project Management, Quality Management, Business Analysis, IT Service Management, Agile and Scrum, Cyber Security, Data Science, and Emerging Technologies. Download our Enterprise Training Catalog from https://www.icertglobal.com/corporate-training-for-enterprises.php and https://www.icertglobal.com/index.php
Popular Courses include:
-
Project Management: PMP, CAPM ,PMI RMP
-
Quality Management: Six Sigma Black Belt ,Lean Six Sigma Green Belt, Lean Management, Minitab,CMMI
-
Business Analysis: CBAP, CCBA, ECBA
-
Agile Training: PMI-ACP , CSM , CSPO
-
Scrum Training: CSM
-
DevOps
-
Program Management: PgMP
-
Cloud Technology: Exin Cloud Computing
-
Citrix Client Adminisration: Citrix Cloud Administration
The 10 top-paying certifications to target in 2025 are:
Master Today's Statistics with iCert Global!
We hope this article has been able to persuade you why statistical analysis is necessary in most industries. Statistical analysis has become simpler and faster with the introduction of AI.
If you're someone who loves data and numbers, this is your moment to shine! Look at iCert Global's Data Analytics course. It focuses on hands-on application and has hands-on projects. This is where you can start with Artificial Intelligence and Data Science!
Contact Us For More Information:
Visit : www.icertglobal.com Email : info@icertglobal.com
BI Developer What to Expect Regarding Roles, Skills, and Tools
BI Developers are significant in business companies. They develop systems that assist businesses in using data to make intelligent decisions. This article looks at BI Developers. It explains their job, how to become one, needed skills, job openings, salary, and tools they use.
What Is a Business Intelligence Developer?
A Business Intelligence (BI) Developer is a software expert. They design and manage tools that help analyze and report data. They build reports, dashboards, and other BI tools. This lets businesses access and understand their data. Their main job is to turn raw data into useful insights. This helps companies make smart decisions. BI Developers improve business performance by providing timely and accurate information.
What Is a Business Intelligence Developer?
A BI Developer helps companies make better decisions. They turn data into useful insights. These are some of the most important things they do:
BI Developers build and manage the systems for business intelligence.
Their responsibilities include:
- Design, install, and update BI software and tools. Ensure they connect properly with databases and data warehouses.
- Build dashboards, reports, and visuals to simplify complex data. This way, decision-makers can easily find trends and insights.
BI Developers organize data for reports and dashboards. They make sure the information is valid and meaningful.
Their role involves:
- Create and improve data models to keep data organized and useful for analysis. • Database management so that databases are fast, stable, and secure. This means optimizing query performance, maintaining data integrity, and optimizing storage.
ETL processes are managed by BI Developers. They focus on Extraction, Transformation, and Loading. This covers:
- Extracting data from various sources.
- Cleaning and structuring the data into an useful format.
- Loading processed data such that it can be analyzed effectively efficiently.
The process helps ensure businesses always have correct and current data for decision-making.
BI Developers work closely with different teams to understand their data needs. Their responsibilities include:
• Gather requirements and suggest ways to use data for business goals.
• Ensuring that BI solutions suit the organization's objectives.
• Helping users learn to use BI tools and reports effectively.
BI Developers maintain and upgrade BI tools and systems to:
• Fix bugs and ensure data accuracy.
• New data sources are added and analytical capabilities enhanced. • BI solutions are kept up to date to accommodate evolving business requirements.
- They always look for ways to improve BI tools. This helps them provide the best analysis.Stay Updated BI technology changes all the time.
BI Developers should keep an eye on new trends, tools, and methods. These comprise:
• Acquisition of new programming languages and BI software.
• Use of the latest data visualization and analytics tools.
• Experimentation with novel approaches to handling and analyzing data.
How to Become a Business Intelligence Developer?
Becoming a BI Developer involves education, skill acquisition, and practical experience. Here are the steps to join this rewarding profession:
1. Obtain Relevant Education
• Bachelor's Degree: Start with a degree in Computer Science, Information Technology, Data Science, or Business Information Systems. This will introduce you to the key ideas and tools in BI development.
2. Gain Practical Experience
• Internships and Projects: Pursue internships in data analysis, database management, or related areas. Work on BI development projects, like data visualization or database design.
3. Develop Technical Skills
- Learn BI and Data Visualization Tools: Use Power BI, Tableau, and QlikSense. Create dashboards and reports with these tools.
4. Understand ETL Processes
- Learn ETL Tools and Techniques: Get to know Extract, Transform, Load (ETL) processes. These steps help prepare data for analysis.
5. Develop Analytical and Soft Skills
• Analytical Skills: Can recognize trends, analyze data, and deliver useful insights.
6. Stay Updated and Network • Keep Learning: BI technology keeps changing. Stay updated by reading industry news, joining workshops, and engaging in online groups.
7. Apply for Jobs • Prepare Your Resume: Emphasize your applicable experience, skills, and certifications.
Skills of a Business Intelligence Developer
A BI Developer must have both technical and analytical skills.
They must also have good soft skills. This mix helps them turn raw data into useful business insights.
Technical Skills
• BI Tools Knowledge: Know tools like Power BI, Tableau, QlikSense, or SAS BI. Use them to create reports, dashboards, and visualizations.
• Database Knowledge: Thorough knowledge of SQL, database design, and management systems (SQL Server, Oracle, MySQL).
Analytical Skills
• Data Analysis: The skill to spot trends, patterns, and insights in data. This helps guide decision-making.
• Problem-Solving: Identify and fix data issues like quality, integration, and performance.
Soft Skills
• Communication: Sharing data insights in a way that non-technical stakeholders can easily grasp.
• Collaboration: Collaborating with data analysts, IT professionals, and business leaders to create BI solutions.
• Time Management: Managing multiple projects and meeting deadlines efficiently.
Business Acumen
• Understanding Business Objectives: Aligning BI solutions with business objectives to deliver meaningful insights.
How to obtain Data Science certification?
We are an Education Technology company providing certification training courses to accelerate careers of working professionals worldwide. We impart training through instructor-led classroom workshops, instructor-led live virtual training sessions, and self-paced e-learning courses.
We have successfully conducted training sessions in 108 countries across the globe and enabled thousands of working professionals to enhance the scope of their careers.
Our enterprise training portfolio includes in-demand and globally recognized certification training courses in Project Management, Quality Management, Business Analysis, IT Service Management, Agile and Scrum, Cyber Security, Data Science, and Emerging Technologies. Download our Enterprise Training Catalog from https://www.icertglobal.com/corporate-training-for-enterprises.php and https://www.icertglobal.com/index.php
Popular Courses include:
-
Project Management: PMP, CAPM ,PMI RMP
-
Quality Management: Six Sigma Black Belt ,Lean Six Sigma Green Belt, Lean Management, Minitab,CMMI
-
Business Analysis: CBAP, CCBA, ECBA
-
Agile Training: PMI-ACP , CSM , CSPO
-
Scrum Training: CSM
-
DevOps
-
Program Management: PgMP
-
Cloud Technology: Exin Cloud Computing
-
Citrix Client Adminisration: Citrix Cloud Administration
The 10 top-paying certifications to target in 2025 are:
Conclusion
Start Your BI Career Want to become a Business Intelligence Developer? Master data analytics, visualization, SQL, and BI tools with industry-specific courses. Get hands-on experience, develop real-world projects, and launch your career in BI today
Contact Us For More Information:
Visit :www.icertglobal.com Email :
Read More
BI Developers are significant in business companies. They develop systems that assist businesses in using data to make intelligent decisions. This article looks at BI Developers. It explains their job, how to become one, needed skills, job openings, salary, and tools they use.
What Is a Business Intelligence Developer?
A Business Intelligence (BI) Developer is a software expert. They design and manage tools that help analyze and report data. They build reports, dashboards, and other BI tools. This lets businesses access and understand their data. Their main job is to turn raw data into useful insights. This helps companies make smart decisions. BI Developers improve business performance by providing timely and accurate information.
What Is a Business Intelligence Developer?
A BI Developer helps companies make better decisions. They turn data into useful insights. These are some of the most important things they do:
BI Developers build and manage the systems for business intelligence.
Their responsibilities include:
- Design, install, and update BI software and tools. Ensure they connect properly with databases and data warehouses.
- Build dashboards, reports, and visuals to simplify complex data. This way, decision-makers can easily find trends and insights.
BI Developers organize data for reports and dashboards. They make sure the information is valid and meaningful.
Their role involves:
- Create and improve data models to keep data organized and useful for analysis. • Database management so that databases are fast, stable, and secure. This means optimizing query performance, maintaining data integrity, and optimizing storage.
ETL processes are managed by BI Developers. They focus on Extraction, Transformation, and Loading. This covers:
- Extracting data from various sources.
- Cleaning and structuring the data into an useful format.
- Loading processed data such that it can be analyzed effectively efficiently.
The process helps ensure businesses always have correct and current data for decision-making.
BI Developers work closely with different teams to understand their data needs. Their responsibilities include:
• Gather requirements and suggest ways to use data for business goals.
• Ensuring that BI solutions suit the organization's objectives.
• Helping users learn to use BI tools and reports effectively.
BI Developers maintain and upgrade BI tools and systems to:
• Fix bugs and ensure data accuracy.
• New data sources are added and analytical capabilities enhanced. • BI solutions are kept up to date to accommodate evolving business requirements.
- They always look for ways to improve BI tools. This helps them provide the best analysis.Stay Updated BI technology changes all the time.
BI Developers should keep an eye on new trends, tools, and methods. These comprise:
• Acquisition of new programming languages and BI software.
• Use of the latest data visualization and analytics tools.
• Experimentation with novel approaches to handling and analyzing data.
How to Become a Business Intelligence Developer?
Becoming a BI Developer involves education, skill acquisition, and practical experience. Here are the steps to join this rewarding profession:
1. Obtain Relevant Education
• Bachelor's Degree: Start with a degree in Computer Science, Information Technology, Data Science, or Business Information Systems. This will introduce you to the key ideas and tools in BI development.
2. Gain Practical Experience
• Internships and Projects: Pursue internships in data analysis, database management, or related areas. Work on BI development projects, like data visualization or database design.
3. Develop Technical Skills
- Learn BI and Data Visualization Tools: Use Power BI, Tableau, and QlikSense. Create dashboards and reports with these tools.
4. Understand ETL Processes
- Learn ETL Tools and Techniques: Get to know Extract, Transform, Load (ETL) processes. These steps help prepare data for analysis.
5. Develop Analytical and Soft Skills
• Analytical Skills: Can recognize trends, analyze data, and deliver useful insights.
6. Stay Updated and Network • Keep Learning: BI technology keeps changing. Stay updated by reading industry news, joining workshops, and engaging in online groups.
7. Apply for Jobs • Prepare Your Resume: Emphasize your applicable experience, skills, and certifications.
Skills of a Business Intelligence Developer
A BI Developer must have both technical and analytical skills.
They must also have good soft skills. This mix helps them turn raw data into useful business insights.
Technical Skills
• BI Tools Knowledge: Know tools like Power BI, Tableau, QlikSense, or SAS BI. Use them to create reports, dashboards, and visualizations.
• Database Knowledge: Thorough knowledge of SQL, database design, and management systems (SQL Server, Oracle, MySQL).
Analytical Skills
• Data Analysis: The skill to spot trends, patterns, and insights in data. This helps guide decision-making.
• Problem-Solving: Identify and fix data issues like quality, integration, and performance.
Soft Skills
• Communication: Sharing data insights in a way that non-technical stakeholders can easily grasp.
• Collaboration: Collaborating with data analysts, IT professionals, and business leaders to create BI solutions.
• Time Management: Managing multiple projects and meeting deadlines efficiently.
Business Acumen
• Understanding Business Objectives: Aligning BI solutions with business objectives to deliver meaningful insights.
How to obtain Data Science certification?
We are an Education Technology company providing certification training courses to accelerate careers of working professionals worldwide. We impart training through instructor-led classroom workshops, instructor-led live virtual training sessions, and self-paced e-learning courses.
We have successfully conducted training sessions in 108 countries across the globe and enabled thousands of working professionals to enhance the scope of their careers.
Our enterprise training portfolio includes in-demand and globally recognized certification training courses in Project Management, Quality Management, Business Analysis, IT Service Management, Agile and Scrum, Cyber Security, Data Science, and Emerging Technologies. Download our Enterprise Training Catalog from https://www.icertglobal.com/corporate-training-for-enterprises.php and https://www.icertglobal.com/index.php
Popular Courses include:
-
Project Management: PMP, CAPM ,PMI RMP
-
Quality Management: Six Sigma Black Belt ,Lean Six Sigma Green Belt, Lean Management, Minitab,CMMI
-
Business Analysis: CBAP, CCBA, ECBA
-
Agile Training: PMI-ACP , CSM , CSPO
-
Scrum Training: CSM
-
DevOps
-
Program Management: PgMP
-
Cloud Technology: Exin Cloud Computing
-
Citrix Client Adminisration: Citrix Cloud Administration
The 10 top-paying certifications to target in 2025 are:
Conclusion
Start Your BI Career Want to become a Business Intelligence Developer? Master data analytics, visualization, SQL, and BI tools with industry-specific courses. Get hands-on experience, develop real-world projects, and launch your career in BI today
Contact Us For More Information:
Visit :www.icertglobal.com Email :

The 15 Must Have Data Science Skills for 2025
Why Data Science Skills Matter
Skills are key for career growth, especially in fast-changing fields like data science. As we move toward 2025, the demand for data scientists with strong skills will continue to rise. This article explores 20+ important skills that both new and experienced data scientists need to succeed. We’ll cover all the skills you need. This includes soft skills like problem-solving and communication. It also includes technical skills like programming and machine learning.
Important Skills for Data Scientists
Here are some of the key skills every data scientist should learn:
- Programming Languages: SQL, R, and Python
- Statistical Analysis: Using math and statistics to analyze data
- Machine Learning: Tools like TensorFlow, PyTorch, and Scikit-Learn
- Data Visualization: Creating charts and graphs using Tableau, Power BI, and Matplotlib
- Data Wrangling: Cleaning and organizing messy data
- Big Data: Working with large datasets using Spark and Hadoop
- Database Management: Using MongoDB, PostgreSQL, and MySQL
- Cloud Computing: Working with Google Cloud, Microsoft Azure, and Amazon Web Services (AWS)
- Statistical Software: Tools like SPSS and SAS for data analysis
- Mathematics: Learning calculus, probability, and linear algebra
- Data Mining: Finding useful information in large amounts of data
- Natural Language Processing (NLP): Analyzing and understanding text dat
Essential Technical Skills for Data Scientists
1. Data Visualization : Data visualization helps scientists turn complicated data into easy-to-understand charts and graphs. They use tools such as Tableau, Power BI, Matplotlib, and Seaborn. These tools help them create visuals that highlight key trends and patterns. This helps experts and beginners understand the data better. They can then make smart decisions.
2. Machine Learning : Machine learning allows computers to learn from data and make predictions. Data scientists use tools like TensorFlow, PyTorch, and Scikit-Learn. These help them build models that spot patterns. This way, businesses can make smarter decisions. This skill is useful for things like predicting stock prices, recommending movies, or even detecting fraud.
3. Programming is key for data scientists : It helps them handle data, build models, and automate tasks. Python, R, and SQL are widely used for data analysis, statistics, and managing databases. Good programming skills help data scientists organize big datasets, build custom tools, and improve their work efficiency.
4. Understanding probability and statistics : helps data scientists analyze data and make smart decisions. They apply math ideas like hypothesis testing, regression analysis, and probability distributions. These methods help them spot patterns in data and make predictions about outcomes. These skills help them see if their models are accurate. They can then make reliable conclusions.
5. Deep Learning : Deep learning is a unique kind of machine learning. It helps computers recognize images, understand speech, and process text.
It uses neural networks, which are designed to work like the human brain. Scientists use TensorFlow and PyTorch to create and train these models. Deep learning plays a key role in AI. It helps create self-driving cars and voice assistants.
6. Data scientists : deal with vast amounts of data. They need solid computing skills to process information fast. You need to understand how computers work. This means using parallel processing, which divides tasks into smaller parts. You also need to manage big data with tools like Apache Hadoop and Spark. Good computing skills help data scientists analyze data faster and get accurate results.
7. Mathematical Skills : Math is key for data scientists. It helps them build models, analyze data, and solve problems. They need to understand linear algebra, calculus, and statistics. These skills are used to develop machine learning algorithms and make accurate predictions.
8. Big Data : Big Data means working with huge amounts of information that regular computers can’t handle. Data scientists use tools like Apache Hadoop, Spark, and Kafka. These help them store, process, and analyze large datasets. These skills help companies find useful insights and make smart decisions.
9. Data Wrangling : Data wrangling, or data cleaning, fixes messy data. It organizes the data for easy analysis.Scientists remove errors, fill in missing values, and put data into the right format. They use tools like Pandas and NumPy in Python to make the process faster and easier.
10. Math is important for data scientists : It helps them develop and refine models for machine learning and data analysis. Linear algebra, calculus, and probability help us solve tough problems. They also allow us to make accurate predictions using data.
11. Programming Languages : Programming is an essential skill for data scientists. They use languages like Python, R, and SQL to analyze data, build models, and manage databases. These languages help scientists process data efficiently and automate tasks.
12. Python : Python is one of the most popular programming languages for data science. It has useful libraries such as Pandas, NumPy, Scikit-Learn, and TensorFlow. These tools assist with data analysis, machine learning, and AI. Knowing Python allows scientists to build powerful models and find patterns in data
13.Analytics : Analytics means studying data to find useful patterns and trends. Data scientists use math and computer tools to analyze data. This helps them make smart decisions. This helps businesses solve problems and plan for the future.
14.R Programming : R is a computer language used for data analysis and making graphs. It has tools like ggplot2 and dplyr that help scientists organize and visualize data. Learning R allows scientists to study information and present it clearly.
15. Database Management : Data scientists need to store and organize large amounts of information. They use databases such as MySQL, PostgreSQL, and MongoDB. These help them save, find, and manage data efficiently. Good database skills help keep data safe and easy to use.
How to Build Your Data Science Skills
- Formal Education
- Earn a degree in data science, computer science, math, or statistics. This will give you a solid foundation.
- Online Learning & Certifications
- You can learn data science by taking online courses. Check out websites like Coursera, edX, and iCert Global.
- Some good certifications include:
- Google Data Analytics Certificate
- Microsoft Certified Data Scientist
- Certified Data Scientist (CDS)
- Practice with Real Projects
- Work on real-world projects to improve your skills.
- Join competitions like Kaggle to test your knowledge.
- Learn Coding
- Study Python, R, and SQL, which are important for data science.
- Practice coding daily to get better.
How to Become a Data Scientist
- Get the Right Education
- A bachelor’s degree in computer science, math, or data science is helpful.
- A master’s degree or Ph.D. can help you get better job opportunities.
- Develop Key Skills
- Programming: Learn Python, R, and SQL.
- Data Analysis: Study how to work with data and find patterns.
- Machine Learning: Learn tools like TensorFlow and PyTorch.
- Data Visualization: Use tools like Tableau and Power BI to show data clearly.
- Big Data: Get familiar with Hadoop and Spark to work with huge datasets.
How to obtain ARTIFICIAL INTELLIGENCE AND DEEP LEARNING certification?
We are an Education Technology company providing certification training courses to accelerate careers of working professionals worldwide. We impart training through instructor-led classroom workshops, instructor-led live virtual training sessions, and self-paced e-learning courses.
We have successfully conducted training sessions in 108 countries across the globe and enabled thousands of working professionals to enhance the scope of their careers.
Our enterprise training portfolio includes in-demand and globally recognized certification training courses in Project Management, Quality Management, Business Analysis, IT Service Management, Agile and Scrum, Cyber Security, Data Science, and Emerging Technologies. Download our Enterprise Training Catalog from https://www.icertglobal.com/corporate-training-for-enterprises.php and https://www.icertglobal.com/index.php
Popular Courses include:
-
Project Management: PMP, CAPM ,PMI RMP
-
Quality Management: Six Sigma Black Belt ,Lean Six Sigma Green Belt, Lean Management, Minitab,CMMI
-
Business Analysis: CBAP, CCBA, ECBA
-
Agile Training: PMI-ACP , CSM , CSPO
-
Scrum Training: CSM
-
DevOps
-
Program Management: PgMP
-
Cloud Technology: Exin Cloud Computing
-
Citrix Client Adminisration: Citrix Cloud Administration
The 10 top-paying certifications to target in 2025 are:
Conclusion
To stay ahead in 2025, future and current data scientists need to learn many different skills. Check out the top 20+ skills in this article. Skills such as statistical analysis, data visualization, programming, and machine learning will set you up for success. Since the world of data is always changing, it’s important to keep learning. By joining our Data Scientist program, you’ll learn more and get hands-on experience. These courses will teach you the skills you need to become a great data scientist and make a real impact in your job.
Contact Us For More Information:
Visit :www.icertglobal.com Email :
Read More
Why Data Science Skills Matter
Skills are key for career growth, especially in fast-changing fields like data science. As we move toward 2025, the demand for data scientists with strong skills will continue to rise. This article explores 20+ important skills that both new and experienced data scientists need to succeed. We’ll cover all the skills you need. This includes soft skills like problem-solving and communication. It also includes technical skills like programming and machine learning.
Important Skills for Data Scientists
Here are some of the key skills every data scientist should learn:
- Programming Languages: SQL, R, and Python
- Statistical Analysis: Using math and statistics to analyze data
- Machine Learning: Tools like TensorFlow, PyTorch, and Scikit-Learn
- Data Visualization: Creating charts and graphs using Tableau, Power BI, and Matplotlib
- Data Wrangling: Cleaning and organizing messy data
- Big Data: Working with large datasets using Spark and Hadoop
- Database Management: Using MongoDB, PostgreSQL, and MySQL
- Cloud Computing: Working with Google Cloud, Microsoft Azure, and Amazon Web Services (AWS)
- Statistical Software: Tools like SPSS and SAS for data analysis
- Mathematics: Learning calculus, probability, and linear algebra
- Data Mining: Finding useful information in large amounts of data
- Natural Language Processing (NLP): Analyzing and understanding text dat
Essential Technical Skills for Data Scientists
1. Data Visualization : Data visualization helps scientists turn complicated data into easy-to-understand charts and graphs. They use tools such as Tableau, Power BI, Matplotlib, and Seaborn. These tools help them create visuals that highlight key trends and patterns. This helps experts and beginners understand the data better. They can then make smart decisions.
2. Machine Learning : Machine learning allows computers to learn from data and make predictions. Data scientists use tools like TensorFlow, PyTorch, and Scikit-Learn. These help them build models that spot patterns. This way, businesses can make smarter decisions. This skill is useful for things like predicting stock prices, recommending movies, or even detecting fraud.
3. Programming is key for data scientists : It helps them handle data, build models, and automate tasks. Python, R, and SQL are widely used for data analysis, statistics, and managing databases. Good programming skills help data scientists organize big datasets, build custom tools, and improve their work efficiency.
4. Understanding probability and statistics : helps data scientists analyze data and make smart decisions. They apply math ideas like hypothesis testing, regression analysis, and probability distributions. These methods help them spot patterns in data and make predictions about outcomes. These skills help them see if their models are accurate. They can then make reliable conclusions.
5. Deep Learning : Deep learning is a unique kind of machine learning. It helps computers recognize images, understand speech, and process text.
It uses neural networks, which are designed to work like the human brain. Scientists use TensorFlow and PyTorch to create and train these models. Deep learning plays a key role in AI. It helps create self-driving cars and voice assistants.
6. Data scientists : deal with vast amounts of data. They need solid computing skills to process information fast. You need to understand how computers work. This means using parallel processing, which divides tasks into smaller parts. You also need to manage big data with tools like Apache Hadoop and Spark. Good computing skills help data scientists analyze data faster and get accurate results.
7. Mathematical Skills : Math is key for data scientists. It helps them build models, analyze data, and solve problems. They need to understand linear algebra, calculus, and statistics. These skills are used to develop machine learning algorithms and make accurate predictions.
8. Big Data : Big Data means working with huge amounts of information that regular computers can’t handle. Data scientists use tools like Apache Hadoop, Spark, and Kafka. These help them store, process, and analyze large datasets. These skills help companies find useful insights and make smart decisions.
9. Data Wrangling : Data wrangling, or data cleaning, fixes messy data. It organizes the data for easy analysis.Scientists remove errors, fill in missing values, and put data into the right format. They use tools like Pandas and NumPy in Python to make the process faster and easier.
10. Math is important for data scientists : It helps them develop and refine models for machine learning and data analysis. Linear algebra, calculus, and probability help us solve tough problems. They also allow us to make accurate predictions using data.
11. Programming Languages : Programming is an essential skill for data scientists. They use languages like Python, R, and SQL to analyze data, build models, and manage databases. These languages help scientists process data efficiently and automate tasks.
12. Python : Python is one of the most popular programming languages for data science. It has useful libraries such as Pandas, NumPy, Scikit-Learn, and TensorFlow. These tools assist with data analysis, machine learning, and AI. Knowing Python allows scientists to build powerful models and find patterns in data
13.Analytics : Analytics means studying data to find useful patterns and trends. Data scientists use math and computer tools to analyze data. This helps them make smart decisions. This helps businesses solve problems and plan for the future.
14.R Programming : R is a computer language used for data analysis and making graphs. It has tools like ggplot2 and dplyr that help scientists organize and visualize data. Learning R allows scientists to study information and present it clearly.
15. Database Management : Data scientists need to store and organize large amounts of information. They use databases such as MySQL, PostgreSQL, and MongoDB. These help them save, find, and manage data efficiently. Good database skills help keep data safe and easy to use.
How to Build Your Data Science Skills
- Formal Education
- Earn a degree in data science, computer science, math, or statistics. This will give you a solid foundation.
- Online Learning & Certifications
- You can learn data science by taking online courses. Check out websites like Coursera, edX, and iCert Global.
- Some good certifications include:
- Google Data Analytics Certificate
- Microsoft Certified Data Scientist
- Certified Data Scientist (CDS)
- Practice with Real Projects
- Work on real-world projects to improve your skills.
- Join competitions like Kaggle to test your knowledge.
- Learn Coding
- Study Python, R, and SQL, which are important for data science.
- Practice coding daily to get better.
How to Become a Data Scientist
- Get the Right Education
- A bachelor’s degree in computer science, math, or data science is helpful.
- A master’s degree or Ph.D. can help you get better job opportunities.
- Develop Key Skills
- Programming: Learn Python, R, and SQL.
- Data Analysis: Study how to work with data and find patterns.
- Machine Learning: Learn tools like TensorFlow and PyTorch.
- Data Visualization: Use tools like Tableau and Power BI to show data clearly.
- Big Data: Get familiar with Hadoop and Spark to work with huge datasets.
How to obtain ARTIFICIAL INTELLIGENCE AND DEEP LEARNING certification?
We are an Education Technology company providing certification training courses to accelerate careers of working professionals worldwide. We impart training through instructor-led classroom workshops, instructor-led live virtual training sessions, and self-paced e-learning courses.
We have successfully conducted training sessions in 108 countries across the globe and enabled thousands of working professionals to enhance the scope of their careers.
Our enterprise training portfolio includes in-demand and globally recognized certification training courses in Project Management, Quality Management, Business Analysis, IT Service Management, Agile and Scrum, Cyber Security, Data Science, and Emerging Technologies. Download our Enterprise Training Catalog from https://www.icertglobal.com/corporate-training-for-enterprises.php and https://www.icertglobal.com/index.php
Popular Courses include:
-
Project Management: PMP, CAPM ,PMI RMP
-
Quality Management: Six Sigma Black Belt ,Lean Six Sigma Green Belt, Lean Management, Minitab,CMMI
-
Business Analysis: CBAP, CCBA, ECBA
-
Agile Training: PMI-ACP , CSM , CSPO
-
Scrum Training: CSM
-
DevOps
-
Program Management: PgMP
-
Cloud Technology: Exin Cloud Computing
-
Citrix Client Adminisration: Citrix Cloud Administration
The 10 top-paying certifications to target in 2025 are:
Conclusion
To stay ahead in 2025, future and current data scientists need to learn many different skills. Check out the top 20+ skills in this article. Skills such as statistical analysis, data visualization, programming, and machine learning will set you up for success. Since the world of data is always changing, it’s important to keep learning. By joining our Data Scientist program, you’ll learn more and get hands-on experience. These courses will teach you the skills you need to become a great data scientist and make a real impact in your job.
Contact Us For More Information:
Visit :www.icertglobal.com Email :

Must-Know Essential Data Science Facts for Career Growth
Growing Data and Its Impact With more internet users, data is being created at a rapid pace. Technology improvements are fueling this surge.
This increase is pushing companies to find new ways to use the data to make smarter decisions.
Websites such as eBay, Amazon, YouTube, and Netflix suggest products or shows you may enjoy. They do this by looking at your preferences. They do this by analyzing data like what you’ve searched for or watched before. This is where data science comes in.
Data science became popular in 2008, and since then, it has grown into a major field. It helps companies of all sizes find patterns in data. This lets them explore new markets, save money, work better, and stay ahead of competitors.
This guide shares key facts and stats about data science. Every future data scientist should know these by 2025.
What Is Data Science?
Data science studies large data sets. It uses scientific methods and tools to find useful information. It includes analyzing both organized (structured) data and messy (unstructured) data.
The data science process includes important tasks:
- Gathering data
- Cleaning it
- Processing the data
- Grouping similar entries
- Developing models for predictions
- Summarizing what was found
These tasks help ensure thorough analysis.
After discovering insights, data scientists continue their work. They explore the data further, apply statistical methods, and create visual charts. These charts help explain their findings to others.
Data Science Facts – Data Sources Every day, we create a huge amount of data. More people use mobile devices now. Internet access is better. Also, online shopping apps are popular.Data science organizes and studies information. This helps businesses make better decisions and grow.
Here are some important facts about data sources:
- About 70% of all data is created by users, such as the pictures, videos, and text shared on the internet. This is called user-generated content.
- 1.145 trillion megabytes of data are produced every day.
- In 2021, there were around 79 Zettabytes of data created, used, and stored globally.
- Around 91% of the data used in data science is text. Other types of data include 33% images, 15% video, and 11% audio.
- 90% of the data in the world is a copy (replicated data), while 10% is unique data.
- Between 80% to 90% of data worldwide is unstructured, meaning it's messy and hard to organize.
- The average internet user would need 181 million years to download all the data on the internet.
- In 2020, about two new professionals joined LinkedIn every second.
- The U.S. had 2,670 data centers in 2021, the most in the world.
- In 2020, each person created about 2.5 quintillion bytes of data every day.
Benefits of Data Science in 2024
Data science helps businesses in many ways. Here's how:
- 72% of manufacturing companies use advanced data analysis to increase productivity.
- By 2025, the healthcare data market could be worth $67.82 billion.
- In 2019, about 68% of international travel companies invested in data analysis tools. They aimed to improve their business.
- By 2024, the big data analytics market is expected to be worth $103 billion.
- Over 1,400 universities use data science. This helps improve graduation rates and lets students finish school faster.
- 95% of businesses struggle with managing messy (unstructured) data.
- Nearly 47% of people in a McKinsey survey think data science helps businesses succeed.
Fun Facts:
- 65 billion messages are sent daily on WhatsApp.
- Netflix saves $1 billion each year by using data science to keep customers.
Data Science Facts: Popular Programming Languages for Data Science
Technology is advancing quickly. AI, Machine Learning, and Data Science rely on strong algorithms to power smart models. To understand how these programs work, it's important to know how to code. Many programming languages are used for data science, but some are more popular.
Anaconda, a software company, says that 75% of data scientists often use Python in their work. Python is the most widely used language in data science, and it is expected to remain popular in the future.
Other languages commonly used by data scientists include:
- 36% prefer using R for data science tasks (according to a survey by Kaggle, a Google company).
- 15% of data scientists use JavaScript.
- 10% use Java.
- 9% rely on C/C++.
- 4% use C#.
Data Science Facts in 2024: Jobs and Salaries
Data science jobs are growing fast and pay well. Let’s take a look at some interesting facts about salaries and job opportunities in data science:
- In the United States, a Data Scientist earns an average salary of $117,212 per year. This figure comes from 18,000 salaries reported on Glassdoor.
- Each year, a data scientist’s salary can go up by about $2,000-$2,500.
- If you’re just starting out in data science, the average salary is around $85,000.
- A Data Scientist with 1-4 years of experience can earn about $96,000. If they have 5-9 years, that number rises to around $110,000.
- By 2026, it’s expected that there will be 11.5 million data science jobs!
Data Science Facts for the Future
Looking ahead, here are some exciting data science facts about the future:
- By 2024, 66% of people on Earth will be connected to the internet.
- By 2025, there will be 75 billion Internet of Things (IoT) devices, which is almost three times as many as in 2020.
- Data scientists will earn between $65,000 and $153,000 per year in the future.
- By 2024, there will be 3 times as many devices connected to the internet as there are people in the world!
- By 2024, there will be 149 zettabytes of data (that’s a huge amount) collected and stored. This is a lot more than the 2 zettabytes created in 2010.
- By 2026, the market for data science tools is expected to be worth $322.9 billion.
Become a Data Science Professional with iCert Global
If these facts excite you and you want to become a data science expert, we can help! We offer detailed courses to help you get started in this field. Check out our top programs and find the one that works best for you!
How to obtain Data Science certification?
We are an Education Technology company providing certification training courses to accelerate careers of working professionals worldwide. We impart training through instructor-led classroom workshops, instructor-led live virtual training sessions, and self-paced e-learning courses.
We have successfully conducted training sessions in 108 countries across the globe and enabled thousands of working professionals to enhance the scope of their careers.
Our enterprise training portfolio includes in-demand and globally recognized certification training courses in Project Management, Quality Management, Business Analysis, IT Service Management, Agile and Scrum, Cyber Security, Data Science, and Emerging Technologies. Download our Enterprise Training Catalog from https://www.icertglobal.com/corporate-training-for-enterprises.php and https://www.icertglobal.com/index.php
Popular Courses include:
-
Project Management: PMP, CAPM ,PMI RMP
-
Quality Management: Six Sigma Black Belt ,Lean Six Sigma Green Belt, Lean Management, Minitab,CMMI
-
Business Analysis: CBAP, CCBA, ECBA
-
Agile Training: PMI-ACP , CSM , CSPO
-
Scrum Training: CSM
-
DevOps
-
Program Management: PgMP
-
Cloud Technology: Exin Cloud Computing
-
Citrix Client Adminisration: Citrix Cloud Administration
The 10 top-paying certifications to target in 2025 are:
Conclusion
Many fresh graduates believe they can't begin a career in data science. They think this happens because their university courses didn’t cover key topics, like big data analytics. Some seasoned professionals also feel unready. They didn’t get to update their skills. Not developing skills means they miss the hands-on experience employers want. If you're interested in data science and feel this way, iCert Gloabl can assist you.
Contact Us For More Information:
Visit :www.icertglobal.com Email :
Read More
Growing Data and Its Impact With more internet users, data is being created at a rapid pace. Technology improvements are fueling this surge.
This increase is pushing companies to find new ways to use the data to make smarter decisions.
Websites such as eBay, Amazon, YouTube, and Netflix suggest products or shows you may enjoy. They do this by looking at your preferences. They do this by analyzing data like what you’ve searched for or watched before. This is where data science comes in.
Data science became popular in 2008, and since then, it has grown into a major field. It helps companies of all sizes find patterns in data. This lets them explore new markets, save money, work better, and stay ahead of competitors.
This guide shares key facts and stats about data science. Every future data scientist should know these by 2025.
What Is Data Science?
Data science studies large data sets. It uses scientific methods and tools to find useful information. It includes analyzing both organized (structured) data and messy (unstructured) data.
The data science process includes important tasks:
- Gathering data
- Cleaning it
- Processing the data
- Grouping similar entries
- Developing models for predictions
- Summarizing what was found
These tasks help ensure thorough analysis.
After discovering insights, data scientists continue their work. They explore the data further, apply statistical methods, and create visual charts. These charts help explain their findings to others.
Data Science Facts – Data Sources Every day, we create a huge amount of data. More people use mobile devices now. Internet access is better. Also, online shopping apps are popular.Data science organizes and studies information. This helps businesses make better decisions and grow.
Here are some important facts about data sources:
- About 70% of all data is created by users, such as the pictures, videos, and text shared on the internet. This is called user-generated content.
- 1.145 trillion megabytes of data are produced every day.
- In 2021, there were around 79 Zettabytes of data created, used, and stored globally.
- Around 91% of the data used in data science is text. Other types of data include 33% images, 15% video, and 11% audio.
- 90% of the data in the world is a copy (replicated data), while 10% is unique data.
- Between 80% to 90% of data worldwide is unstructured, meaning it's messy and hard to organize.
- The average internet user would need 181 million years to download all the data on the internet.
- In 2020, about two new professionals joined LinkedIn every second.
- The U.S. had 2,670 data centers in 2021, the most in the world.
- In 2020, each person created about 2.5 quintillion bytes of data every day.
Benefits of Data Science in 2024
Data science helps businesses in many ways. Here's how:
- 72% of manufacturing companies use advanced data analysis to increase productivity.
- By 2025, the healthcare data market could be worth $67.82 billion.
- In 2019, about 68% of international travel companies invested in data analysis tools. They aimed to improve their business.
- By 2024, the big data analytics market is expected to be worth $103 billion.
- Over 1,400 universities use data science. This helps improve graduation rates and lets students finish school faster.
- 95% of businesses struggle with managing messy (unstructured) data.
- Nearly 47% of people in a McKinsey survey think data science helps businesses succeed.
Fun Facts:
- 65 billion messages are sent daily on WhatsApp.
- Netflix saves $1 billion each year by using data science to keep customers.
Data Science Facts: Popular Programming Languages for Data Science
Technology is advancing quickly. AI, Machine Learning, and Data Science rely on strong algorithms to power smart models. To understand how these programs work, it's important to know how to code. Many programming languages are used for data science, but some are more popular.
Anaconda, a software company, says that 75% of data scientists often use Python in their work. Python is the most widely used language in data science, and it is expected to remain popular in the future.
Other languages commonly used by data scientists include:
- 36% prefer using R for data science tasks (according to a survey by Kaggle, a Google company).
- 15% of data scientists use JavaScript.
- 10% use Java.
- 9% rely on C/C++.
- 4% use C#.
Data Science Facts in 2024: Jobs and Salaries
Data science jobs are growing fast and pay well. Let’s take a look at some interesting facts about salaries and job opportunities in data science:
- In the United States, a Data Scientist earns an average salary of $117,212 per year. This figure comes from 18,000 salaries reported on Glassdoor.
- Each year, a data scientist’s salary can go up by about $2,000-$2,500.
- If you’re just starting out in data science, the average salary is around $85,000.
- A Data Scientist with 1-4 years of experience can earn about $96,000. If they have 5-9 years, that number rises to around $110,000.
- By 2026, it’s expected that there will be 11.5 million data science jobs!
Data Science Facts for the Future
Looking ahead, here are some exciting data science facts about the future:
- By 2024, 66% of people on Earth will be connected to the internet.
- By 2025, there will be 75 billion Internet of Things (IoT) devices, which is almost three times as many as in 2020.
- Data scientists will earn between $65,000 and $153,000 per year in the future.
- By 2024, there will be 3 times as many devices connected to the internet as there are people in the world!
- By 2024, there will be 149 zettabytes of data (that’s a huge amount) collected and stored. This is a lot more than the 2 zettabytes created in 2010.
- By 2026, the market for data science tools is expected to be worth $322.9 billion.
Become a Data Science Professional with iCert Global
If these facts excite you and you want to become a data science expert, we can help! We offer detailed courses to help you get started in this field. Check out our top programs and find the one that works best for you!
How to obtain Data Science certification?
We are an Education Technology company providing certification training courses to accelerate careers of working professionals worldwide. We impart training through instructor-led classroom workshops, instructor-led live virtual training sessions, and self-paced e-learning courses.
We have successfully conducted training sessions in 108 countries across the globe and enabled thousands of working professionals to enhance the scope of their careers.
Our enterprise training portfolio includes in-demand and globally recognized certification training courses in Project Management, Quality Management, Business Analysis, IT Service Management, Agile and Scrum, Cyber Security, Data Science, and Emerging Technologies. Download our Enterprise Training Catalog from https://www.icertglobal.com/corporate-training-for-enterprises.php and https://www.icertglobal.com/index.php
Popular Courses include:
-
Project Management: PMP, CAPM ,PMI RMP
-
Quality Management: Six Sigma Black Belt ,Lean Six Sigma Green Belt, Lean Management, Minitab,CMMI
-
Business Analysis: CBAP, CCBA, ECBA
-
Agile Training: PMI-ACP , CSM , CSPO
-
Scrum Training: CSM
-
DevOps
-
Program Management: PgMP
-
Cloud Technology: Exin Cloud Computing
-
Citrix Client Adminisration: Citrix Cloud Administration
The 10 top-paying certifications to target in 2025 are:
Conclusion
Many fresh graduates believe they can't begin a career in data science. They think this happens because their university courses didn’t cover key topics, like big data analytics. Some seasoned professionals also feel unready. They didn’t get to update their skills. Not developing skills means they miss the hands-on experience employers want. If you're interested in data science and feel this way, iCert Gloabl can assist you.
Contact Us For More Information:
Visit :www.icertglobal.com Email :
.webp)
Apache Spark Performance: Scala vs Python Comparison!!!
What is Scala?
Scala stands for “scalable language.” It's a strong, user-friendly programming language that combines functional and object-oriented styles. It runs on the Java Virtual Machine (JVM), meaning it can work with Java programs and tools.
Many programmers like Scala because it is clear, short, and has fewer errors. This makes it easy to write, test, and fix programs. Scala's creators claim its strong typing system prevents mistakes in large projects. It runs on JVM and JavaScript, enabling programmers to create fast, efficient software.
What is Python?
Python is a simple and flexible programming language. It is a high-level, interpreted language. This means it runs directly without needing compilation first. Python simplifies coding. Its clear structure helps connect different parts of a program.
Many programmers choose Python because it is easy to learn, has many useful tools, and is free to use. Its simplicity and flexibility make it popular among beginners and experts alike.
What is Apache Spark?
Apache Spark is a powerful tool used to process large amounts of data quickly. It helps businesses and developers analyze and manage data. This includes tasks like machine learning, big data projects, and complex calculations.
Spark is fast. It can manage large amounts of data by dividing tasks among many computers. Spark competes with Hadoop, but it's gaining popularity. This is because Spark is faster and easier to use. Many companies choose Spark. It supports various programming languages, such as Java, R, Python, and Scala.
What is Scala Used For?
Scala can be used for almost everything that Java can do.
It’s great for:
- Building websites
- Writing scripts
- Developing software
- Handling large data sets
Many programmers like Scala. It combines different programming styles. This makes it great for big data processing, cloud computing, and automation.
Some well-known companies using Scala include:
- 9GAG
- Asana
- Groupon
- LinkedIn
- Reddit
- Twitter
What is Python Used For?
Python is straightforward to learn. It’s ideal for creating websites, applications, and artificial intelligence (AI). Because its code looks similar to English, many beginners find it easy to understand.
Python is popular in machine learning and AI. It helps computers learn and make decisions independently. Many big companies and organizations use Python, including:
- Dropbox
- Instagram
- NASA
- Netflix
- Spotify
- Uber
Why Learn Scala for Spark?
Now that we know about Spark and Scala, let’s explore why learning Scala for Spark is a great choice. Spark supports multiple programming languages, but Scala stands out. Here are five strong reasons to learn Scala:
1. Spark is Built with Scala
Spark was originally written in Scala. So, using Scala lets developers access its core features directly. Scala also runs smoothly on the Java Virtual Machine (JVM), making it powerful and scalable.
2. Scala is Simpler than Java
One line of Scala code can replace 20 to 25 lines of Java! This makes Scala a great choice for handling big data. Plus, Scala and Java work well together, allowing developers to use Java tools with Scala code.
3. Easy to Learn, Powerful to Use
Scala finds a perfect balance between being easy to learn and highly efficient. Beginners can quickly start using Scala and enjoy its advanced features.
4. Many Big Companies Use Scala
Scala is popular in big companies. It is also growing in fields like finance and banking. More companies are choosing Scala because it helps build fast and efficient applications.
5. Perfect for Complex Calculations
Scala is designed to handle multiple tasks at the same time (parallel computing). It pairs nicely with frameworks such as Akka, Lift, and Play. This makes it perfect for building high-performance applications.
By learning Scala, you can unlock the full potential of Spark and become a skilled big data developer!
Which Language is Better: Scala or Python?
The best way to decide between Scala and Python is to compare their key features. Let’s break it down:
1. Definition
- Scala is an object-oriented language where you must define variables and object types.
- Python is also object-oriented, but you don’t need to specify variables.
2. Speed
- Scala is about 10 times faster than Python because of its efficient way of handling data.
3. Ease of Use
- Python is easier to learn and use, making it a favorite among beginners.
- Scala is a bit trickier but still simple enough to learn.
4. Handling Multiple Tasks
- Scala is great for handling multiple tasks at the same time.
- Python doesn’t support true multi-threading, making it less efficient for large-scale projects.
5. Learning Difficulty
- Scala is more complex to learn.
- Python has a simple structure, making it easier to pick up quickly.
6. Safety
- Scala is a statically-typed language, meaning it prevents errors early.
- Python is dynamically typed, which can lead to more mistakes in big projects.
7. Community Support
- Python has a larger community and more helpful libraries.
- Scala has a strong but smaller community.
8. Project Size
- Python is better for small projects.
- Scala is better for large projects that require speed and efficiency.
Final Answer: Which One is Better?
It depends on what you need!
- For small projects or beginners, Python is a great choice.
- For large, complex projects that require powerful processing, Scala is the better option.
Want to Learn More About Big Data?
Big Data is an exciting field that uses programming languages like Scala and Python. To boost your skills, try online courses, tutorials, and practice tests. These resources can help you improve in Spark, Scala, and Python. Big Data professionals are in high demand. Learning these skills can lead to great career opportunities.
How to obtain Apache Spark certification?
We are an Education Technology company providing certification training courses to accelerate careers of working professionals worldwide. We impart training through instructor-led classroom workshops, instructor-led live virtual training sessions, and self-paced e-learning courses.
We have successfully conducted training sessions in 108 countries across the globe and enabled thousands of working professionals to enhance the scope of their careers.
Our enterprise training portfolio includes in-demand and globally recognized certification training courses in Project Management, Quality Management, Business Analysis, IT Service Management, Agile and Scrum, Cyber Security, Data Science, and Emerging Technologies. Download our Enterprise Training Catalog from https://www.icertglobal.com/corporate-training-for-enterprises.php and https://www.icertglobal.com/index.php
Popular Courses include:
-
Project Management: PMP, CAPM ,PMI RMP
-
Quality Management: Six Sigma Black Belt ,Lean Six Sigma Green Belt, Lean Management, Minitab,CMMI
-
Business Analysis: CBAP, CCBA, ECBA
-
Agile Training: PMI-ACP , CSM , CSPO
-
Scrum Training: CSM
-
DevOps
-
Program Management: PgMP
-
Cloud Technology: Exin Cloud Computing
-
Citrix Client Adminisration: Citrix Cloud Administration
The 10 top-paying certifications to target in 2025 are:
Conclusion:
Scala or Python – Which Should You Choose?
Both Scala and Python have their strengths, and the best choice depends on your goals.
- Choose Python if you’re a beginner. It’s great for small projects. It’s also a simple language for data science, web development, and AI.
- Choose Scala for Big Data, fast processing, or scalable solutions for large apps.
Learning Scala can give you an edge if you're interested in Apache Spark. This is because Spark was built with Scala. However, Python remains a solid choice for its simplicity and vast ecosystem.
Whichever language you choose, mastering Big Data tools will open exciting career opportunities. Keep learning and exploring!
Contact Us For More Information:
Visit :www.icertglobal.com Email :
Read More
What is Scala?
Scala stands for “scalable language.” It's a strong, user-friendly programming language that combines functional and object-oriented styles. It runs on the Java Virtual Machine (JVM), meaning it can work with Java programs and tools.
Many programmers like Scala because it is clear, short, and has fewer errors. This makes it easy to write, test, and fix programs. Scala's creators claim its strong typing system prevents mistakes in large projects. It runs on JVM and JavaScript, enabling programmers to create fast, efficient software.
What is Python?
Python is a simple and flexible programming language. It is a high-level, interpreted language. This means it runs directly without needing compilation first. Python simplifies coding. Its clear structure helps connect different parts of a program.
Many programmers choose Python because it is easy to learn, has many useful tools, and is free to use. Its simplicity and flexibility make it popular among beginners and experts alike.
What is Apache Spark?
Apache Spark is a powerful tool used to process large amounts of data quickly. It helps businesses and developers analyze and manage data. This includes tasks like machine learning, big data projects, and complex calculations.
Spark is fast. It can manage large amounts of data by dividing tasks among many computers. Spark competes with Hadoop, but it's gaining popularity. This is because Spark is faster and easier to use. Many companies choose Spark. It supports various programming languages, such as Java, R, Python, and Scala.
What is Scala Used For?
Scala can be used for almost everything that Java can do.
It’s great for:
- Building websites
- Writing scripts
- Developing software
- Handling large data sets
Many programmers like Scala. It combines different programming styles. This makes it great for big data processing, cloud computing, and automation.
Some well-known companies using Scala include:
- 9GAG
- Asana
- Groupon
What is Python Used For?
Python is straightforward to learn. It’s ideal for creating websites, applications, and artificial intelligence (AI). Because its code looks similar to English, many beginners find it easy to understand.
Python is popular in machine learning and AI. It helps computers learn and make decisions independently. Many big companies and organizations use Python, including:
- Dropbox
- NASA
- Netflix
- Spotify
- Uber
Why Learn Scala for Spark?
Now that we know about Spark and Scala, let’s explore why learning Scala for Spark is a great choice. Spark supports multiple programming languages, but Scala stands out. Here are five strong reasons to learn Scala:
1. Spark is Built with Scala
Spark was originally written in Scala. So, using Scala lets developers access its core features directly. Scala also runs smoothly on the Java Virtual Machine (JVM), making it powerful and scalable.
2. Scala is Simpler than Java
One line of Scala code can replace 20 to 25 lines of Java! This makes Scala a great choice for handling big data. Plus, Scala and Java work well together, allowing developers to use Java tools with Scala code.
3. Easy to Learn, Powerful to Use
Scala finds a perfect balance between being easy to learn and highly efficient. Beginners can quickly start using Scala and enjoy its advanced features.
4. Many Big Companies Use Scala
Scala is popular in big companies. It is also growing in fields like finance and banking. More companies are choosing Scala because it helps build fast and efficient applications.
5. Perfect for Complex Calculations
Scala is designed to handle multiple tasks at the same time (parallel computing). It pairs nicely with frameworks such as Akka, Lift, and Play. This makes it perfect for building high-performance applications.
By learning Scala, you can unlock the full potential of Spark and become a skilled big data developer!
Which Language is Better: Scala or Python?
The best way to decide between Scala and Python is to compare their key features. Let’s break it down:
1. Definition
- Scala is an object-oriented language where you must define variables and object types.
- Python is also object-oriented, but you don’t need to specify variables.
2. Speed
- Scala is about 10 times faster than Python because of its efficient way of handling data.
3. Ease of Use
- Python is easier to learn and use, making it a favorite among beginners.
- Scala is a bit trickier but still simple enough to learn.
4. Handling Multiple Tasks
- Scala is great for handling multiple tasks at the same time.
- Python doesn’t support true multi-threading, making it less efficient for large-scale projects.
5. Learning Difficulty
- Scala is more complex to learn.
- Python has a simple structure, making it easier to pick up quickly.
6. Safety
- Scala is a statically-typed language, meaning it prevents errors early.
- Python is dynamically typed, which can lead to more mistakes in big projects.
7. Community Support
- Python has a larger community and more helpful libraries.
- Scala has a strong but smaller community.
8. Project Size
- Python is better for small projects.
- Scala is better for large projects that require speed and efficiency.
Final Answer: Which One is Better?
It depends on what you need!
- For small projects or beginners, Python is a great choice.
- For large, complex projects that require powerful processing, Scala is the better option.
Want to Learn More About Big Data?
Big Data is an exciting field that uses programming languages like Scala and Python. To boost your skills, try online courses, tutorials, and practice tests. These resources can help you improve in Spark, Scala, and Python. Big Data professionals are in high demand. Learning these skills can lead to great career opportunities.
How to obtain Apache Spark certification?
We are an Education Technology company providing certification training courses to accelerate careers of working professionals worldwide. We impart training through instructor-led classroom workshops, instructor-led live virtual training sessions, and self-paced e-learning courses.
We have successfully conducted training sessions in 108 countries across the globe and enabled thousands of working professionals to enhance the scope of their careers.
Our enterprise training portfolio includes in-demand and globally recognized certification training courses in Project Management, Quality Management, Business Analysis, IT Service Management, Agile and Scrum, Cyber Security, Data Science, and Emerging Technologies. Download our Enterprise Training Catalog from https://www.icertglobal.com/corporate-training-for-enterprises.php and https://www.icertglobal.com/index.php
Popular Courses include:
-
Project Management: PMP, CAPM ,PMI RMP
-
Quality Management: Six Sigma Black Belt ,Lean Six Sigma Green Belt, Lean Management, Minitab,CMMI
-
Business Analysis: CBAP, CCBA, ECBA
-
Agile Training: PMI-ACP , CSM , CSPO
-
Scrum Training: CSM
-
DevOps
-
Program Management: PgMP
-
Cloud Technology: Exin Cloud Computing
-
Citrix Client Adminisration: Citrix Cloud Administration
The 10 top-paying certifications to target in 2025 are:
Conclusion:
Scala or Python – Which Should You Choose?
Both Scala and Python have their strengths, and the best choice depends on your goals.
- Choose Python if you’re a beginner. It’s great for small projects. It’s also a simple language for data science, web development, and AI.
- Choose Scala for Big Data, fast processing, or scalable solutions for large apps.
Learning Scala can give you an edge if you're interested in Apache Spark. This is because Spark was built with Scala. However, Python remains a solid choice for its simplicity and vast ecosystem.
Whichever language you choose, mastering Big Data tools will open exciting career opportunities. Keep learning and exploring!
Contact Us For More Information:
Visit :www.icertglobal.com Email :
.webp)
The Power of Data Unlocking Meaning, Uses and future blog
Since computers were made, people have used the word 'data.' It means information that computers can send or save. But that’s not the only meaning of data—there are other kinds too. So, what is data? Data can be words or numbers on paper. It can also be bits of information on electronic devices or facts in someone's mind. What is data?
What is Data?
Since computers were invented, people have called computer information "data." This data can be shared or saved. But data isn’t just about computers—there are other kinds too. So, what is data? It can be words or numbers on paper, small digital bits in devices, or facts stored in someone's mind.
Data comes in different forms and is usually arranged in a specific way. Software is divided into two main parts:
· Data Processing Software: This type of software helps to manage, transform, and analyze data. It processes raw data into useful information by organizing, cleaning, and performing calculations or transformations. Examples include database management systems (DBMS) like MySQL, and programming languages like Python or R that are used for data manipulation and analysis.
· Data Visualization Software: This software helps present data in a graphical format, such as charts, graphs, and dashboards, making it easier to understand trends and patterns. Examples include tools like Tableau, Power BI, and Google Data Studio.
Data is different types of information, usually arranged in a certain way. All software is divided into two main parts: programs and data. Now that we know what data is, programs are sets of instructions that help process and change data.
We use data science to make working with data easier. Data science brings together math, computer programming, and specialized knowledge. It examines data to uncover useful patterns. These patterns can then be applied in many areas. It helps us use organized and unorganized data for different purposes.
Now that we know a little more about data and data science, let’s look at some interesting facts. But first, what do we mean by "information?" Let’s take a step back and understand the basics.
What is Information?
Information is data that has been sorted or arranged in a way that makes sense and is useful. It is processed data that helps people make decisions and take action. For information to be useful, it must meet these conditions:
- Accuracy: The information must be correct.
- Completeness: The information must have all the needed details.
- Timeliness: The information must be available when needed.
Types and Uses of Data
Technology, especially smartphones, has changed our idea of data. Now, it includes text, videos, audio, and even activity from websites and apps. Most of this data is unorganized.
The term Big Data refers to huge amounts of data, often measured in petabytes or more. It is described using 5Vs:
- Variety – Different types of data
- Volume – Large amounts of data
- Value – Useful information
- Veracity – Data accuracy
- Velocity – The speed at which data is created and processed
Today, online businesses use Big Data. It helps them work better, cut costs, and boost sales. Industries like healthcare, marketing, and finance use data differently.
How is Data Stored?
Computers store data as binary values using only the numbers 1 and 0. The smallest unit of data is called a bit, while a byte is made of eight bits. Storage sizes include megabytes (MB), gigabytes (GB), terabytes (TB), and petabytes (PB). The world is creating more data every day. Because of this, we need new and bigger units of measurement.
Data can be stored in files, databases, and cloud systems. As time passed, new methods for organizing and managing data emerged. One example is relational databases. They help businesses and organizations track large amounts of information efficiently.
The world of data, data processing, and data science is huge! We mentioned just five jobs, but there are many more. For example, you could become a Data Engineer or a Data Security Administrator. Data Science and Business Analytics offer exciting opportunities. Explore them today with iCert Global and plan your future in data!
Data is at the core of everything in today’s digital world. It is no longer just numbers stored in a computer but includes text, images, videos, and even user activity. Technology has quickly changed, especially with smartphones and the internet. Now, we create, store, and analyze data in new ways. Big Data helps businesses and organizations handle large amounts of information. This allows them to make better decisions, improve efficiency, and boost customer experiences.
Top 5 Careers in Data:
Listed below are some job roles that are very popular and needed by many company
1.Data Scientist : This career is very popular right now, as noted before.
2.Business Intelligence Analyst (BIA) Business Intelligence Analysts help companies make smart choices. They study data and provide useful suggestions.
3. Database Developer : The third job on the list is "Database Developer." These experts work on bettering databases. They also create new programs to manage data more effectively.
4.Database Administrator : A Database Administrator sets up, manages, and protects databases. They ensure everything runs smoothly.
5. Data Analytics Manager : More businesses rely on Data Managers. They help find key information in large data sets.
How to obtain Data Science certification?
We are an Education Technology company providing certification training courses to accelerate careers of working professionals worldwide. We impart training through instructor-led classroom workshops, instructor-led live virtual training sessions, and self-paced e-learning courses.
We have successfully conducted training sessions in 108 countries across the globe and enabled thousands of working professionals to enhance the scope of their careers.
Our enterprise training portfolio includes in-demand and globally recognized certification training courses in Project Management, Quality Management, Business Analysis, IT Service Management, Agile and Scrum, Cyber Security, Data Science, and Emerging Technologies. Download our Enterprise Training Catalog from https://www.icertglobal.com/corporate-training-for-enterprises.php and https://www.icertglobal.com/index.php
Popular Courses include:
-
Project Management: PMP, CAPM ,PMI RMP
-
Quality Management: Six Sigma Black Belt ,Lean Six Sigma Green Belt, Lean Management, Minitab,CMMI
-
Business Analysis: CBAP, CCBA, ECBA
-
Agile Training: PMI-ACP , CSM , CSPO
-
Scrum Training: CSM
-
DevOps
-
Program Management: PgMP
-
Cloud Technology: Exin Cloud Computing
-
Citrix Client Adminisration: Citrix Cloud Administration
The 10 top-paying certifications to target in 2025 are:
Conclusion
Advancements in data storage have created better and safer ways to manage information. Businesses now have scalable solutions, from traditional databases to cloud computing. These solutions help them manage the rapid growth of data. As technology changes, our ways of managing and understanding data will change too. This will make data even more useful for decision-making and innovation.Data is not just numbers; it's a strong resource that fuels progress in many industries. Data collection, processing, and analysis are key for businesses, research, and daily life.
Contact Us For More Information:
Visit :www.icertglobal.com Email :
Read More
Since computers were made, people have used the word 'data.' It means information that computers can send or save. But that’s not the only meaning of data—there are other kinds too. So, what is data? Data can be words or numbers on paper. It can also be bits of information on electronic devices or facts in someone's mind. What is data?
What is Data?
Since computers were invented, people have called computer information "data." This data can be shared or saved. But data isn’t just about computers—there are other kinds too. So, what is data? It can be words or numbers on paper, small digital bits in devices, or facts stored in someone's mind.
Data comes in different forms and is usually arranged in a specific way. Software is divided into two main parts:
· Data Processing Software: This type of software helps to manage, transform, and analyze data. It processes raw data into useful information by organizing, cleaning, and performing calculations or transformations. Examples include database management systems (DBMS) like MySQL, and programming languages like Python or R that are used for data manipulation and analysis.
· Data Visualization Software: This software helps present data in a graphical format, such as charts, graphs, and dashboards, making it easier to understand trends and patterns. Examples include tools like Tableau, Power BI, and Google Data Studio.
Data is different types of information, usually arranged in a certain way. All software is divided into two main parts: programs and data. Now that we know what data is, programs are sets of instructions that help process and change data.
We use data science to make working with data easier. Data science brings together math, computer programming, and specialized knowledge. It examines data to uncover useful patterns. These patterns can then be applied in many areas. It helps us use organized and unorganized data for different purposes.
Now that we know a little more about data and data science, let’s look at some interesting facts. But first, what do we mean by "information?" Let’s take a step back and understand the basics.
What is Information?
Information is data that has been sorted or arranged in a way that makes sense and is useful. It is processed data that helps people make decisions and take action. For information to be useful, it must meet these conditions:
- Accuracy: The information must be correct.
- Completeness: The information must have all the needed details.
- Timeliness: The information must be available when needed.
Types and Uses of Data
Technology, especially smartphones, has changed our idea of data. Now, it includes text, videos, audio, and even activity from websites and apps. Most of this data is unorganized.
The term Big Data refers to huge amounts of data, often measured in petabytes or more. It is described using 5Vs:
- Variety – Different types of data
- Volume – Large amounts of data
- Value – Useful information
- Veracity – Data accuracy
- Velocity – The speed at which data is created and processed
Today, online businesses use Big Data. It helps them work better, cut costs, and boost sales. Industries like healthcare, marketing, and finance use data differently.
How is Data Stored?
Computers store data as binary values using only the numbers 1 and 0. The smallest unit of data is called a bit, while a byte is made of eight bits. Storage sizes include megabytes (MB), gigabytes (GB), terabytes (TB), and petabytes (PB). The world is creating more data every day. Because of this, we need new and bigger units of measurement.
Data can be stored in files, databases, and cloud systems. As time passed, new methods for organizing and managing data emerged. One example is relational databases. They help businesses and organizations track large amounts of information efficiently.
The world of data, data processing, and data science is huge! We mentioned just five jobs, but there are many more. For example, you could become a Data Engineer or a Data Security Administrator. Data Science and Business Analytics offer exciting opportunities. Explore them today with iCert Global and plan your future in data!
Data is at the core of everything in today’s digital world. It is no longer just numbers stored in a computer but includes text, images, videos, and even user activity. Technology has quickly changed, especially with smartphones and the internet. Now, we create, store, and analyze data in new ways. Big Data helps businesses and organizations handle large amounts of information. This allows them to make better decisions, improve efficiency, and boost customer experiences.
Top 5 Careers in Data:
Listed below are some job roles that are very popular and needed by many company
1.Data Scientist : This career is very popular right now, as noted before.
2.Business Intelligence Analyst (BIA) Business Intelligence Analysts help companies make smart choices. They study data and provide useful suggestions.
3. Database Developer : The third job on the list is "Database Developer." These experts work on bettering databases. They also create new programs to manage data more effectively.
4.Database Administrator : A Database Administrator sets up, manages, and protects databases. They ensure everything runs smoothly.
5. Data Analytics Manager : More businesses rely on Data Managers. They help find key information in large data sets.
How to obtain Data Science certification?
We are an Education Technology company providing certification training courses to accelerate careers of working professionals worldwide. We impart training through instructor-led classroom workshops, instructor-led live virtual training sessions, and self-paced e-learning courses.
We have successfully conducted training sessions in 108 countries across the globe and enabled thousands of working professionals to enhance the scope of their careers.
Our enterprise training portfolio includes in-demand and globally recognized certification training courses in Project Management, Quality Management, Business Analysis, IT Service Management, Agile and Scrum, Cyber Security, Data Science, and Emerging Technologies. Download our Enterprise Training Catalog from https://www.icertglobal.com/corporate-training-for-enterprises.php and https://www.icertglobal.com/index.php
Popular Courses include:
-
Project Management: PMP, CAPM ,PMI RMP
-
Quality Management: Six Sigma Black Belt ,Lean Six Sigma Green Belt, Lean Management, Minitab,CMMI
-
Business Analysis: CBAP, CCBA, ECBA
-
Agile Training: PMI-ACP , CSM , CSPO
-
Scrum Training: CSM
-
DevOps
-
Program Management: PgMP
-
Cloud Technology: Exin Cloud Computing
-
Citrix Client Adminisration: Citrix Cloud Administration
The 10 top-paying certifications to target in 2025 are:
Conclusion
Advancements in data storage have created better and safer ways to manage information. Businesses now have scalable solutions, from traditional databases to cloud computing. These solutions help them manage the rapid growth of data. As technology changes, our ways of managing and understanding data will change too. This will make data even more useful for decision-making and innovation.Data is not just numbers; it's a strong resource that fuels progress in many industries. Data collection, processing, and analysis are key for businesses, research, and daily life.
Contact Us For More Information:
Visit :www.icertglobal.com Email :

Harness the Power of Power BI to Make Smarter Decisions
In today’s digital era, organizations generate and store vast amounts of data. With the rise of cloud computing and big data, businesses want to use data. They seek to improve decision-making, boost productivity, and outpace competitors. One powerful tool in this pursuit is Business Intelligence (BI). Specifically, Microsoft’s Power BI has transformed how businesses use data. It helps them turn raw data into actionable insights.
This blog explores Power BI. It covers its features, benefits, and how to use it. It helps businesses make better decisions, improve operations, and drive growth.
What is Business Intelligence?
Before diving into Power BI, you must understand Business Intelligence (BI). Business Intelligence is, at its core, about using tools and processes. They help organizations collect and analyze data, and interpret it. It enables them to make informed business decisions.
BI uses various data sources. These include internal data, like sales figures, customer info, and financial records. They also include external data, like market trends and competitor analysis. The goal is to turn raw data into insights. These insights should support better decisions, boost efficiency, and foster a data-driven culture.
Traditional BI tools often needed a lot of IT help to extract, transform, and load data for analysis. However, modern BI tools like Power BI have changed that. They make data analytics more accessible to more business users. Now, they can create reports and dashboards. They can visualize data, too, without needing deep technical skills.
Introduction to Power Business Intelligence (Power BI)
Power BI is a cloud-based suite of Microsoft analytics tools. It lets users visualize and share real-time insights from their data. Power BI has many features for different business users, from analysts to executives.
Power BI can connect to various data sources. They are Excel spreadsheets, on-premises data, and cloud services: Azure, Google Analytics, and Salesforce. It works perfectly with other Microsoft tools, like Excel and Teams. So, it's ideal for organizations using Microsoft products.
Power BI is part of Microsoft's Power Platform. It includes Power Apps (for app development) and Power Automate (for workflow automation). These tools let businesses build a complete solution. It would analyze data, develop apps, and automate tasks.
Key Features of Power BI
- Data Connectivity and Integration: Power BI can connect to many data sources. These include traditional databases like SQL Server and Oracle. They also include cloud services like Google Analytics and social media. Users can easily pull data from various systems into a single view for analysis.
- Data Transformation and Cleaning: Power BI can clean and prepare data for analysis. This is important. Raw data is often unstructured. It needs preprocessing to be useful.
- Data Visualization: A top feature of Power BI is its stunning, interactive visuals. Users can create many visualizations, like bar charts and line graphs. They can also make heat maps and scatter plots. These visualizations help users identify trends, patterns, and outliers in the data.
- Interactive Dashboards: Power BI dashboards let users display key metrics and data. They should be interactive and real-time. These dashboards can be customized. They can show the most relevant info for specific departments and teams.
- Real-time Data: Power BI can handle real-time data updates. This ensures users have the most up-to-date information at all times. This helps businesses that must make quick, data-based decisions. Examples are sales teams, marketing, and supply chain managers.
- AI and Machine Learning Integration: Power BI uses AI and ML to find insights in the data. It can find trends, outliers, and patterns in large datasets. It will suggest actions to take.
- Power BI lets users share reports and dashboards with colleagues and partners. It integrates with Microsoft Teams, SharePoint, and other tools. This ensures seamless communication and information sharing.
- Security and Governance: Power BI has strong security features. They ensure data is accessed and shared securely. Users can set row-level security, access controls, and data governance.
- Mobile Access: Power BI has mobile apps for iOS and Android. They let users access data and insights on the go.
Types of Power BI
Power BI offers different versions to suit the needs of various organizations. These include:
- Power BI Desktop: A free, downloadable version. It has all the tools needed to create reports, visualizations, and data models. It is typically used by data analysts and business intelligence professionals.
- Power BI Pro: It is a subscription version. It has extra features, like sharing and collaboration. Power BI Pro is best for teams that need to collaborate on reports and dashboards.
- Power BI Premium: A higher-tier offering. It has dedicated cloud resources, advanced AI, and large data models. Power BI Premium suits organizations with large data or needing enterprise-level analytics.
- Power BI Embedded: A version for developers to embed Power BI reports and dashboards in apps. It enables businesses to provide BI capabilities within their own applications.
Benefits of Power Business Intelligence
Power BI provides a range of benefits for businesses of all sizes. Here are some of the most significant advantages:
1. Improved Decision-Making
Power BI's main benefit is its ability to enable data-driven decisions. Real-time data, visualizations, and dashboards help decision-makers. They can quickly grasp the impact of their choices. Then, they can act on accurate, up-to-date information. This leads to improved business outcomes and increased agility.
2. Enhanced Data Access and Collaboration
Power BI lets users in different teams access the same data and insights. Sharing reports and dashboards lets employees collaborate better. It aligns everyone to work toward common goals. With Power BI, leaders and analysts can make decisions based on a single source of truth.
3. Cost-Effective
Power BI offers an affordable solution for businesses of all sizes. Power BI Desktop is free, while Power BI Pro and Power BI Premium come with reasonable pricing models. For organizations already using Microsoft products, Power BI is a strong choice. It integrates seamlessly with other tools, leveraging their existing infrastructure.
4. Faster Insights and Reporting
With Power BI, businesses can generate insights faster than with traditional BI tools. Automated data refreshes and interactive visuals let users find trends faster. This enables organizations to respond to changing conditions and opportunities with greater speed.
5. Customizable and Scalable
Power BI is highly customizable and scalable, which means that it can grow with your business. Whether you're a small business or a large enterprise, Power BI can be tailored to your needs. It works for both beginners and those analyzing massive datasets.
6. Seamless Integration with Microsoft Ecosystem
For organizations using Microsoft products like Office 365, Power BI is a natural fit. It works with SharePoint and Excel. Power BI works well with these tools. It lets businesses use their existing infrastructure and expertise.
7. Better Performance with AI Integration
Power BI incorporates artificial intelligence (AI) capabilities that enhance data analysis. It uses machine learning to find trends, forecast outcomes, and make predictions. It gives businesses better insights and predictions. They can then outpace their competition.
8. Security and Compliance
Power BI meets strict security and compliance standards. So, businesses can trust it to handle sensitive data. Power BI has security features like encryption, access controls, and audit logs. They help businesses comply with data regulations and protect their data.
Use Cases for Power Business Intelligence (Power BI)
Power BI is a powerful, versatile tool for businesses in many industries. It helps them use data effectively and make informed decisions. It can serve many business functions. These include financial reporting, customer insights, and improving efficiency. It also fosters innovation. Let’s explore some key use cases of Power BI in different sectors.
1. Sales and Marketing Analytics
- A common use of Power BI is in sales and marketing. Businesses need to track and analyze performance metrics in real-time. Sales teams rely on data. It tracks customer behavior, market trends, and lead conversions.
- Tracking Sales Performance: With Power BI, sales managers can visualize KPIs. These are total sales, revenue, sales by region, and average deal size. It allows them to check performance against targets. They can then find top products and measure their sales strategies' effectiveness.
- Power BI helps marketing teams analyze customer behavior. It reveals trends in browsing, purchases, and demographics. Connecting to external data, like Google Analytics, can help businesses. It can help them create more personalized campaigns. They can also find opportunities for upselling or cross-selling.
- Campaign Performance: Marketing teams can track ad campaigns, social media, and email marketing. Real-time campaign data lets teams quickly adjust strategies. This ensures they get the best return on their marketing spend.
- Customer Segmentation: Power BI's analytics can create customer profiles. Then, businesses can segment them by behavior. They can target specific groups with tailored marketing. Understanding the distinct needs of customer segments is key to maximizing sales potential.
2. Financial Reporting and Analysis
- In finance, Power BI is a key tool. It aids in reporting and analysis. It helps firms track performance, cut costs, and ensure compliance. Finance teams need to turn complex financial data into simple, visual reports. They must be easy to understand and interpret.
- Real-time Financial Dashboards: Power BI lets finance teams build real-time dashboards. They provide instant access to key metrics: revenue, expenses, profit margins, cash flow, and the balance sheet. With these insights, finance teams can spot issues early. They can then forecast better and ensure the business meets its financial goals.
- Budgeting and Forecasting: Power BI helps firms create accurate budgets and forecasts. It pulls data from multiple sources. These include historical financial data, market trends, and projected growth. This lets organizations plan their budgets, track variances, and adapt to market changes.
- Profitability Analysis: Profit margins vary widely across products, regions, and customers. Power BI helps finance teams analyze profitability by these dimensions. It helps organizations find areas for improvement. Profitability analysis can help businesses make data-driven decisions. It can guide pricing, cost-cutting, and resource allocation.
- In regulated industries, Power BI helps track compliance with financial rules. It also manages audits and monitors risk. Businesses can reduce non-compliance risks by analyzing financial data and legal standards.
3. Supply Chain and Operations Management
- Supply chain management involves many linked processes. Power BI can provide insights to boost efficiency, cut costs, and streamline operations.
- Inventory Management: Power BI helps supply chain managers track inventory in real time. They can monitor stockouts, overstock, and reorder levels. Businesses can optimize stock levels in warehouses and stores. They can do this by analyzing data from inventory systems and sales forecasts.
- Supplier Performance: Businesses can use Power BI to track suppliers. It can evaluate their delivery times, quality, and pricing. This analysis helps businesses. It aids in sourcing, negotiating, and ensuring reliable supply chains.
- Power BI is key for operations management. It visualizes metrics on production efficiency, like yield, downtime, and machine utilization. Real-time monitoring of production data can help manufacturers. It can reduce waste, optimize processes, and ensure smooth operations.
- Integrating Power BI with logistics systems lets firms track shipping and delivery performance. They can analyze transportation costs and measure delivery times and customer satisfaction.
4. Human Resources Analytics
- HR teams must optimize performance, reduce turnover, and manage talent. Power BI helps HR departments analyze data. It improves recruitment, performance management, and employee engagement.
- HR can use Power BI to track employee performance. They can create dashboards to monitor productivity, engagement, and development. It can help evaluate individual and team performance across departments. HR managers can then spot high performers. They can also find those needing support or training.
- Power BI helps HR analyze employee turnover, finding patterns and reasons for it. For example, they can track employee tenure, satisfaction surveys, and exit interviews. This lets HR teams implement retention strategies and reduce turnover.
- Workforce Planning: Power BI helps with workforce planning. It predicts future staffing needs, finds skill gaps, and analyzes workforce diversity. It helps businesses plan for future recruitment and training needs.
- Power BI helps HR analyze employee pay data. It ensures pay equity across the organization. HR can boost employee satisfaction by fixing pay gaps. They can do this by looking at salaries, bonuses, and benefits.
5. Healthcare and Patient Analytics
- Power BI is transforming healthcare. It helps providers manage patient data, improve outcomes, and optimize operations. Power BI helps healthcare organizations improve care and patient experience. It does this by using the growing amount of patient data.
- Power BI helps providers analyze patient care data. They can track treatment outcomes and monitor satisfaction. Hospitals and clinics can use this data to find health trends. They can assess treatments and improve care.
- Healthcare organizations can use Power BI to track metrics. These include bed occupancy, wait times, and staff use. Visualizing these metrics lets admins spot inefficiencies. They can then improve resource use, boost patient care, and cut costs.
- Cost Management: Power BI can help healthcare groups cut costs. It does this by tracking departmental expenses. Providers can find cost-saving opportunities by analyzing spending on supplies, staffing, and equipment. This should not compromise care quality.
- Regulatory Compliance: It's critical to follow healthcare rules, like HIPAA, and industry standards. Power BI helps monitor healthcare law compliance. It tracks data for audits and reports.
6. Retail and Customer Experience
The retail industry is changing quickly. Power BI is now vital for businesses. It helps them improve operations and customer experience.
Power BI lets retailers analyze past sales data to forecast sales and inventory. It can predict future demand and optimize inventory. This ensures popular products are stocked and meet customer demand.
Customer Insights: Power BI helps retailers track customer purchasing behavior, preferences, and feedback. Businesses can analyze this data. It will help them to personalize shopping, improve recommendations, and optimize pricing.
Store Performance: Retail chains can use Power BI to track metrics across all stores. It includes sales figures, foot traffic, and customer satisfaction. It also includes employee productivity. Retailers can use this data to improve their stores and boost sales.
How to obtain Power BI certification?
We are an Education Technology company providing certification training courses to accelerate careers of working professionals worldwide. We impart training through instructor-led classroom workshops, instructor-led live virtual training sessions, and self-paced e-learning courses.
We have successfully conducted training sessions in 108 countries across the globe and enabled thousands of working professionals to enhance the scope of their careers.
Our enterprise training portfolio includes in-demand and globally recognized certification training courses in Project Management, Quality Management, Business Analysis, IT Service Management, Agile and Scrum, Cyber Security, Data Science, and Emerging Technologies. Download our Enterprise Training Catalog from https://www.icertglobal.com/corporate-training-for-enterprises.php and https://www.icertglobal.com/index.php
Popular Courses include:
-
Project Management: PMP, CAPM ,PMI RMP
-
Quality Management: Six Sigma Black Belt ,Lean Six Sigma Green Belt, Lean Management, Minitab,CMMI
-
Business Analysis: CBAP, CCBA, ECBA
-
Agile Training: PMI-ACP , CSM , CSPO
-
Scrum Training: CSM
-
DevOps
-
Program Management: PgMP
-
Cloud Technology: Exin Cloud Computing
-
Citrix Client Adminisration: Citrix Cloud Administration
The 10 top-paying certifications to target in 2025 are:
Conclusion
Power Business Intelligence (Power BI) is revolutionizing business data use. It's changing data analysis and decision-making. Power BI is empowering organizations to unlock their data's potential. Its powerful features and ease of use make it a favorite. It integrates well with Microsoft tools, too. By turning raw data into insights, businesses can make better decisions. They can also enhance collaboration and improve performance.Power BI is a low-cost, scalable solution for your business intelligence needs. It's good for both small businesses and large enterprises. Using Power BI can help organizations build a data-driven culture. This culture drives innovation and success.
As data grows in importance, Power BI will lead in business intelligence. It will help companies use data to gain a competitive edge.
Contact Us For More Information:
Visit :www.icertglobal.com Email :
Read More
In today’s digital era, organizations generate and store vast amounts of data. With the rise of cloud computing and big data, businesses want to use data. They seek to improve decision-making, boost productivity, and outpace competitors. One powerful tool in this pursuit is Business Intelligence (BI). Specifically, Microsoft’s Power BI has transformed how businesses use data. It helps them turn raw data into actionable insights.
This blog explores Power BI. It covers its features, benefits, and how to use it. It helps businesses make better decisions, improve operations, and drive growth.
What is Business Intelligence?
Before diving into Power BI, you must understand Business Intelligence (BI). Business Intelligence is, at its core, about using tools and processes. They help organizations collect and analyze data, and interpret it. It enables them to make informed business decisions.
BI uses various data sources. These include internal data, like sales figures, customer info, and financial records. They also include external data, like market trends and competitor analysis. The goal is to turn raw data into insights. These insights should support better decisions, boost efficiency, and foster a data-driven culture.
Traditional BI tools often needed a lot of IT help to extract, transform, and load data for analysis. However, modern BI tools like Power BI have changed that. They make data analytics more accessible to more business users. Now, they can create reports and dashboards. They can visualize data, too, without needing deep technical skills.
Introduction to Power Business Intelligence (Power BI)
Power BI is a cloud-based suite of Microsoft analytics tools. It lets users visualize and share real-time insights from their data. Power BI has many features for different business users, from analysts to executives.
Power BI can connect to various data sources. They are Excel spreadsheets, on-premises data, and cloud services: Azure, Google Analytics, and Salesforce. It works perfectly with other Microsoft tools, like Excel and Teams. So, it's ideal for organizations using Microsoft products.
Power BI is part of Microsoft's Power Platform. It includes Power Apps (for app development) and Power Automate (for workflow automation). These tools let businesses build a complete solution. It would analyze data, develop apps, and automate tasks.
Key Features of Power BI
- Data Connectivity and Integration: Power BI can connect to many data sources. These include traditional databases like SQL Server and Oracle. They also include cloud services like Google Analytics and social media. Users can easily pull data from various systems into a single view for analysis.
- Data Transformation and Cleaning: Power BI can clean and prepare data for analysis. This is important. Raw data is often unstructured. It needs preprocessing to be useful.
- Data Visualization: A top feature of Power BI is its stunning, interactive visuals. Users can create many visualizations, like bar charts and line graphs. They can also make heat maps and scatter plots. These visualizations help users identify trends, patterns, and outliers in the data.
- Interactive Dashboards: Power BI dashboards let users display key metrics and data. They should be interactive and real-time. These dashboards can be customized. They can show the most relevant info for specific departments and teams.
- Real-time Data: Power BI can handle real-time data updates. This ensures users have the most up-to-date information at all times. This helps businesses that must make quick, data-based decisions. Examples are sales teams, marketing, and supply chain managers.
- AI and Machine Learning Integration: Power BI uses AI and ML to find insights in the data. It can find trends, outliers, and patterns in large datasets. It will suggest actions to take.
- Power BI lets users share reports and dashboards with colleagues and partners. It integrates with Microsoft Teams, SharePoint, and other tools. This ensures seamless communication and information sharing.
- Security and Governance: Power BI has strong security features. They ensure data is accessed and shared securely. Users can set row-level security, access controls, and data governance.
- Mobile Access: Power BI has mobile apps for iOS and Android. They let users access data and insights on the go.
Types of Power BI
Power BI offers different versions to suit the needs of various organizations. These include:
- Power BI Desktop: A free, downloadable version. It has all the tools needed to create reports, visualizations, and data models. It is typically used by data analysts and business intelligence professionals.
- Power BI Pro: It is a subscription version. It has extra features, like sharing and collaboration. Power BI Pro is best for teams that need to collaborate on reports and dashboards.
- Power BI Premium: A higher-tier offering. It has dedicated cloud resources, advanced AI, and large data models. Power BI Premium suits organizations with large data or needing enterprise-level analytics.
- Power BI Embedded: A version for developers to embed Power BI reports and dashboards in apps. It enables businesses to provide BI capabilities within their own applications.
Benefits of Power Business Intelligence
Power BI provides a range of benefits for businesses of all sizes. Here are some of the most significant advantages:
1. Improved Decision-Making
Power BI's main benefit is its ability to enable data-driven decisions. Real-time data, visualizations, and dashboards help decision-makers. They can quickly grasp the impact of their choices. Then, they can act on accurate, up-to-date information. This leads to improved business outcomes and increased agility.
2. Enhanced Data Access and Collaboration
Power BI lets users in different teams access the same data and insights. Sharing reports and dashboards lets employees collaborate better. It aligns everyone to work toward common goals. With Power BI, leaders and analysts can make decisions based on a single source of truth.
3. Cost-Effective
Power BI offers an affordable solution for businesses of all sizes. Power BI Desktop is free, while Power BI Pro and Power BI Premium come with reasonable pricing models. For organizations already using Microsoft products, Power BI is a strong choice. It integrates seamlessly with other tools, leveraging their existing infrastructure.
4. Faster Insights and Reporting
With Power BI, businesses can generate insights faster than with traditional BI tools. Automated data refreshes and interactive visuals let users find trends faster. This enables organizations to respond to changing conditions and opportunities with greater speed.
5. Customizable and Scalable
Power BI is highly customizable and scalable, which means that it can grow with your business. Whether you're a small business or a large enterprise, Power BI can be tailored to your needs. It works for both beginners and those analyzing massive datasets.
6. Seamless Integration with Microsoft Ecosystem
For organizations using Microsoft products like Office 365, Power BI is a natural fit. It works with SharePoint and Excel. Power BI works well with these tools. It lets businesses use their existing infrastructure and expertise.
7. Better Performance with AI Integration
Power BI incorporates artificial intelligence (AI) capabilities that enhance data analysis. It uses machine learning to find trends, forecast outcomes, and make predictions. It gives businesses better insights and predictions. They can then outpace their competition.
8. Security and Compliance
Power BI meets strict security and compliance standards. So, businesses can trust it to handle sensitive data. Power BI has security features like encryption, access controls, and audit logs. They help businesses comply with data regulations and protect their data.
Use Cases for Power Business Intelligence (Power BI)
Power BI is a powerful, versatile tool for businesses in many industries. It helps them use data effectively and make informed decisions. It can serve many business functions. These include financial reporting, customer insights, and improving efficiency. It also fosters innovation. Let’s explore some key use cases of Power BI in different sectors.
1. Sales and Marketing Analytics
- A common use of Power BI is in sales and marketing. Businesses need to track and analyze performance metrics in real-time. Sales teams rely on data. It tracks customer behavior, market trends, and lead conversions.
- Tracking Sales Performance: With Power BI, sales managers can visualize KPIs. These are total sales, revenue, sales by region, and average deal size. It allows them to check performance against targets. They can then find top products and measure their sales strategies' effectiveness.
- Power BI helps marketing teams analyze customer behavior. It reveals trends in browsing, purchases, and demographics. Connecting to external data, like Google Analytics, can help businesses. It can help them create more personalized campaigns. They can also find opportunities for upselling or cross-selling.
- Campaign Performance: Marketing teams can track ad campaigns, social media, and email marketing. Real-time campaign data lets teams quickly adjust strategies. This ensures they get the best return on their marketing spend.
- Customer Segmentation: Power BI's analytics can create customer profiles. Then, businesses can segment them by behavior. They can target specific groups with tailored marketing. Understanding the distinct needs of customer segments is key to maximizing sales potential.
2. Financial Reporting and Analysis
- In finance, Power BI is a key tool. It aids in reporting and analysis. It helps firms track performance, cut costs, and ensure compliance. Finance teams need to turn complex financial data into simple, visual reports. They must be easy to understand and interpret.
- Real-time Financial Dashboards: Power BI lets finance teams build real-time dashboards. They provide instant access to key metrics: revenue, expenses, profit margins, cash flow, and the balance sheet. With these insights, finance teams can spot issues early. They can then forecast better and ensure the business meets its financial goals.
- Budgeting and Forecasting: Power BI helps firms create accurate budgets and forecasts. It pulls data from multiple sources. These include historical financial data, market trends, and projected growth. This lets organizations plan their budgets, track variances, and adapt to market changes.
- Profitability Analysis: Profit margins vary widely across products, regions, and customers. Power BI helps finance teams analyze profitability by these dimensions. It helps organizations find areas for improvement. Profitability analysis can help businesses make data-driven decisions. It can guide pricing, cost-cutting, and resource allocation.
- In regulated industries, Power BI helps track compliance with financial rules. It also manages audits and monitors risk. Businesses can reduce non-compliance risks by analyzing financial data and legal standards.
3. Supply Chain and Operations Management
- Supply chain management involves many linked processes. Power BI can provide insights to boost efficiency, cut costs, and streamline operations.
- Inventory Management: Power BI helps supply chain managers track inventory in real time. They can monitor stockouts, overstock, and reorder levels. Businesses can optimize stock levels in warehouses and stores. They can do this by analyzing data from inventory systems and sales forecasts.
- Supplier Performance: Businesses can use Power BI to track suppliers. It can evaluate their delivery times, quality, and pricing. This analysis helps businesses. It aids in sourcing, negotiating, and ensuring reliable supply chains.
- Power BI is key for operations management. It visualizes metrics on production efficiency, like yield, downtime, and machine utilization. Real-time monitoring of production data can help manufacturers. It can reduce waste, optimize processes, and ensure smooth operations.
- Integrating Power BI with logistics systems lets firms track shipping and delivery performance. They can analyze transportation costs and measure delivery times and customer satisfaction.
4. Human Resources Analytics
- HR teams must optimize performance, reduce turnover, and manage talent. Power BI helps HR departments analyze data. It improves recruitment, performance management, and employee engagement.
- HR can use Power BI to track employee performance. They can create dashboards to monitor productivity, engagement, and development. It can help evaluate individual and team performance across departments. HR managers can then spot high performers. They can also find those needing support or training.
- Power BI helps HR analyze employee turnover, finding patterns and reasons for it. For example, they can track employee tenure, satisfaction surveys, and exit interviews. This lets HR teams implement retention strategies and reduce turnover.
- Workforce Planning: Power BI helps with workforce planning. It predicts future staffing needs, finds skill gaps, and analyzes workforce diversity. It helps businesses plan for future recruitment and training needs.
- Power BI helps HR analyze employee pay data. It ensures pay equity across the organization. HR can boost employee satisfaction by fixing pay gaps. They can do this by looking at salaries, bonuses, and benefits.
5. Healthcare and Patient Analytics
- Power BI is transforming healthcare. It helps providers manage patient data, improve outcomes, and optimize operations. Power BI helps healthcare organizations improve care and patient experience. It does this by using the growing amount of patient data.
- Power BI helps providers analyze patient care data. They can track treatment outcomes and monitor satisfaction. Hospitals and clinics can use this data to find health trends. They can assess treatments and improve care.
- Healthcare organizations can use Power BI to track metrics. These include bed occupancy, wait times, and staff use. Visualizing these metrics lets admins spot inefficiencies. They can then improve resource use, boost patient care, and cut costs.
- Cost Management: Power BI can help healthcare groups cut costs. It does this by tracking departmental expenses. Providers can find cost-saving opportunities by analyzing spending on supplies, staffing, and equipment. This should not compromise care quality.
- Regulatory Compliance: It's critical to follow healthcare rules, like HIPAA, and industry standards. Power BI helps monitor healthcare law compliance. It tracks data for audits and reports.
6. Retail and Customer Experience
The retail industry is changing quickly. Power BI is now vital for businesses. It helps them improve operations and customer experience.
Power BI lets retailers analyze past sales data to forecast sales and inventory. It can predict future demand and optimize inventory. This ensures popular products are stocked and meet customer demand.
Customer Insights: Power BI helps retailers track customer purchasing behavior, preferences, and feedback. Businesses can analyze this data. It will help them to personalize shopping, improve recommendations, and optimize pricing.
Store Performance: Retail chains can use Power BI to track metrics across all stores. It includes sales figures, foot traffic, and customer satisfaction. It also includes employee productivity. Retailers can use this data to improve their stores and boost sales.
How to obtain Power BI certification?
We are an Education Technology company providing certification training courses to accelerate careers of working professionals worldwide. We impart training through instructor-led classroom workshops, instructor-led live virtual training sessions, and self-paced e-learning courses.
We have successfully conducted training sessions in 108 countries across the globe and enabled thousands of working professionals to enhance the scope of their careers.
Our enterprise training portfolio includes in-demand and globally recognized certification training courses in Project Management, Quality Management, Business Analysis, IT Service Management, Agile and Scrum, Cyber Security, Data Science, and Emerging Technologies. Download our Enterprise Training Catalog from https://www.icertglobal.com/corporate-training-for-enterprises.php and https://www.icertglobal.com/index.php
Popular Courses include:
-
Project Management: PMP, CAPM ,PMI RMP
-
Quality Management: Six Sigma Black Belt ,Lean Six Sigma Green Belt, Lean Management, Minitab,CMMI
-
Business Analysis: CBAP, CCBA, ECBA
-
Agile Training: PMI-ACP , CSM , CSPO
-
Scrum Training: CSM
-
DevOps
-
Program Management: PgMP
-
Cloud Technology: Exin Cloud Computing
-
Citrix Client Adminisration: Citrix Cloud Administration
The 10 top-paying certifications to target in 2025 are:
Conclusion
Power Business Intelligence (Power BI) is revolutionizing business data use. It's changing data analysis and decision-making. Power BI is empowering organizations to unlock their data's potential. Its powerful features and ease of use make it a favorite. It integrates well with Microsoft tools, too. By turning raw data into insights, businesses can make better decisions. They can also enhance collaboration and improve performance.Power BI is a low-cost, scalable solution for your business intelligence needs. It's good for both small businesses and large enterprises. Using Power BI can help organizations build a data-driven culture. This culture drives innovation and success.
As data grows in importance, Power BI will lead in business intelligence. It will help companies use data to gain a competitive edge.
Contact Us For More Information:
Visit :www.icertglobal.com Email :
.webp)
Data Science with R Programming Insights and Applications
In a data-driven era, finding insights in vast datasets is vital for all industries. Data science is at the heart of this transformation. It is an interdisciplinary field that uses data to solve problems and make decisions. Among the many tools for data scientists, R programming stands out. It is a powerful, versatile tool for statistical analysis and data visualization. It is widely used. This blog explores the basics, uses, and benefits of R for data science. It shows how R helps professionals solve complex problems.
Why Choose R for Data Science?
R, an open-source tool, was specifically designed for statistical computing and graphics. Its ecosystem has many packages and tools. It's a favourite of statisticians, data scientists, and researchers. Here are some compelling reasons to choose R for data science:
- R was built for data analysis. It has many functions for stats, tests, and regression.
- R has strong visualization tools. Libraries like ggplot2, lattice, and plotly let users create custom, eye-catching graphics. These visuals reveal trends and patterns in data.
- R's CRAN repo has over 18,000 packages for tasks like machine learning and time series analysis.
- Active Community Support: A global community provides constant development, resources, and help.
- R integrates with Big Data tools like Hadoop and Spark. It works with relational databases too. This enables scalable data processing and analysis.
Getting Started with R
1. Setting Up R and RStudio
To use R for data science, download and install R from CRAN. Then, install RStudio IDE. It provides a user-friendly interface for R projects.
2. Exploring R's Features
R offers a range of features for data manipulation, visualization, and statistical modeling. Its user-centric design lets professionals quickly access data tools: importing, cleaning, and analyzing. Also, R's compatibility with various data formats lets users work seamlessly across platforms.
Core Applications of R in Data Science
1. Data Cleaning and Preprocessing
Before analysis, raw data often requires cleaning and transformation. R simplifies these tasks with packages like dplyr and tidyr. They help professionals handle missing values, transform datasets, and perform aggregations.
2. Exploratory Data Analysis (EDA)
EDA involves summarizing datasets and visualizing distributions and relationships to uncover insights. R has powerful tools. They compute summary statistics and create visualizations that highlight key patterns in data.
3. Statistical Modeling
R excels in statistical modeling. It can do regression, time series, and survival analysis. Researchers and analysts often use R to build predictive models. They use it to evaluate relationships between variables and to forecast trends.
4. Machine Learning
R has libraries for machine learning. They let users do classification, clustering, and prediction tasks. It is widely used to develop algorithms. They provide insights and improve decision-making.
5. Data Visualization
R's visualization tools are among its most celebrated features. Professionals use R to create bar charts, scatter plots, and heatmaps. Its libraries are intuitive and produce high-quality, publication-ready graphics.
Real-World Use Cases of R in Data Science
1. Healthcare Analytics
R is widely used in medical research. It helps to analyze patient data, predict disease outcomes, and optimize treatment plans. For example, survival analysis helps oncologists estimate patient lifespans based on historical data.
2. Financial Modeling
In finance, R's skills help with portfolio optimization, risk analysis, and algorithmic trading. Analysts can model stock prices. They can also create strategies that adapt to changing market conditions.
3. Marketing and Customer Insights
R helps businesses segment customers, predict churn, and analyze campaign performance. Clustering algorithms and visualizations reveal patterns in customer behavior, enabling targeted marketing strategies.
4. Social Media Sentiment Analysis
Analysts can use R with APIs like Twitter's to collect and process social media data. This can gauge public sentiment about brands or events.
5. Academic Research
R’s statistical rigor makes it a go-to tool for researchers across disciplines. Whether studying climate change or human behavior, R facilitates reproducible, high-quality analysis.
Challenges and Tips for Using R in Data Science
Common Challenges:
- Steep Learning Curve: Beginners may find R’s design and structure intimidating.
- Performance Limitations: R can struggle with memory-intensive tasks on very large datasets.
- Lack of Native GUIs: R lacks interactive dashboards compared to some modern tools.
Tips for Overcoming Challenges:
- Leverage Online Resources: Utilize tutorials, forums, and documentation to accelerate learning.
- Combine R with Other Tools: Use R with Spark or Python for big data processing.
- Adopt R Markdown: Create reproducible reports and documents for better analysis sharing.
- Explore Parallel Computing: Use tools that enhance performance for large-scale tasks.
Future of R in Data Science
As data science evolves, R remains key for statistical analysis and research. With AI advances, R is adding deep learning and cloud integrations. This ensures its relevance in the ever-changing landscape of analytics.
How to obtain R Programming certification?
We are an Education Technology company providing certification training courses to accelerate careers of working professionals worldwide. We impart training through instructor-led classroom workshops, instructor-led live virtual training sessions, and self-paced e-learning courses.
We have successfully conducted training sessions in 108 countries across the globe and enabled thousands of working professionals to enhance the scope of their careers.
Our enterprise training portfolio includes in-demand and globally recognized certification training courses in Project Management, Quality Management, Business Analysis, IT Service Management, Agile and Scrum, Cyber Security, Data Science, and Emerging Technologies. Download our Enterprise Training Catalog from https://www.icertglobal.com/corporate-training-for-enterprises.php and https://www.icertglobal.com/index.php
Popular Courses include:
-
Project Management: PMP, CAPM ,PMI RMP
-
Quality Management: Six Sigma Black Belt ,Lean Six Sigma Green Belt, Lean Management, Minitab,CMMI
-
Business Analysis: CBAP, CCBA, ECBA
-
Agile Training: PMI-ACP , CSM , CSPO
-
Scrum Training: CSM
-
DevOps
-
Program Management: PgMP
-
Cloud Technology: Exin Cloud Computing
-
Citrix Client Adminisration: Citrix Cloud Administration
The 10 top-paying certifications to target in 2025 are:
Conclusion
R programming is a leader in data science. It helps professionals analyze data, find insights, and make decisions. R has a powerful toolkit for data-driven industries. Its stats and machine learning libraries can tackle modern challenges. Mastering R can unlock new possibilities for data scientists. It can drive innovation and create value across domains.
Whether you're a novice or a pro, R is your gateway to data science. It's a tool for discovery and impact. Start your journey today, and let R transform how you understand and utilize
Contact Us For More Information:
Visit :www.icertglobal.com Email :
Read More
In a data-driven era, finding insights in vast datasets is vital for all industries. Data science is at the heart of this transformation. It is an interdisciplinary field that uses data to solve problems and make decisions. Among the many tools for data scientists, R programming stands out. It is a powerful, versatile tool for statistical analysis and data visualization. It is widely used. This blog explores the basics, uses, and benefits of R for data science. It shows how R helps professionals solve complex problems.
Why Choose R for Data Science?
R, an open-source tool, was specifically designed for statistical computing and graphics. Its ecosystem has many packages and tools. It's a favourite of statisticians, data scientists, and researchers. Here are some compelling reasons to choose R for data science:
- R was built for data analysis. It has many functions for stats, tests, and regression.
- R has strong visualization tools. Libraries like ggplot2, lattice, and plotly let users create custom, eye-catching graphics. These visuals reveal trends and patterns in data.
- R's CRAN repo has over 18,000 packages for tasks like machine learning and time series analysis.
- Active Community Support: A global community provides constant development, resources, and help.
- R integrates with Big Data tools like Hadoop and Spark. It works with relational databases too. This enables scalable data processing and analysis.
Getting Started with R
1. Setting Up R and RStudio
To use R for data science, download and install R from CRAN. Then, install RStudio IDE. It provides a user-friendly interface for R projects.
2. Exploring R's Features
R offers a range of features for data manipulation, visualization, and statistical modeling. Its user-centric design lets professionals quickly access data tools: importing, cleaning, and analyzing. Also, R's compatibility with various data formats lets users work seamlessly across platforms.
Core Applications of R in Data Science
1. Data Cleaning and Preprocessing
Before analysis, raw data often requires cleaning and transformation. R simplifies these tasks with packages like dplyr and tidyr. They help professionals handle missing values, transform datasets, and perform aggregations.
2. Exploratory Data Analysis (EDA)
EDA involves summarizing datasets and visualizing distributions and relationships to uncover insights. R has powerful tools. They compute summary statistics and create visualizations that highlight key patterns in data.
3. Statistical Modeling
R excels in statistical modeling. It can do regression, time series, and survival analysis. Researchers and analysts often use R to build predictive models. They use it to evaluate relationships between variables and to forecast trends.
4. Machine Learning
R has libraries for machine learning. They let users do classification, clustering, and prediction tasks. It is widely used to develop algorithms. They provide insights and improve decision-making.
5. Data Visualization
R's visualization tools are among its most celebrated features. Professionals use R to create bar charts, scatter plots, and heatmaps. Its libraries are intuitive and produce high-quality, publication-ready graphics.
Real-World Use Cases of R in Data Science
1. Healthcare Analytics
R is widely used in medical research. It helps to analyze patient data, predict disease outcomes, and optimize treatment plans. For example, survival analysis helps oncologists estimate patient lifespans based on historical data.
2. Financial Modeling
In finance, R's skills help with portfolio optimization, risk analysis, and algorithmic trading. Analysts can model stock prices. They can also create strategies that adapt to changing market conditions.
3. Marketing and Customer Insights
R helps businesses segment customers, predict churn, and analyze campaign performance. Clustering algorithms and visualizations reveal patterns in customer behavior, enabling targeted marketing strategies.
4. Social Media Sentiment Analysis
Analysts can use R with APIs like Twitter's to collect and process social media data. This can gauge public sentiment about brands or events.
5. Academic Research
R’s statistical rigor makes it a go-to tool for researchers across disciplines. Whether studying climate change or human behavior, R facilitates reproducible, high-quality analysis.
Challenges and Tips for Using R in Data Science
Common Challenges:
- Steep Learning Curve: Beginners may find R’s design and structure intimidating.
- Performance Limitations: R can struggle with memory-intensive tasks on very large datasets.
- Lack of Native GUIs: R lacks interactive dashboards compared to some modern tools.
Tips for Overcoming Challenges:
- Leverage Online Resources: Utilize tutorials, forums, and documentation to accelerate learning.
- Combine R with Other Tools: Use R with Spark or Python for big data processing.
- Adopt R Markdown: Create reproducible reports and documents for better analysis sharing.
- Explore Parallel Computing: Use tools that enhance performance for large-scale tasks.
Future of R in Data Science
As data science evolves, R remains key for statistical analysis and research. With AI advances, R is adding deep learning and cloud integrations. This ensures its relevance in the ever-changing landscape of analytics.
How to obtain R Programming certification?
We are an Education Technology company providing certification training courses to accelerate careers of working professionals worldwide. We impart training through instructor-led classroom workshops, instructor-led live virtual training sessions, and self-paced e-learning courses.
We have successfully conducted training sessions in 108 countries across the globe and enabled thousands of working professionals to enhance the scope of their careers.
Our enterprise training portfolio includes in-demand and globally recognized certification training courses in Project Management, Quality Management, Business Analysis, IT Service Management, Agile and Scrum, Cyber Security, Data Science, and Emerging Technologies. Download our Enterprise Training Catalog from https://www.icertglobal.com/corporate-training-for-enterprises.php and https://www.icertglobal.com/index.php
Popular Courses include:
-
Project Management: PMP, CAPM ,PMI RMP
-
Quality Management: Six Sigma Black Belt ,Lean Six Sigma Green Belt, Lean Management, Minitab,CMMI
-
Business Analysis: CBAP, CCBA, ECBA
-
Agile Training: PMI-ACP , CSM , CSPO
-
Scrum Training: CSM
-
DevOps
-
Program Management: PgMP
-
Cloud Technology: Exin Cloud Computing
-
Citrix Client Adminisration: Citrix Cloud Administration
The 10 top-paying certifications to target in 2025 are:
Conclusion
R programming is a leader in data science. It helps professionals analyze data, find insights, and make decisions. R has a powerful toolkit for data-driven industries. Its stats and machine learning libraries can tackle modern challenges. Mastering R can unlock new possibilities for data scientists. It can drive innovation and create value across domains.
Whether you're a novice or a pro, R is your gateway to data science. It's a tool for discovery and impact. Start your journey today, and let R transform how you understand and utilize
Contact Us For More Information:
Visit :www.icertglobal.com Email :
 (1).webp)
Mastering Power BI The Key to Business Analytics Success
In today's fast-paced business world, success depends on using data. It is vital to collect, analyze, and act on it. Every day, organizations generate huge amounts of data. It's key to make sense of this data to gain a competitive edge. This is where Power Business Intelligence (Power BI) is key. It's a business analytics tool developed by Microsoft. Power BI has a user-friendly interface and strong analytics. It integrates well with many data sources. It is now a top business intelligence platform globally.
This blog will explore Power BI. We will cover its components, benefits, and uses. Also, we'll discuss how businesses can use it for better decision-making.
What is Power Business Intelligence (Power BI)?
Power BI is a set of tools for business analytics. It lets organizations visualize data and share insights across teams. It lets users connect to hundreds of data sources. They can then transform raw data into useful information. Finally, they can create interactive dashboards and reports. Power BI is for both technical and non-technical users. It empowers everyone, from analysts to executives, to make data-driven decisions.
Power BI is available in various forms, including:
- Power BI Desktop: A Windows application for creating reports and visualizations.
- Power BI Service: A cloud-based service for sharing and collaborating on reports.
- Power BI Mobile: Apps for iOS, Android, and Windows. They enable on-the-go access to reports.
- Power BI Embedded: A service for developers. It lets them embed Power BI reports and dashboards into custom apps.
Key Components of Power BI
Power BI has several key components. They work together to provide a complete analytics solution.
1. Power Query
Power Query is a tool for data connectivity and transformation. It lets users extract data from various sources, clean and reshape it, and load it into Power BI. Its simple interface lets users wrangle data without advanced coding skills.
2. Power Pivot
Power Pivot is a data modeling tool. It lets users create complex models by defining relationships between tables. Users can also add calculated columns and measures using DAX (Data Analysis Expressions). This enables advanced analytics and faster data processing.
3. Power View
Power View is a tool for data visualization. It helps users create interactive charts, graphs, and maps. It allows for real-time exploration of data, making it easy to uncover trends and insights.
4. Power Map
Power Map, now 3D Maps, is a tool. It creates 3D data visualizations on a map. This is particularly useful for organizations that need to analyze location-based data.
5. Power Q&A
Power Q&A allows users to interact with their data using natural language queries. Users can type questions. Power BI will generate answers and visualizations based on the data model.
6. Power BI Gateway
The Power BI Gateway transfers data securely between on-premises sources and the Power BI Service. It ensures that users can access up-to-date data from their on-premise systems in the cloud.
Benefits of Power BI
Adopting Power BI offers several significant advantages to organizations:
1. Easy-to-Use Interface
Power BI has a user-friendly drag-and-drop interface. It is accessible to users with varying technical skills. Even non-technical users can create reports and dashboards. They don't need to rely on IT teams.
2. Seamless Integration
Power BI works with many data sources. They include Excel, SQL Server, SharePoint, Azure, Google Analytics, and Salesforce. This flexibility lets organizations consolidate data from different systems into one platform.
3. Advanced Data Visualization
Power BI has many data visualization options. They include bar charts, pie charts, line graphs, heat maps, and custom visuals. These visualizations help users explore data. They present it clearly and engagingly.
4. Real-Time Data Insights
Power BI can connect to real-time data streams. It lets organizations monitor KPIs in real-time. This facilitates quicker responses to changing business conditions.
5. Collaboration and Sharing
Power BI helps teams collaborate. It lets users share reports and dashboards with colleagues. The cloud-based Power BI Service is for everyone in the organization. It ensures they access the latest insights.
6. Cost-Effective Solution
Compared to other business intelligence platforms, Power BI offers a cost-effective solution. The Power BI Desktop app is free. The Pro and Premium services are competitively priced. This makes them accessible to businesses of all sizes.
Practical Applications of Power BI
1. Sales and Marketing Analytics
Power BI helps sales and marketing teams track key metrics. These include sales revenue, lead conversion rates, customer acquisition costs, and campaign effectiveness. Visualizing these metrics helps teams find areas to improve and optimize their strategies.
2. Financial Analysis
Finance departments can use Power BI for financial tasks. It can create reports, monitor cash flow, analyze expenses, and forecast revenue. Its advanced data modeling capabilities make it easier to handle complex financial data.
3. Supply Chain and Operations Management
Power BI helps supply chain and operations managers. They can monitor inventory, track shipments, and analyze suppliers. Real-time dashboards show the whole supply chain. They help improve efficiency and cut costs.
4. Human Resources Analytics
HR teams can use Power BI to analyze employee performance. They can also track headcount trends and monitor recruitment metrics. These insights can help improve employee engagement and workforce planning.
5. Customer Service
Power BI lets customer service teams track metrics. These include response time, resolution time, and customer satisfaction. Teams can spot trends and patterns. This can improve service quality and the customer experience.
How to Get Started with Power BI
If you’re new to Power BI, here are some steps to help you get started:
1. Download Power BI Desktop
Power BI Desktop is free to download. It is great for making reports and visualizations. You can start by connecting to sample data sets and exploring its features.
2. Connect to Data Sources
Power BI supports a wide range of data sources. Start by connecting to a simple data source, like an Excel file. Then, experiment with data transformations using Power Query.
3. Create Visualizations
Use Power BI’s drag-and-drop interface to create different types of visualizations. Experiment with filters, slicers, and drill-through features to enhance interactivity.
4. Publish Reports
After creating your reports, you can publish them to the Power BI Service. This will allow for sharing and collaboration. You can also set up scheduled refreshes to keep your data up-to-date.
5. Learn DAX
DAX is a formula language in Power BI. It is for creating custom calculations. DAX can help you do advanced analytics and get insights from your data.
Power BI vs. Other BI Tools
Many business intelligence tools are on the market. Power BI stands out because of its:
- Affordability: Power BI has a free desktop version. Its Pro and Premium plans are competitively priced.
- Integration with Microsoft Ecosystem: Power BI works with Excel, Azure, and Office 365. It integrates well with other Microsoft products.
- Ease of Use: Its intuitive interface helps users start quickly. Other BI tools require extensive training.
How to obtain Mastering Power BI certification?
We are an Education Technology company providing certification training courses to accelerate careers of working professionals worldwide. We impart training through instructor-led classroom workshops, instructor-led live virtual training sessions, and self-paced e-learning courses.
We have successfully conducted training sessions in 108 countries across the globe and enabled thousands of working professionals to enhance the scope of their careers.
Our enterprise training portfolio includes in-demand and globally recognized certification training courses in Project Management, Quality Management, Business Analysis, IT Service Management, Agile and Scrum, Cyber Security, Data Science, and Emerging Technologies. Download our Enterprise Training Catalog from https://www.icertglobal.com/corporate-training-for-enterprises.php and https://www.icertglobal.com/index.php
Popular Courses include:
-
Project Management: PMP, CAPM ,PMI RMP
-
Quality Management: Six Sigma Black Belt ,Lean Six Sigma Green Belt, Lean Management, Minitab,CMMI
-
Business Analysis: CBAP, CCBA, ECBA
-
Agile Training: PMI-ACP , CSM , CSPO
-
Scrum Training: CSM
-
DevOps
-
Program Management: PgMP
-
Cloud Technology: Exin Cloud Computing
-
Citrix Client Adminisration: Citrix Cloud Administration
The 10 top-paying certifications to target in 2025 are:
Conclusion
Power Business Intelligence (Power BI) is a powerful tool. It helps organizations use their data to the fullest. Power BI has a user-friendly interface and advanced analytics. It integrates well with various data sources. It helps businesses make confident, data-driven decisions. Power BI is a scalable, low-cost solution. It suits small business owners seeking insights into operations. It also helps large enterprises optimize performance across departments.
Adopting Power BI lets businesses turn raw data into insights. This fosters innovation, boosts efficiency, and drives growth. If you haven't explored Power BI, now is the time. Unlock its potential and elevate your business intelligence strategy.
Contact Us For More Information:
Visit :www.icertglobal.com Email :
Read More
In today's fast-paced business world, success depends on using data. It is vital to collect, analyze, and act on it. Every day, organizations generate huge amounts of data. It's key to make sense of this data to gain a competitive edge. This is where Power Business Intelligence (Power BI) is key. It's a business analytics tool developed by Microsoft. Power BI has a user-friendly interface and strong analytics. It integrates well with many data sources. It is now a top business intelligence platform globally.
This blog will explore Power BI. We will cover its components, benefits, and uses. Also, we'll discuss how businesses can use it for better decision-making.
What is Power Business Intelligence (Power BI)?
Power BI is a set of tools for business analytics. It lets organizations visualize data and share insights across teams. It lets users connect to hundreds of data sources. They can then transform raw data into useful information. Finally, they can create interactive dashboards and reports. Power BI is for both technical and non-technical users. It empowers everyone, from analysts to executives, to make data-driven decisions.
Power BI is available in various forms, including:
- Power BI Desktop: A Windows application for creating reports and visualizations.
- Power BI Service: A cloud-based service for sharing and collaborating on reports.
- Power BI Mobile: Apps for iOS, Android, and Windows. They enable on-the-go access to reports.
- Power BI Embedded: A service for developers. It lets them embed Power BI reports and dashboards into custom apps.
Key Components of Power BI
Power BI has several key components. They work together to provide a complete analytics solution.
1. Power Query
Power Query is a tool for data connectivity and transformation. It lets users extract data from various sources, clean and reshape it, and load it into Power BI. Its simple interface lets users wrangle data without advanced coding skills.
2. Power Pivot
Power Pivot is a data modeling tool. It lets users create complex models by defining relationships between tables. Users can also add calculated columns and measures using DAX (Data Analysis Expressions). This enables advanced analytics and faster data processing.
3. Power View
Power View is a tool for data visualization. It helps users create interactive charts, graphs, and maps. It allows for real-time exploration of data, making it easy to uncover trends and insights.
4. Power Map
Power Map, now 3D Maps, is a tool. It creates 3D data visualizations on a map. This is particularly useful for organizations that need to analyze location-based data.
5. Power Q&A
Power Q&A allows users to interact with their data using natural language queries. Users can type questions. Power BI will generate answers and visualizations based on the data model.
6. Power BI Gateway
The Power BI Gateway transfers data securely between on-premises sources and the Power BI Service. It ensures that users can access up-to-date data from their on-premise systems in the cloud.
Benefits of Power BI
Adopting Power BI offers several significant advantages to organizations:
1. Easy-to-Use Interface
Power BI has a user-friendly drag-and-drop interface. It is accessible to users with varying technical skills. Even non-technical users can create reports and dashboards. They don't need to rely on IT teams.
2. Seamless Integration
Power BI works with many data sources. They include Excel, SQL Server, SharePoint, Azure, Google Analytics, and Salesforce. This flexibility lets organizations consolidate data from different systems into one platform.
3. Advanced Data Visualization
Power BI has many data visualization options. They include bar charts, pie charts, line graphs, heat maps, and custom visuals. These visualizations help users explore data. They present it clearly and engagingly.
4. Real-Time Data Insights
Power BI can connect to real-time data streams. It lets organizations monitor KPIs in real-time. This facilitates quicker responses to changing business conditions.
5. Collaboration and Sharing
Power BI helps teams collaborate. It lets users share reports and dashboards with colleagues. The cloud-based Power BI Service is for everyone in the organization. It ensures they access the latest insights.
6. Cost-Effective Solution
Compared to other business intelligence platforms, Power BI offers a cost-effective solution. The Power BI Desktop app is free. The Pro and Premium services are competitively priced. This makes them accessible to businesses of all sizes.
Practical Applications of Power BI
1. Sales and Marketing Analytics
Power BI helps sales and marketing teams track key metrics. These include sales revenue, lead conversion rates, customer acquisition costs, and campaign effectiveness. Visualizing these metrics helps teams find areas to improve and optimize their strategies.
2. Financial Analysis
Finance departments can use Power BI for financial tasks. It can create reports, monitor cash flow, analyze expenses, and forecast revenue. Its advanced data modeling capabilities make it easier to handle complex financial data.
3. Supply Chain and Operations Management
Power BI helps supply chain and operations managers. They can monitor inventory, track shipments, and analyze suppliers. Real-time dashboards show the whole supply chain. They help improve efficiency and cut costs.
4. Human Resources Analytics
HR teams can use Power BI to analyze employee performance. They can also track headcount trends and monitor recruitment metrics. These insights can help improve employee engagement and workforce planning.
5. Customer Service
Power BI lets customer service teams track metrics. These include response time, resolution time, and customer satisfaction. Teams can spot trends and patterns. This can improve service quality and the customer experience.
How to Get Started with Power BI
If you’re new to Power BI, here are some steps to help you get started:
1. Download Power BI Desktop
Power BI Desktop is free to download. It is great for making reports and visualizations. You can start by connecting to sample data sets and exploring its features.
2. Connect to Data Sources
Power BI supports a wide range of data sources. Start by connecting to a simple data source, like an Excel file. Then, experiment with data transformations using Power Query.
3. Create Visualizations
Use Power BI’s drag-and-drop interface to create different types of visualizations. Experiment with filters, slicers, and drill-through features to enhance interactivity.
4. Publish Reports
After creating your reports, you can publish them to the Power BI Service. This will allow for sharing and collaboration. You can also set up scheduled refreshes to keep your data up-to-date.
5. Learn DAX
DAX is a formula language in Power BI. It is for creating custom calculations. DAX can help you do advanced analytics and get insights from your data.
Power BI vs. Other BI Tools
Many business intelligence tools are on the market. Power BI stands out because of its:
- Affordability: Power BI has a free desktop version. Its Pro and Premium plans are competitively priced.
- Integration with Microsoft Ecosystem: Power BI works with Excel, Azure, and Office 365. It integrates well with other Microsoft products.
- Ease of Use: Its intuitive interface helps users start quickly. Other BI tools require extensive training.
How to obtain Mastering Power BI certification?
We are an Education Technology company providing certification training courses to accelerate careers of working professionals worldwide. We impart training through instructor-led classroom workshops, instructor-led live virtual training sessions, and self-paced e-learning courses.
We have successfully conducted training sessions in 108 countries across the globe and enabled thousands of working professionals to enhance the scope of their careers.
Our enterprise training portfolio includes in-demand and globally recognized certification training courses in Project Management, Quality Management, Business Analysis, IT Service Management, Agile and Scrum, Cyber Security, Data Science, and Emerging Technologies. Download our Enterprise Training Catalog from https://www.icertglobal.com/corporate-training-for-enterprises.php and https://www.icertglobal.com/index.php
Popular Courses include:
-
Project Management: PMP, CAPM ,PMI RMP
-
Quality Management: Six Sigma Black Belt ,Lean Six Sigma Green Belt, Lean Management, Minitab,CMMI
-
Business Analysis: CBAP, CCBA, ECBA
-
Agile Training: PMI-ACP , CSM , CSPO
-
Scrum Training: CSM
-
DevOps
-
Program Management: PgMP
-
Cloud Technology: Exin Cloud Computing
-
Citrix Client Adminisration: Citrix Cloud Administration
The 10 top-paying certifications to target in 2025 are:
Conclusion
Power Business Intelligence (Power BI) is a powerful tool. It helps organizations use their data to the fullest. Power BI has a user-friendly interface and advanced analytics. It integrates well with various data sources. It helps businesses make confident, data-driven decisions. Power BI is a scalable, low-cost solution. It suits small business owners seeking insights into operations. It also helps large enterprises optimize performance across departments.
Adopting Power BI lets businesses turn raw data into insights. This fosters innovation, boosts efficiency, and drives growth. If you haven't explored Power BI, now is the time. Unlock its potential and elevate your business intelligence strategy.
Contact Us For More Information:
Visit :www.icertglobal.com Email :
.webp)
How Apache Spark and Scala Revolutionize Big Data Analytics
In today’s data-driven world, organizations are generating enormous amounts of data daily. Businesses need tools to process and analyze data in real-time. This data comes from customer interactions and sensors. Apache Spark and Scala are two of the most popular big data technologies. They provide fast, scalable, and widely distributed data processing capabilities.They form a powerful team. It can handle massive datasets efficiently. It gives developers and data engineers a strong platform. They can build high-performance data processing systems with it.This blog will explore Apache Spark and Scala. We'll see how they work together. We'll also discuss why they are popular for big data apps.
What is Apache Spark?
Apache Spark is an open-source, distributed computing system. It is for fast, large-scale data processing. The development of Spark was led by researchers from UC Berkeley. It is now a top-level Apache project. It is known for processing data faster than older big data tools, like Hadoop's MapReduce.
Key Features of Apache Spark:
- In-Memory Computing: A key feature of Apache Spark is its in-memory computation. It outperforms traditional disk-based methods in data processing speed. Storing intermediate results in memory reduces disk I/O. This speeds up processing.
- Unified Engine: Spark is a unified data engine. It handles batch processing, real-time streaming, machine learning, and graph processing. This flexibility allows it to be used across various data processing tasks.
- Fault Tolerance: Spark ensures data reliability with Resilient Distributed Datasets (RDDs). RDDs allow for fault tolerance. In the event of a node failure, Spark can restore the lost data by recomputing it from the original source or other datasets.
- Ease of Use: User-Friendly: Spark offers APIs in Java, Python, R, and Scala. This makes it accessible to many developers. The most popular language for Spark programming, however, is Scala.
- Scalability: Spark can scale to handle petabytes of data. It is a perfect tool for large-scale data processing. It functions on a cluster of machines, splitting the tasks across several nodes.
What is Scala?
Scala, derived from 'scalable language,' is an advanced programming language. It merges the strengths of object-oriented and functional programming. Scala, developed by Martin Odersky and released in 2003, is popular in big data. Its success comes from its tight integration with Apache Spark.
Key Features of Scala:
- Functional Programming: Scala promotes immutable data and higher-order functions. This leads to more concise and predictable code. In Spark, this enables writing cleaner and more efficient data pipelines.
- Object-Oriented Programming: Scala is also an object-oriented language. It supports classes, inheritance, and polymorphism. This makes it a versatile tool for developers who know Java-like OOP.
- The Java Virtual Machine (JVM) serves as the platform for running Scala. It is fully interoperable with Java. Scala is a powerful language for JVM-based ecosystems. Apache Spark, which is also written in Java, is one of them.
- Concise Syntax: Compared to Java, Scala has a much more concise and expressive syntax. This can reduce boilerplate code and boost developer productivity. It's especially true for data engineers using big data frameworks like Spark.
- Immutability: Scala's focus on immutability prevents unexpected data changes. This is essential for managing large, distributed datasets in Spark.
Why Apache Spark and Scala Work So Well Together
Apache Spark was designed with Scala in mind. The two technologies complement each other perfectly. Here’s why:
- Spark's Native API is in Scala For working with Spark, it is the most effective language. It is the most efficient and performant. Writing Spark apps in Scala gives you access to all its features and optimizations. This makes it faster and more effective than using other languages with Spark.
- Spark's parallel processing model suits Scala's functional features. These include higher-order functions and immutability. They enable cleaner, more efficient code. So, developers can write elegant, short, and readable code for Spark jobs. This improves development efficiency and the performance of the apps.
- Strong Support for Big Data: Spark is often used for big data apps that process huge datasets in parallel. Scala's immutability and support for concurrency make it ideal for big data apps. They must be robust and scalable.
- High Performance: Spark is written in Scala. So, the integration is seamless. Scala's high-performance features make it a natural fit for Spark. Its code compiles to JVM bytecode. Spark is a highly optimized data processing framework.
Use Cases for Apache Spark and Scala
We've shown that Spark and Scala are a perfect match. Now, let's look at some common uses for their combination.
1. Real-Time Data Processing
With the rise of real-time analytics, we must process streaming data. Spark Streaming has become a leading tool for real-time data pipelines, built on Apache Spark. It can handle real-time data from sources such as Kafka, Flume, and HDFS.
Scala lets developers easily write efficient streaming jobs. These jobs process data as it arrives. Analyzing IoT sensor data or monitoring website users requires speed. Spark and Scala provide the needed speed and scale for real-time data processing.
2. Batch Data Processing
Spark excels at batch processing. It manages large datasets by processing them in parallel. Spark's in-memory computing speeds up batch jobs on vast datasets. It is much faster than traditional systems like Hadoop MapReduce.
Scala's features, like map, reduce, and filter, are great for short, efficient batch jobs. They're functional. Spark can process logs, transactional data, and large datasets. It is much faster than conventional tools.
3. Machine Learning with Spark MLlib
Apache Spark includes MLlib, a scalable library for machine learning. It can do classification, regression, clustering, and collaborative filtering. Scala makes it easy to use MLlib. It has concise syntax and can integrate complex algorithms.
Data scientists and engineers can use Spark's power It is capable of training machine learning models on vast datasets. Scala's functional nature helps ensure that models are efficient and fast. They must function effectively in a distributed setting.
4. Graph Processing with GraphX
For complex graph-based computations, Spark provides GraphX, a distributed graph processing framework. This lets you rank pages, compute shortest paths, and cluster large graph datasets.
Scala's syntax, and its focus on immutability, make it ideal for graph algorithms in Spark. Developers can use Scala's built-in functions. They are a clean, maintainable way to process graph data.
Getting Started with Apache Spark and Scala
If you want to start with Apache Spark and Scala, here's a simple, step-by-step guide:
- Set Up a Spark Environment: Download and install Apache Spark. Or, set up a Spark cluster on a cloud platform (e.g., AWS, Azure, Google Cloud). You’ll need to install Java and Scala on your system as well.
- Install Spark in Scala: To use Spark with Scala, you need to install the necessary libraries. You can either use SBT (Scala Build Tool) or Maven to manage dependencies.
- Write Your First Spark Job: Once you have the environment set up, you can start by writing a simple Spark job in Scala. For example, create an RDD from a text file. Then, use transformations like map or filter. Ultimately, execute actions such as count or collect to retrieve the output.
Explore Spark Libraries: There are many libraries in Spark. They handle different data processing tasks. They include Spark SQL, MLlib, and GraphX. Each library provides unique tools for working with data in Spark
How to obtain Apache Spark and Scala Revolutionize Big Data certification?
We are an Education Technology company providing certification training courses to accelerate careers of working professionals worldwide. We impart training through instructor-led classroom workshops, instructor-led live virtual training sessions, and self-paced e-learning courses.
We have successfully conducted training sessions in 108 countries across the globe and enabled thousands of working professionals to enhance the scope of their careers.
Our enterprise training portfolio includes in-demand and globally recognized certification training courses in Project Management, Quality Management, Business Analysis, IT Service Management, Agile and Scrum, Cyber Security, Data Science, and Emerging Technologies. Download our Enterprise Training Catalog from https://www.icertglobal.com/corporate-training-for-enterprises.php and https://www.icertglobal.com/index.php
Popular Courses include:
-
Project Management: PMP, CAPM ,PMI RMP
-
Quality Management: Six Sigma Black Belt ,Lean Six Sigma Green Belt, Lean Management, Minitab,CMMI
-
Business Analysis: CBAP, CCBA, ECBA
-
Agile Training: PMI-ACP , CSM , CSPO
-
Scrum Training: CSM
-
DevOps
-
Program Management: PgMP
-
Cloud Technology: Exin Cloud Computing
-
Citrix Client Adminisration: Citrix Cloud Administration
The 10 top-paying certifications to target in 2025 are:
Conclusion
Apache Spark and Scala are a great combo. They help build efficient, scalable big data apps. Spark can process huge amounts of data in parallel. Scala offers a succinct syntax while also supporting functional programming. They are ideal for real-time, batch, and graph processing, and machine learning.
Data engineers and developers have the ability to tap into the full potential of big data. They can do this by knowing the strengths of Apache Spark and Scala. They can then use the speed, scalability, and flexibility of this powerful combo. For batch analytics, real-time streaming, or machine learning, use Apache Spark and Scala. They provide a solid base for your big data projects.
Contact Us For More Information:
Visit :www.icertglobal.com Email :
Read More
In today’s data-driven world, organizations are generating enormous amounts of data daily. Businesses need tools to process and analyze data in real-time. This data comes from customer interactions and sensors. Apache Spark and Scala are two of the most popular big data technologies. They provide fast, scalable, and widely distributed data processing capabilities.They form a powerful team. It can handle massive datasets efficiently. It gives developers and data engineers a strong platform. They can build high-performance data processing systems with it.This blog will explore Apache Spark and Scala. We'll see how they work together. We'll also discuss why they are popular for big data apps.
What is Apache Spark?
Apache Spark is an open-source, distributed computing system. It is for fast, large-scale data processing. The development of Spark was led by researchers from UC Berkeley. It is now a top-level Apache project. It is known for processing data faster than older big data tools, like Hadoop's MapReduce.
Key Features of Apache Spark:
- In-Memory Computing: A key feature of Apache Spark is its in-memory computation. It outperforms traditional disk-based methods in data processing speed. Storing intermediate results in memory reduces disk I/O. This speeds up processing.
- Unified Engine: Spark is a unified data engine. It handles batch processing, real-time streaming, machine learning, and graph processing. This flexibility allows it to be used across various data processing tasks.
- Fault Tolerance: Spark ensures data reliability with Resilient Distributed Datasets (RDDs). RDDs allow for fault tolerance. In the event of a node failure, Spark can restore the lost data by recomputing it from the original source or other datasets.
- Ease of Use: User-Friendly: Spark offers APIs in Java, Python, R, and Scala. This makes it accessible to many developers. The most popular language for Spark programming, however, is Scala.
- Scalability: Spark can scale to handle petabytes of data. It is a perfect tool for large-scale data processing. It functions on a cluster of machines, splitting the tasks across several nodes.
What is Scala?
Scala, derived from 'scalable language,' is an advanced programming language. It merges the strengths of object-oriented and functional programming. Scala, developed by Martin Odersky and released in 2003, is popular in big data. Its success comes from its tight integration with Apache Spark.
Key Features of Scala:
- Functional Programming: Scala promotes immutable data and higher-order functions. This leads to more concise and predictable code. In Spark, this enables writing cleaner and more efficient data pipelines.
- Object-Oriented Programming: Scala is also an object-oriented language. It supports classes, inheritance, and polymorphism. This makes it a versatile tool for developers who know Java-like OOP.
- The Java Virtual Machine (JVM) serves as the platform for running Scala. It is fully interoperable with Java. Scala is a powerful language for JVM-based ecosystems. Apache Spark, which is also written in Java, is one of them.
- Concise Syntax: Compared to Java, Scala has a much more concise and expressive syntax. This can reduce boilerplate code and boost developer productivity. It's especially true for data engineers using big data frameworks like Spark.
- Immutability: Scala's focus on immutability prevents unexpected data changes. This is essential for managing large, distributed datasets in Spark.
Why Apache Spark and Scala Work So Well Together
Apache Spark was designed with Scala in mind. The two technologies complement each other perfectly. Here’s why:
- Spark's Native API is in Scala For working with Spark, it is the most effective language. It is the most efficient and performant. Writing Spark apps in Scala gives you access to all its features and optimizations. This makes it faster and more effective than using other languages with Spark.
- Spark's parallel processing model suits Scala's functional features. These include higher-order functions and immutability. They enable cleaner, more efficient code. So, developers can write elegant, short, and readable code for Spark jobs. This improves development efficiency and the performance of the apps.
- Strong Support for Big Data: Spark is often used for big data apps that process huge datasets in parallel. Scala's immutability and support for concurrency make it ideal for big data apps. They must be robust and scalable.
- High Performance: Spark is written in Scala. So, the integration is seamless. Scala's high-performance features make it a natural fit for Spark. Its code compiles to JVM bytecode. Spark is a highly optimized data processing framework.
Use Cases for Apache Spark and Scala
We've shown that Spark and Scala are a perfect match. Now, let's look at some common uses for their combination.
1. Real-Time Data Processing
With the rise of real-time analytics, we must process streaming data. Spark Streaming has become a leading tool for real-time data pipelines, built on Apache Spark. It can handle real-time data from sources such as Kafka, Flume, and HDFS.
Scala lets developers easily write efficient streaming jobs. These jobs process data as it arrives. Analyzing IoT sensor data or monitoring website users requires speed. Spark and Scala provide the needed speed and scale for real-time data processing.
2. Batch Data Processing
Spark excels at batch processing. It manages large datasets by processing them in parallel. Spark's in-memory computing speeds up batch jobs on vast datasets. It is much faster than traditional systems like Hadoop MapReduce.
Scala's features, like map, reduce, and filter, are great for short, efficient batch jobs. They're functional. Spark can process logs, transactional data, and large datasets. It is much faster than conventional tools.
3. Machine Learning with Spark MLlib
Apache Spark includes MLlib, a scalable library for machine learning. It can do classification, regression, clustering, and collaborative filtering. Scala makes it easy to use MLlib. It has concise syntax and can integrate complex algorithms.
Data scientists and engineers can use Spark's power It is capable of training machine learning models on vast datasets. Scala's functional nature helps ensure that models are efficient and fast. They must function effectively in a distributed setting.
4. Graph Processing with GraphX
For complex graph-based computations, Spark provides GraphX, a distributed graph processing framework. This lets you rank pages, compute shortest paths, and cluster large graph datasets.
Scala's syntax, and its focus on immutability, make it ideal for graph algorithms in Spark. Developers can use Scala's built-in functions. They are a clean, maintainable way to process graph data.
Getting Started with Apache Spark and Scala
If you want to start with Apache Spark and Scala, here's a simple, step-by-step guide:
- Set Up a Spark Environment: Download and install Apache Spark. Or, set up a Spark cluster on a cloud platform (e.g., AWS, Azure, Google Cloud). You’ll need to install Java and Scala on your system as well.
- Install Spark in Scala: To use Spark with Scala, you need to install the necessary libraries. You can either use SBT (Scala Build Tool) or Maven to manage dependencies.
- Write Your First Spark Job: Once you have the environment set up, you can start by writing a simple Spark job in Scala. For example, create an RDD from a text file. Then, use transformations like map or filter. Ultimately, execute actions such as count or collect to retrieve the output.
Explore Spark Libraries: There are many libraries in Spark. They handle different data processing tasks. They include Spark SQL, MLlib, and GraphX. Each library provides unique tools for working with data in Spark
How to obtain Apache Spark and Scala Revolutionize Big Data certification?
We are an Education Technology company providing certification training courses to accelerate careers of working professionals worldwide. We impart training through instructor-led classroom workshops, instructor-led live virtual training sessions, and self-paced e-learning courses.
We have successfully conducted training sessions in 108 countries across the globe and enabled thousands of working professionals to enhance the scope of their careers.
Our enterprise training portfolio includes in-demand and globally recognized certification training courses in Project Management, Quality Management, Business Analysis, IT Service Management, Agile and Scrum, Cyber Security, Data Science, and Emerging Technologies. Download our Enterprise Training Catalog from https://www.icertglobal.com/corporate-training-for-enterprises.php and https://www.icertglobal.com/index.php
Popular Courses include:
-
Project Management: PMP, CAPM ,PMI RMP
-
Quality Management: Six Sigma Black Belt ,Lean Six Sigma Green Belt, Lean Management, Minitab,CMMI
-
Business Analysis: CBAP, CCBA, ECBA
-
Agile Training: PMI-ACP , CSM , CSPO
-
Scrum Training: CSM
-
DevOps
-
Program Management: PgMP
-
Cloud Technology: Exin Cloud Computing
-
Citrix Client Adminisration: Citrix Cloud Administration
The 10 top-paying certifications to target in 2025 are:
Conclusion
Apache Spark and Scala are a great combo. They help build efficient, scalable big data apps. Spark can process huge amounts of data in parallel. Scala offers a succinct syntax while also supporting functional programming. They are ideal for real-time, batch, and graph processing, and machine learning.
Data engineers and developers have the ability to tap into the full potential of big data. They can do this by knowing the strengths of Apache Spark and Scala. They can then use the speed, scalability, and flexibility of this powerful combo. For batch analytics, real-time streaming, or machine learning, use Apache Spark and Scala. They provide a solid base for your big data projects.
Contact Us For More Information:
Visit :www.icertglobal.com Email :
Creating Resilient Systems with Kafka Partitions & Replicas
In today’s fast-paced digital landscape, data is the cornerstone of every business. From real-time analytics to critical apps, data flow is vital. Apache Kafka is a distributed event-streaming platform. It is a top choice for building robust, scalable, fault-tolerant systems. Of its many features, partitions and replicas are key. They enable resilience and ensure high availability. This blog will explore how Kafka's partitions and replicas create resilient systems. We will discuss their architecture and share implementation best practices.
The Basics of Kafka’s Partitions and Replicas
What Are Partitions?
A partition in Kafka is a subdivision of a topic. Each topic can be split into partitions. Each partition is an independent, ordered log. Partitions enable Kafka to:
Scale horizontally: Kafka can handle huge data loads by spreading partitions across brokers.
- Enable parallel processing: Consumers can read from different partitions simultaneously, improving throughput.
What Are Replicas?
A replica is a copy of a partition that exists on another broker within the Kafka cluster. Each partition has one leader replica and zero or more follower replicas:
- The leader replica handles all read and write requests for a partition.
- The follower replicas stay in sync with the leader and take over in case the leader fails.
Replicas are vital for fault tolerance. They protect data if a broker crashes or goes offline.
How Kafka Uses Partitions and Replicas for Resilience
1. Fault Tolerance Through Replication
In a distributed system, hardware failures are inevitable. Kafka's replication mechanism keeps data accessible if a broker goes down.
- By default, Kafka replicates each partition across multiple brokers.
If the leader replica becomes unavailable, Kafka’s controller node promotes one of the in-sync replicas (ISRs) to be the new leader.
This design guarantees no data loss, as long as one replica is available. The system will remain operational.
2. Load Balancing with Partitions
Partitions distribute data across multiple brokers, enabling Kafka to balance the load effectively:
Producers send messages to specific partitions using a key. This ensures even data distribution.
- Assign consumers to specific partitions. This enables parallel data processing and prevents bottlenecks.
Kafka scales partitions horizontally. This lets the system handle higher workloads without losing performance.
3. High Availability
Replication ensures high availability of data:
- The system works without disruptions, even during maintenance or broker failures.
Kafka’s min.insync.replicas setting ensures a message is acknowledged only if it is written to a certain number of replicas. This enhances durability.
4. Data Durability
Kafka’s replicas work together to maintain data durability:
- All replicas in the ISR must confirm message writes, ensuring that no data is lost in transit.
Kafka's log retention policies and segment compaction help preserve data integrity over time.
Architectural Insights: How It All Fits Together
Let’s take a closer look at how partitions and replicas operate in a Kafka cluster:
Example Scenario
Imagine you have a Kafka topic named Orders with three partitions and a replication factor of 3. The setup might look like this:
- Partition 0: Leader on Broker 1, replicas on Brokers 2 and 3
- Partition 1: Leader on Broker 2, replicas on Brokers 1 and 3
- Partition 2: Leader on Broker 3, replicas on Brokers 1 and 2
Here’s how Kafka ensures resilience:
- Write operations: Producers send messages to the leader of each partition. The leader replicates the messages to the followers in the ISR.
- Read operations: Consumers fetch messages from the leader replica. If the leader fails, a follower is promoted to maintain availability.
- Broker failure: If Broker 1 goes down, Partition 0’s leadership is transferred to one of its replicas on Broker 2 or 3. Data remains accessible without downtime.
Best Practices for Leveraging Kafka’s Partitions and Replicas
1. Choose an Appropriate Partition Count
- Avoid too few partitions, as this can create bottlenecks.
- Avoid too many partitions, as it can increase overhead and degrade performance.
- Use Kafka's formula for partition count: `number of consumers <= number of partitions`. It ensures optimal parallelism.
2. Set the Right Replication Factor
- Use a replication factor of at least 3 for production environments. This ensures that your data is available even if one broker fails.
- Avoid excessively high replication factors, as they increase storage and network overhead.
3. Configure Minimum In-Sync Replicas (min.insync.replicas)
Set min.insync.replicas to at least 2. This ensures that messages are replicated to multiple brokers before acknowledging writes.
- Combine this with `acks=all` in the producer configuration for guaranteed durability.
4. Monitor and Balance the Cluster
Use Kafka’s partition reassignment tool to avoid hotspots. It will evenly redistribute partitions across brokers.
- Monitor broker and partition metrics using tools like Prometheus and Grafana.
5. Handle Consumer Group Offsets with Care
Store consumer offsets reliably. This will avoid data reprocessing or loss during failovers.
- Use Kafka’s offset reset policy judiciously to handle unexpected scenarios.
Challenges and Considerations
While partitions and replicas make Kafka resilient, they also introduce challenges:
Storage Overhead
Replication increases storage needs. Each partition's data is stored on multiple brokers. Organizations must plan for sufficient storage capacity.
Latency
Replicating data across brokers can introduce latency, especially in geographically distributed clusters. Fine-tuning configurations like linger.ms and batch.size can help mitigate this.
Balancing Scalability and Fault Tolerance
Adding too many partitions can strain the cluster, while too few can limit throughput. Striking the right balance requires careful planning and testing.
Real-World Use Cases
E-commerce Platforms
For e-commerce giants, ensuring order and inventory data availability is critical. Kafka's partitions and replicas let it handle huge traffic spikes during sales events. They also ensure fault tolerance.
Financial Systems
In financial systems, where every transaction must be logged reliably, Kafka’s replication ensures durability and compliance with strict data retention policies.
IoT Applications
IoT platforms use Kafka to process real-time sensor data. Partitions enable horizontal scalability, while replicas ensure data availability even during hardware failures.
How to obtain Apache Kafka certification?
We are an Education Technology company providing certification training courses to accelerate careers of working professionals worldwide. We impart training through instructor-led classroom workshops, instructor-led live virtual training sessions, and self-paced e-learning courses.
We have successfully conducted training sessions in 108 countries across the globe and enabled thousands of working professionals to enhance the scope of their careers.
Our enterprise training portfolio includes in-demand and globally recognized certification training courses in Project Management, Quality Management, Business Analysis, IT Service Management, Agile and Scrum, Cyber Security, Data Science, and Emerging Technologies. Download our Enterprise Training Catalog from https://www.icertglobal.com/corporate-training-for-enterprises.php and https://www.icertglobal.com/index.php
Popular Courses include:
-
Project Management: PMP, CAPM ,PMI RMP
-
Quality Management: Six Sigma Black Belt ,Lean Six Sigma Green Belt, Lean Management, Minitab,CMMI
-
Business Analysis: CBAP, CCBA, ECBA
-
Agile Training: PMI-ACP , CSM , CSPO
-
Scrum Training: CSM
-
DevOps
-
Program Management: PgMP
-
Cloud Technology: Exin Cloud Computing
-
Citrix Client Adminisration: Citrix Cloud Administration
The 10 top-paying certifications to target in 2024 are:
Conclusion
Apache Kafka’s partitions and replicas are the backbone of its resilience. These features enable horizontal scalability, fault tolerance, and high availability. They help businesses build systems that can withstand failures and scale easily. However, designing and maintaining a Kafka cluster requires careful planning. This includes selecting the right partition count and fine-tuning replication settings.
By using best practices and knowing the nuances of partitions and replicas, organizations can unlock Kafka's full potential. This will ensure a reliable, robust foundation for their data-driven applications. Kafka's architecture has you covered. It suits both real-time analytics and mission-critical systems.
Contact Us For More Information:
Visit :www.icertglobal.com Email :
Read More
In today’s fast-paced digital landscape, data is the cornerstone of every business. From real-time analytics to critical apps, data flow is vital. Apache Kafka is a distributed event-streaming platform. It is a top choice for building robust, scalable, fault-tolerant systems. Of its many features, partitions and replicas are key. They enable resilience and ensure high availability. This blog will explore how Kafka's partitions and replicas create resilient systems. We will discuss their architecture and share implementation best practices.
The Basics of Kafka’s Partitions and Replicas
What Are Partitions?
A partition in Kafka is a subdivision of a topic. Each topic can be split into partitions. Each partition is an independent, ordered log. Partitions enable Kafka to:
Scale horizontally: Kafka can handle huge data loads by spreading partitions across brokers.
- Enable parallel processing: Consumers can read from different partitions simultaneously, improving throughput.
What Are Replicas?
A replica is a copy of a partition that exists on another broker within the Kafka cluster. Each partition has one leader replica and zero or more follower replicas:
- The leader replica handles all read and write requests for a partition.
- The follower replicas stay in sync with the leader and take over in case the leader fails.
Replicas are vital for fault tolerance. They protect data if a broker crashes or goes offline.
How Kafka Uses Partitions and Replicas for Resilience
1. Fault Tolerance Through Replication
In a distributed system, hardware failures are inevitable. Kafka's replication mechanism keeps data accessible if a broker goes down.
- By default, Kafka replicates each partition across multiple brokers.
If the leader replica becomes unavailable, Kafka’s controller node promotes one of the in-sync replicas (ISRs) to be the new leader.
This design guarantees no data loss, as long as one replica is available. The system will remain operational.
2. Load Balancing with Partitions
Partitions distribute data across multiple brokers, enabling Kafka to balance the load effectively:
Producers send messages to specific partitions using a key. This ensures even data distribution.
- Assign consumers to specific partitions. This enables parallel data processing and prevents bottlenecks.
Kafka scales partitions horizontally. This lets the system handle higher workloads without losing performance.
3. High Availability
Replication ensures high availability of data:
- The system works without disruptions, even during maintenance or broker failures.
Kafka’s min.insync.replicas setting ensures a message is acknowledged only if it is written to a certain number of replicas. This enhances durability.
4. Data Durability
Kafka’s replicas work together to maintain data durability:
- All replicas in the ISR must confirm message writes, ensuring that no data is lost in transit.
Kafka's log retention policies and segment compaction help preserve data integrity over time.
Architectural Insights: How It All Fits Together
Let’s take a closer look at how partitions and replicas operate in a Kafka cluster:
Example Scenario
Imagine you have a Kafka topic named Orders with three partitions and a replication factor of 3. The setup might look like this:
- Partition 0: Leader on Broker 1, replicas on Brokers 2 and 3
- Partition 1: Leader on Broker 2, replicas on Brokers 1 and 3
- Partition 2: Leader on Broker 3, replicas on Brokers 1 and 2
Here’s how Kafka ensures resilience:
- Write operations: Producers send messages to the leader of each partition. The leader replicates the messages to the followers in the ISR.
- Read operations: Consumers fetch messages from the leader replica. If the leader fails, a follower is promoted to maintain availability.
- Broker failure: If Broker 1 goes down, Partition 0’s leadership is transferred to one of its replicas on Broker 2 or 3. Data remains accessible without downtime.
Best Practices for Leveraging Kafka’s Partitions and Replicas
1. Choose an Appropriate Partition Count
- Avoid too few partitions, as this can create bottlenecks.
- Avoid too many partitions, as it can increase overhead and degrade performance.
- Use Kafka's formula for partition count: `number of consumers <= number of partitions`. It ensures optimal parallelism.
2. Set the Right Replication Factor
- Use a replication factor of at least 3 for production environments. This ensures that your data is available even if one broker fails.
- Avoid excessively high replication factors, as they increase storage and network overhead.
3. Configure Minimum In-Sync Replicas (min.insync.replicas)
Set min.insync.replicas to at least 2. This ensures that messages are replicated to multiple brokers before acknowledging writes.
- Combine this with `acks=all` in the producer configuration for guaranteed durability.
4. Monitor and Balance the Cluster
Use Kafka’s partition reassignment tool to avoid hotspots. It will evenly redistribute partitions across brokers.
- Monitor broker and partition metrics using tools like Prometheus and Grafana.
5. Handle Consumer Group Offsets with Care
Store consumer offsets reliably. This will avoid data reprocessing or loss during failovers.
- Use Kafka’s offset reset policy judiciously to handle unexpected scenarios.
Challenges and Considerations
While partitions and replicas make Kafka resilient, they also introduce challenges:
Storage Overhead
Replication increases storage needs. Each partition's data is stored on multiple brokers. Organizations must plan for sufficient storage capacity.
Latency
Replicating data across brokers can introduce latency, especially in geographically distributed clusters. Fine-tuning configurations like linger.ms and batch.size can help mitigate this.
Balancing Scalability and Fault Tolerance
Adding too many partitions can strain the cluster, while too few can limit throughput. Striking the right balance requires careful planning and testing.
Real-World Use Cases
E-commerce Platforms
For e-commerce giants, ensuring order and inventory data availability is critical. Kafka's partitions and replicas let it handle huge traffic spikes during sales events. They also ensure fault tolerance.
Financial Systems
In financial systems, where every transaction must be logged reliably, Kafka’s replication ensures durability and compliance with strict data retention policies.
IoT Applications
IoT platforms use Kafka to process real-time sensor data. Partitions enable horizontal scalability, while replicas ensure data availability even during hardware failures.
How to obtain Apache Kafka certification?
We are an Education Technology company providing certification training courses to accelerate careers of working professionals worldwide. We impart training through instructor-led classroom workshops, instructor-led live virtual training sessions, and self-paced e-learning courses.
We have successfully conducted training sessions in 108 countries across the globe and enabled thousands of working professionals to enhance the scope of their careers.
Our enterprise training portfolio includes in-demand and globally recognized certification training courses in Project Management, Quality Management, Business Analysis, IT Service Management, Agile and Scrum, Cyber Security, Data Science, and Emerging Technologies. Download our Enterprise Training Catalog from https://www.icertglobal.com/corporate-training-for-enterprises.php and https://www.icertglobal.com/index.php
Popular Courses include:
-
Project Management: PMP, CAPM ,PMI RMP
-
Quality Management: Six Sigma Black Belt ,Lean Six Sigma Green Belt, Lean Management, Minitab,CMMI
-
Business Analysis: CBAP, CCBA, ECBA
-
Agile Training: PMI-ACP , CSM , CSPO
-
Scrum Training: CSM
-
DevOps
-
Program Management: PgMP
-
Cloud Technology: Exin Cloud Computing
-
Citrix Client Adminisration: Citrix Cloud Administration
The 10 top-paying certifications to target in 2024 are:
Conclusion
Apache Kafka’s partitions and replicas are the backbone of its resilience. These features enable horizontal scalability, fault tolerance, and high availability. They help businesses build systems that can withstand failures and scale easily. However, designing and maintaining a Kafka cluster requires careful planning. This includes selecting the right partition count and fine-tuning replication settings.
By using best practices and knowing the nuances of partitions and replicas, organizations can unlock Kafka's full potential. This will ensure a reliable, robust foundation for their data-driven applications. Kafka's architecture has you covered. It suits both real-time analytics and mission-critical systems.
Contact Us For More Information:
Visit :www.icertglobal.com Email :

TinyML: Machine Learning on Edge Devices for Solutions!
In recent years, demand for smarter, faster, energy-efficient tech has soared. This has given rise to a new frontier in machine learning: TinyML. TinyML, or Tiny Machine Learning, is using ML on low-resource edge devices. These devices include microcontrollers, sensors, and other small hardware. They operate with limited power and memory.
TinyML marks a huge shift in our tech interactions. It enables smart functions on devices without needing constant cloud access. This blog covers the basics of TinyML. It looks at its uses, challenges, and potential to transform industries.
What is TinyML?
TinyML is a subfield of machine learning. It focuses on deploying models on ultra-low-power devices. Traditional machine learning models need a lot of computing power. They often rely on cloud servers to process data and return results. However, TinyML brings machine learning to the edge. It enables devices to process data locally, without sending it to a central server.
This localized processing has several advantages:
- Reduced Latency: Processing data on-device ensures faster responses, critical for real-time applications.
- Energy Efficiency: TinyML models run on low-power devices, like battery-operated sensors.
- Enhanced Privacy: Processing data locally reduces the risk of exposing sensitive information over networks.
- Offline Functionality: Edge devices can work without constant internet. They are ideal for remote or inaccessible locations.
How Does TinyML Work?
TinyML is, at its core, about compressing machine learning models. This makes them fit edge devices' limits. This is achieved through techniques such as:
1. Model Quantization:
It reduces the precision of the model's parameters (e.g., from 32-bit to 8-bit integers). This lowers memory and computation needs.
2. Pruning:
It removes redundant or less important parts of the model. This reduces its size and complexity.
3. Knowledge Distillation:
It involves training a smaller model, the "student," to mimic a larger, more complex one, the "teacher.""
4. Hardware Optimization:
- Tailoring models to specific hardware, such as using accelerators for efficient inference.
Once optimized, these models are deployed on microcontrollers or other edge devices. They perform inference tasks using locally collected data.
Applications of TinyML
TinyML's versatility suits many applications across various industries. Some prominent use cases include:
1. Healthcare
Wearable Devices: TinyML powers smartwatches and fitness trackers. It enables real-time analysis of vital signs, like heart rate, oxygen levels, and sleep.
- Remote Diagnostics: TinyML-equipped devices can analyse medical data in real-time. They can detect conditions like arrhythmia or diabetes early, without cloud processing.
2. Agriculture
- Precision Farming: TinyML sensors can monitor soil moisture, temperature, and crop health. They can optimize irrigation and fertilizer use.
- Pest Detection: Edge devices can identify pests in real-time. This enables timely action to protect crops.
3. Industrial Automation
- Predictive Maintenance: TinyML sensors can monitor machinery. They track vibrations, temperature, and other factors. This can predict failures and reduce downtime.
- Quality Control: Real-time analysis of production processes ensures quality, without disrupting workflows.
4. Consumer Electronics
- Smart Home Devices: TinyML powers voice assistants and smart devices. It enables their smart features while keeping user data private.
- Gaming and Entertainment: TinyML-enabled devices can enhance user experiences. They can provide personalized content and responsive gameplay.
5. Environmental Monitoring
- Air Quality Sensors: TinyML models can detect pollutants. They provide insights to improve indoor and outdoor air quality.
Wildlife Conservation: TinyML edge devices can monitor animals and detect poaching. They can also track environmental changes in real-time.
Advantages of TinyML
The adoption of TinyML offers numerous benefits:
1. Cost-Effectiveness:
- By eliminating the need for expensive cloud infrastructure, TinyML reduces operational costs.
2. Scalability:
TinyML devices are lightweight and easy to deploy. So, they suit large-scale apps like IoT networks.
3. Eco-Friendliness:
- Energy-efficient models contribute to sustainability by minimizing power consumption.
4. Enhanced Security:
- Localized data processing reduces exposure to potential cyber threats during data transmission.
Challenges in TinyML
Despite its potential, TinyML faces several challenges:
1. Hardware Constraints:
Edge devices have limited power, memory, and energy. They need highly optimized models.
2. Model Accuracy:
Simplifying models to fit hardware limits can reduce accuracy, especially for complex tasks.
3. Development Complexity:
- Developing TinyML apps requires skills in machine learning and embedded systems. This poses a steep learning curve.
4. Scalability of Updates:
Updating models on millions of edge devices is hard and costly.
5. Interoperability:
TinyML applications must work on diverse hardware. It's a challenge to ensure they do.
The Future of TinyML
TinyML has a bright future. Advancements in hardware and software are driving its adoption. Key trends shaping its trajectory include:
1. Edge AI Chips:
Specialized chips, like Google's Edge TPU and NVIDIA's Jetson Nano, will boost TinyML.
2. Open-Source Frameworks:
Tools like TensorFlow Lite for Microcontrollers and Edge Impulse are making TinyML development easier for developers everywhere.
3. Integration with 5G:
Combining TinyML with 5G will enable seamless edge-to-cloud integration. This will enhance IoT systems.
4. Sustainability Initiatives:
TinyML's energy efficiency supports global carbon reduction efforts. So, it's vital to sustainable tech.
5. Broader Industry Adoption:
As industries adopt IoT and AI, TinyML will drive innovations in smart cities, healthcare, and farming.
How to obtain Data Science certification?
We are an Education Technology company providing certification training courses to accelerate careers of working professionals worldwide. We impart training through instructor-led classroom workshops, instructor-led live virtual training sessions, and self-paced e-learning courses.
We have successfully conducted training sessions in 108 countries across the globe and enabled thousands of working professionals to enhance the scope of their careers.
Our enterprise training portfolio includes in-demand and globally recognized certification training courses in Project Management, Quality Management, Business Analysis, IT Service Management, Agile and Scrum, Cyber Security, Data Science, and Emerging Technologies. Download our Enterprise Training Catalog from https://www.icertglobal.com/corporate-training-for-enterprises.php and https://www.icertglobal.com/index.php
Popular Courses include:
-
Project Management: PMP, CAPM ,PMI RMP
-
Quality Management: Six Sigma Black Belt ,Lean Six Sigma Green Belt, Lean Management, Minitab,CMMI
-
Business Analysis: CBAP, CCBA, ECBA
-
Agile Training: PMI-ACP , CSM , CSPO
-
Scrum Training: CSM
-
DevOps
-
Program Management: PgMP
-
Cloud Technology: Exin Cloud Computing
-
Citrix Client Adminisration: Citrix Cloud Administration
The 10 top-paying certifications to target in 2024 are:
Conclusion
TinyML is revolutionizing the way we think about machine learning and edge computing. It enables smart functions on low-power devices. It bridges the gap between advanced AI and real-world limits. While challenges remain, tools and frameworks are improving. So, TinyML will be key to the future of technology.
As industries explore its potential, TinyML promises new possibilities. It will make our devices smarter, our lives efficient, and our tech sustainable.
Contact Us For More Information:
Visit :www.icertglobal.com Email :
Read More
In recent years, demand for smarter, faster, energy-efficient tech has soared. This has given rise to a new frontier in machine learning: TinyML. TinyML, or Tiny Machine Learning, is using ML on low-resource edge devices. These devices include microcontrollers, sensors, and other small hardware. They operate with limited power and memory.
TinyML marks a huge shift in our tech interactions. It enables smart functions on devices without needing constant cloud access. This blog covers the basics of TinyML. It looks at its uses, challenges, and potential to transform industries.
What is TinyML?
TinyML is a subfield of machine learning. It focuses on deploying models on ultra-low-power devices. Traditional machine learning models need a lot of computing power. They often rely on cloud servers to process data and return results. However, TinyML brings machine learning to the edge. It enables devices to process data locally, without sending it to a central server.
This localized processing has several advantages:
- Reduced Latency: Processing data on-device ensures faster responses, critical for real-time applications.
- Energy Efficiency: TinyML models run on low-power devices, like battery-operated sensors.
- Enhanced Privacy: Processing data locally reduces the risk of exposing sensitive information over networks.
- Offline Functionality: Edge devices can work without constant internet. They are ideal for remote or inaccessible locations.
How Does TinyML Work?
TinyML is, at its core, about compressing machine learning models. This makes them fit edge devices' limits. This is achieved through techniques such as:
1. Model Quantization:
It reduces the precision of the model's parameters (e.g., from 32-bit to 8-bit integers). This lowers memory and computation needs.
2. Pruning:
It removes redundant or less important parts of the model. This reduces its size and complexity.
3. Knowledge Distillation:
It involves training a smaller model, the "student," to mimic a larger, more complex one, the "teacher.""
4. Hardware Optimization:
- Tailoring models to specific hardware, such as using accelerators for efficient inference.
Once optimized, these models are deployed on microcontrollers or other edge devices. They perform inference tasks using locally collected data.
Applications of TinyML
TinyML's versatility suits many applications across various industries. Some prominent use cases include:
1. Healthcare
Wearable Devices: TinyML powers smartwatches and fitness trackers. It enables real-time analysis of vital signs, like heart rate, oxygen levels, and sleep.
- Remote Diagnostics: TinyML-equipped devices can analyse medical data in real-time. They can detect conditions like arrhythmia or diabetes early, without cloud processing.
2. Agriculture
- Precision Farming: TinyML sensors can monitor soil moisture, temperature, and crop health. They can optimize irrigation and fertilizer use.
- Pest Detection: Edge devices can identify pests in real-time. This enables timely action to protect crops.
3. Industrial Automation
- Predictive Maintenance: TinyML sensors can monitor machinery. They track vibrations, temperature, and other factors. This can predict failures and reduce downtime.
- Quality Control: Real-time analysis of production processes ensures quality, without disrupting workflows.
4. Consumer Electronics
- Smart Home Devices: TinyML powers voice assistants and smart devices. It enables their smart features while keeping user data private.
- Gaming and Entertainment: TinyML-enabled devices can enhance user experiences. They can provide personalized content and responsive gameplay.
5. Environmental Monitoring
- Air Quality Sensors: TinyML models can detect pollutants. They provide insights to improve indoor and outdoor air quality.
Wildlife Conservation: TinyML edge devices can monitor animals and detect poaching. They can also track environmental changes in real-time.
Advantages of TinyML
The adoption of TinyML offers numerous benefits:
1. Cost-Effectiveness:
- By eliminating the need for expensive cloud infrastructure, TinyML reduces operational costs.
2. Scalability:
TinyML devices are lightweight and easy to deploy. So, they suit large-scale apps like IoT networks.
3. Eco-Friendliness:
- Energy-efficient models contribute to sustainability by minimizing power consumption.
4. Enhanced Security:
- Localized data processing reduces exposure to potential cyber threats during data transmission.
Challenges in TinyML
Despite its potential, TinyML faces several challenges:
1. Hardware Constraints:
Edge devices have limited power, memory, and energy. They need highly optimized models.
2. Model Accuracy:
Simplifying models to fit hardware limits can reduce accuracy, especially for complex tasks.
3. Development Complexity:
- Developing TinyML apps requires skills in machine learning and embedded systems. This poses a steep learning curve.
4. Scalability of Updates:
Updating models on millions of edge devices is hard and costly.
5. Interoperability:
TinyML applications must work on diverse hardware. It's a challenge to ensure they do.
The Future of TinyML
TinyML has a bright future. Advancements in hardware and software are driving its adoption. Key trends shaping its trajectory include:
1. Edge AI Chips:
Specialized chips, like Google's Edge TPU and NVIDIA's Jetson Nano, will boost TinyML.
2. Open-Source Frameworks:
Tools like TensorFlow Lite for Microcontrollers and Edge Impulse are making TinyML development easier for developers everywhere.
3. Integration with 5G:
Combining TinyML with 5G will enable seamless edge-to-cloud integration. This will enhance IoT systems.
4. Sustainability Initiatives:
TinyML's energy efficiency supports global carbon reduction efforts. So, it's vital to sustainable tech.
5. Broader Industry Adoption:
As industries adopt IoT and AI, TinyML will drive innovations in smart cities, healthcare, and farming.
How to obtain Data Science certification?
We are an Education Technology company providing certification training courses to accelerate careers of working professionals worldwide. We impart training through instructor-led classroom workshops, instructor-led live virtual training sessions, and self-paced e-learning courses.
We have successfully conducted training sessions in 108 countries across the globe and enabled thousands of working professionals to enhance the scope of their careers.
Our enterprise training portfolio includes in-demand and globally recognized certification training courses in Project Management, Quality Management, Business Analysis, IT Service Management, Agile and Scrum, Cyber Security, Data Science, and Emerging Technologies. Download our Enterprise Training Catalog from https://www.icertglobal.com/corporate-training-for-enterprises.php and https://www.icertglobal.com/index.php
Popular Courses include:
-
Project Management: PMP, CAPM ,PMI RMP
-
Quality Management: Six Sigma Black Belt ,Lean Six Sigma Green Belt, Lean Management, Minitab,CMMI
-
Business Analysis: CBAP, CCBA, ECBA
-
Agile Training: PMI-ACP , CSM , CSPO
-
Scrum Training: CSM
-
DevOps
-
Program Management: PgMP
-
Cloud Technology: Exin Cloud Computing
-
Citrix Client Adminisration: Citrix Cloud Administration
The 10 top-paying certifications to target in 2024 are:
Conclusion
TinyML is revolutionizing the way we think about machine learning and edge computing. It enables smart functions on low-power devices. It bridges the gap between advanced AI and real-world limits. While challenges remain, tools and frameworks are improving. So, TinyML will be key to the future of technology.
As industries explore its potential, TinyML promises new possibilities. It will make our devices smarter, our lives efficient, and our tech sustainable.
Contact Us For More Information:
Visit :www.icertglobal.com Email :
.webp)
Power BI The Ultimate Tool for Data Driven Decision Making
In our data-centric era, transforming raw information into actionable insights swiftly is essential. They must be actionable. Businesses are generating vast amounts of data. But, without the right tools to analyze it, that data is just noise. This is where Power BI, Microsoft's robust business intelligence solution, proves invaluable. Power BI helps businesses visualize data. It enables informed decisions and drives success. This blog will explore how Power BI unlocks business insights. It is essential for data-driven decision-making.
What is Power BI?
Power BI (Business Intelligence) is a Microsoft toolset. It converts raw data into dynamic and insightful visual representations. It lets users connect to data sources, clean and transform data, create reports, and share insights across the organization. Power BI enables businesses to analyze and visualize data instantly. This helps you make faster, better decisions.
Key Features of Power BI:
- Data Integration: Power BI seamlessly connects to a wide range of data sources. These include databases, cloud services, and Excel spreadsheets. It can even use real-time data feeds.
- Data Modeling and Transformation: Power BI enables users to cleanse and structure their data using tools like Power Query and DAX (Data Analysis Expressions).
- Interactive Visualizations: The tool has many interactive visualizations. They include bar charts, line graphs, maps, and gauges. They make it easy for users to explore data.
- Dashboards: With Power BI, you can create custom dashboards. They will show key metrics and trends in real-time.
- Sharing and Collaboration: You can easily share Power BI reports and dashboards. This supports collaboration and leads to better decisions.
Why Power BI is Essential for Data-Driven Decisions
Data-driven decision-making means using data, not gut feelings, to make business decisions. Power BI is vital. It gives businesses the tools to interpret data effectively. Here are several reasons why Power BI is essential for data-driven decision-making:
1. Real-Time Data Access
Power BI connects to data in real-time. It lets businesses access up-to-date info whenever they need it. For example, if you run an online store, you can watch sales, inventory, and customers in real-time. Real-time data lets businesses quickly adjust to changes and seize new opportunities.
2. Simplifying Complex Data
Business data can be highly complex, with multiple sources, formats, and volumes. Power BI simplifies this by aggregating data from various sources. It delivers the information through a unified, user-friendly interface. Its powerful data tools, like Power Query, let users clean and manipulate data. This ensures it is accurate and consistent. It offers a comprehensive and transparent view of the business environment.
3. Customizable Visualizations
The presentation of data plays a crucial role in influencing decision-making. Power BI has many customizable visualizations. They help present data clearly. Users can view charts and heat maps instead of sifting through rows of numbers. They visualize the data and highlight trends, anomalies, and outliers. These visuals let decision-makers quickly grasp complex data. They can then make better choices.
4. Collaboration Across Teams
Business intelligence is not just about the individual. Power BI lets teams collaborate on reports and dashboards. It makes it easy to share insights across departments and stakeholders. Power BI's sharing features boost collaboration. They align teams on data that drives decisions. This applies to a marketing team and a finance team. The marketing team analyzes campaign performance. The finance team reviews metrics.
5. Data-Driven Predictions
Power BI has powerful analytics. They let businesses move beyond past analysis. Now, they can make data-driven predictions. Power BI can predict future trends using past data. It does this with built-in machine learning models and forecasting tools. It lets businesses predict outcomes. So, they can plan, reduce risks, and seize new opportunities.
6. Cost-Effective and Scalable
Power BI is cheap for businesses of all sizes, from startups to large firms. Power BI Desktop is free. Power BI Pro and Premium have low-cost models. So, it is accessible to many organizations. Also, Power BI's cloud-based system lets businesses scale their analytics as they grow. They won't have to invest in costly infrastructure.
Use Cases of Power BI in Business
Power BI is versatile. It works in many industries and business functions. Below are some typical applications of Power BI:
1. Sales and Marketing Analytics
Power BI is an invaluable tool for sales and marketing teams. Integrating Power BI with CRMs like Salesforce or HubSpot can create great reports. These reports track sales, customer behavior, leads, and marketing campaigns. Teams can easily analyze customer trends and sales data. This lets them adjust strategies to better target customers and boost sales.
2. Financial Reporting and Analysis
Financial teams use Power BI to track key metrics. These include revenue, expenses, cash flow, and profit margins. Power BI helps CFOs and analysts understand their finances. It merges data from multiple sources into a single view. Interactive dashboards let them drill down into data points. They can then perform detailed financial analyses. This simplifies the process of generating precise reports and predictions.
3. Human Resources Management
HR uses Power BI to analyze employee performance, retention, payroll, and recruitment data. HR can use Power BI to spot trends in engagement, turnover, and recruitment. It helps them make data-driven decisions on hiring, employee development, and compensation.
4. Supply Chain and Operations
Power BI tracks inventory, order fulfillment, and logistics for supply chain and operations teams. Real-time data can help businesses. It can optimize inventory, reduce stockouts, and streamline operations. Visualizations help identify inefficiencies in the supply chain, enabling decision-makers to address bottlenecks and improve operational performance.
Getting Started with Power BI
To get started with Power BI, follow these basic steps:
- Download and Install Power BI Desktop: It is a free tool. You can install it on your computer. It’s a great starting point for creating reports and visualizations.
- Connect to Data Sources: Power BI supports many data sources. These include Excel files, SQL databases, cloud services (like Azure), and web data.
- Create Reports and Dashboards: Use Power BI's intuitive drag-and-drop interface. It lets you create interactive reports and dashboards for your business needs.
- After creating your reports, you can publish them to Power BI Service (cloud-based) and share them with colleagues or clients.
- Keep Learning: Power BI is a robust tool with many advanced features. Explore and learn more about its capabilities using Microsoft's resources and forums.
How to obtain Power BI certification?
We are an Education Technology company providing certification training courses to accelerate careers of working professionals worldwide. We impart training through instructor-led classroom workshops, instructor-led live virtual training sessions, and self-paced e-learning courses.
We have successfully conducted training sessions in 108 countries across the globe and enabled thousands of working professionals to enhance the scope of their careers.
Our enterprise training portfolio includes in-demand and globally recognized certification training courses in Project Management, Quality Management, Business Analysis, IT Service Management, Agile and Scrum, Cyber Security, Data Science, and Emerging Technologies. Download our Enterprise Training Catalog from https://www.icertglobal.com/corporate-training-for-enterprises.php and https://www.icertglobal.com/index.php
Popular Courses include:
-
Project Management: PMP, CAPM ,PMI RMP
-
Quality Management: Six Sigma Black Belt ,Lean Six Sigma Green Belt, Lean Management, Minitab,CMMI
-
Business Analysis: CBAP, CCBA, ECBA
-
Agile Training: PMI-ACP , CSM , CSPO
-
Scrum Training: CSM
-
DevOps
-
Program Management: PgMP
-
Cloud Technology: Exin Cloud Computing
-
Citrix Client Adminisration: Citrix Cloud Administration
The 10 top-paying certifications to target in 2025 are:
Conclusion
Power BI is revolutionizing the way businesses analyze and interpret data. Power BI benefits users to create interactive visualizations and access real-time data. It also lets teams collaborate. This helps businesses make data-driven decisions. It improves performance, increases efficiency, and drives growth. No matter your field, Power BI can help. It has tools to unlock insights and give you a competitive edge.
Power BI is the best tool to turn your data into insights. Explore its features today. Start your journey to data-driven decisions.
Contact Us For More Information:
Visit :www.icertglobal.com Email :
Read More
In our data-centric era, transforming raw information into actionable insights swiftly is essential. They must be actionable. Businesses are generating vast amounts of data. But, without the right tools to analyze it, that data is just noise. This is where Power BI, Microsoft's robust business intelligence solution, proves invaluable. Power BI helps businesses visualize data. It enables informed decisions and drives success. This blog will explore how Power BI unlocks business insights. It is essential for data-driven decision-making.
What is Power BI?
Power BI (Business Intelligence) is a Microsoft toolset. It converts raw data into dynamic and insightful visual representations. It lets users connect to data sources, clean and transform data, create reports, and share insights across the organization. Power BI enables businesses to analyze and visualize data instantly. This helps you make faster, better decisions.
Key Features of Power BI:
- Data Integration: Power BI seamlessly connects to a wide range of data sources. These include databases, cloud services, and Excel spreadsheets. It can even use real-time data feeds.
- Data Modeling and Transformation: Power BI enables users to cleanse and structure their data using tools like Power Query and DAX (Data Analysis Expressions).
- Interactive Visualizations: The tool has many interactive visualizations. They include bar charts, line graphs, maps, and gauges. They make it easy for users to explore data.
- Dashboards: With Power BI, you can create custom dashboards. They will show key metrics and trends in real-time.
- Sharing and Collaboration: You can easily share Power BI reports and dashboards. This supports collaboration and leads to better decisions.
Why Power BI is Essential for Data-Driven Decisions
Data-driven decision-making means using data, not gut feelings, to make business decisions. Power BI is vital. It gives businesses the tools to interpret data effectively. Here are several reasons why Power BI is essential for data-driven decision-making:
1. Real-Time Data Access
Power BI connects to data in real-time. It lets businesses access up-to-date info whenever they need it. For example, if you run an online store, you can watch sales, inventory, and customers in real-time. Real-time data lets businesses quickly adjust to changes and seize new opportunities.
2. Simplifying Complex Data
Business data can be highly complex, with multiple sources, formats, and volumes. Power BI simplifies this by aggregating data from various sources. It delivers the information through a unified, user-friendly interface. Its powerful data tools, like Power Query, let users clean and manipulate data. This ensures it is accurate and consistent. It offers a comprehensive and transparent view of the business environment.
3. Customizable Visualizations
The presentation of data plays a crucial role in influencing decision-making. Power BI has many customizable visualizations. They help present data clearly. Users can view charts and heat maps instead of sifting through rows of numbers. They visualize the data and highlight trends, anomalies, and outliers. These visuals let decision-makers quickly grasp complex data. They can then make better choices.
4. Collaboration Across Teams
Business intelligence is not just about the individual. Power BI lets teams collaborate on reports and dashboards. It makes it easy to share insights across departments and stakeholders. Power BI's sharing features boost collaboration. They align teams on data that drives decisions. This applies to a marketing team and a finance team. The marketing team analyzes campaign performance. The finance team reviews metrics.
5. Data-Driven Predictions
Power BI has powerful analytics. They let businesses move beyond past analysis. Now, they can make data-driven predictions. Power BI can predict future trends using past data. It does this with built-in machine learning models and forecasting tools. It lets businesses predict outcomes. So, they can plan, reduce risks, and seize new opportunities.
6. Cost-Effective and Scalable
Power BI is cheap for businesses of all sizes, from startups to large firms. Power BI Desktop is free. Power BI Pro and Premium have low-cost models. So, it is accessible to many organizations. Also, Power BI's cloud-based system lets businesses scale their analytics as they grow. They won't have to invest in costly infrastructure.
Use Cases of Power BI in Business
Power BI is versatile. It works in many industries and business functions. Below are some typical applications of Power BI:
1. Sales and Marketing Analytics
Power BI is an invaluable tool for sales and marketing teams. Integrating Power BI with CRMs like Salesforce or HubSpot can create great reports. These reports track sales, customer behavior, leads, and marketing campaigns. Teams can easily analyze customer trends and sales data. This lets them adjust strategies to better target customers and boost sales.
2. Financial Reporting and Analysis
Financial teams use Power BI to track key metrics. These include revenue, expenses, cash flow, and profit margins. Power BI helps CFOs and analysts understand their finances. It merges data from multiple sources into a single view. Interactive dashboards let them drill down into data points. They can then perform detailed financial analyses. This simplifies the process of generating precise reports and predictions.
3. Human Resources Management
HR uses Power BI to analyze employee performance, retention, payroll, and recruitment data. HR can use Power BI to spot trends in engagement, turnover, and recruitment. It helps them make data-driven decisions on hiring, employee development, and compensation.
4. Supply Chain and Operations
Power BI tracks inventory, order fulfillment, and logistics for supply chain and operations teams. Real-time data can help businesses. It can optimize inventory, reduce stockouts, and streamline operations. Visualizations help identify inefficiencies in the supply chain, enabling decision-makers to address bottlenecks and improve operational performance.
Getting Started with Power BI
To get started with Power BI, follow these basic steps:
- Download and Install Power BI Desktop: It is a free tool. You can install it on your computer. It’s a great starting point for creating reports and visualizations.
- Connect to Data Sources: Power BI supports many data sources. These include Excel files, SQL databases, cloud services (like Azure), and web data.
- Create Reports and Dashboards: Use Power BI's intuitive drag-and-drop interface. It lets you create interactive reports and dashboards for your business needs.
- After creating your reports, you can publish them to Power BI Service (cloud-based) and share them with colleagues or clients.
- Keep Learning: Power BI is a robust tool with many advanced features. Explore and learn more about its capabilities using Microsoft's resources and forums.
How to obtain Power BI certification?
We are an Education Technology company providing certification training courses to accelerate careers of working professionals worldwide. We impart training through instructor-led classroom workshops, instructor-led live virtual training sessions, and self-paced e-learning courses.
We have successfully conducted training sessions in 108 countries across the globe and enabled thousands of working professionals to enhance the scope of their careers.
Our enterprise training portfolio includes in-demand and globally recognized certification training courses in Project Management, Quality Management, Business Analysis, IT Service Management, Agile and Scrum, Cyber Security, Data Science, and Emerging Technologies. Download our Enterprise Training Catalog from https://www.icertglobal.com/corporate-training-for-enterprises.php and https://www.icertglobal.com/index.php
Popular Courses include:
-
Project Management: PMP, CAPM ,PMI RMP
-
Quality Management: Six Sigma Black Belt ,Lean Six Sigma Green Belt, Lean Management, Minitab,CMMI
-
Business Analysis: CBAP, CCBA, ECBA
-
Agile Training: PMI-ACP , CSM , CSPO
-
Scrum Training: CSM
-
DevOps
-
Program Management: PgMP
-
Cloud Technology: Exin Cloud Computing
-
Citrix Client Adminisration: Citrix Cloud Administration
The 10 top-paying certifications to target in 2025 are:
Conclusion
Power BI is revolutionizing the way businesses analyze and interpret data. Power BI benefits users to create interactive visualizations and access real-time data. It also lets teams collaborate. This helps businesses make data-driven decisions. It improves performance, increases efficiency, and drives growth. No matter your field, Power BI can help. It has tools to unlock insights and give you a competitive edge.
Power BI is the best tool to turn your data into insights. Explore its features today. Start your journey to data-driven decisions.
Contact Us For More Information:
Visit :www.icertglobal.com Email :
Best Strategies for Efficient Kafka Topic Partitioning!
Apache Kafka is a distributed event streaming platform. It processes large amounts of data in real-time. At the heart of Kafka’s scalability and high throughput lies its use of topics and partitions. Kafka topics are the channels for published messages. Partitions divide topics into segments for parallel processing. This improves throughput and scalability. Efficient partitioning is crucial to maximizing Kafka's performance. The right strategies for partitioning can greatly affect your Kafka deployment's performance.
This blog will explore strategies for Kafka topic partitioning. We will discuss key considerations and best practices. They will help ensure your Kafka clusters run efficiently.
Understanding Kafka Partitions
Before diving into partitioning strategies, let's understand how Kafka partitions work.
- Topic: In Kafka, a topic is a category or feed name to which records are sent by producers. Each topic can have multiple partitions.
- Partition: Each partition is a log, a sequence of messages. They are ordered by their offset (an incremental number). Kafka guarantees that, within a partition, messages are stored in the order received.
Partitions allow Kafka to scale by distributing data across multiple brokers. Each partition is stored on a single broker. But, Kafka can spread partitions across multiple brokers for load balancing and redundancy. This lets Kafka handle large data volumes. It boosts throughput and fault tolerance.
Why Partitioning Matters
Partitioning is key to achieving Kafka's scalability, fault tolerance, and high throughput. The number of partitions affects performance. It determines how data is distributed, replicated, and processed by consumers. Here are some critical reasons why partitioning is important:
- Parallel Processing: Kafka consumers can read from multiple partitions in parallel. This improves throughput and latency. This parallelism is crucial for applications requiring real-time data processing.
- Load Balancing: Distributing partitions across brokers ensures load balancing in the Kafka cluster. It prevents any single broker from becoming a bottleneck.
- Fault Tolerance: Kafka replicates partitions across brokers. This ensures high availability and fault tolerance if nodes fail.
With this understanding, let’s explore strategies to optimize Kafka topic partitioning.
1. Choosing the Right Number of Partitions
One of the first decisions in Kafka topic partitioning is how many partitions to use for each topic. This number depends on several factors. They are the expected load, the number of consumers, and the throughput requirements.
- High Throughput: To achieve high throughput, you may need more partitions. More partitions allow for more parallelism. They also better distribute the workload across brokers.
- Consumer Load: The number of partitions must match the number of consumers in the consumer group. If you have more partitions than consumers, some consumers will be idle. Conversely, if there are fewer partitions than consumers, some consumers will be underutilized.
- Replication Factor: Kafka's replication factor affects the number of partitions. Replicating each partition increases fault tolerance. But, it requires more storage and network resources.
As a rule of thumb:
More partitions (in the 100s or 1000s) improve scalability. But, they increase management complexity.
- Start with a conservative number of partitions and scale as needed.
2. Partition Key Design
Partition keys define how records are distributed across partitions. Kafka uses the partition key to assign a record to a specific partition. The key is hashed, and Kafka determines the partition based on the hash value.
Choosing the Right Partition Key:
- Uniform Distribution: For better load balancing, choose a partition key. It should distribute records uniformly across partitions. If the partitioning is skewed, it can cause bottlenecks. For example, all records going to a single partition.
- Event Characteristics: Choose a key based on the event's important traits for your use case. For example, if you're processing user data, you might choose `userId` as the key. This would ensure that all messages for a specific user are handled by the same partition.
- Event Ordering: Kafka guarantees the order of messages within a partition, but not across partitions. If event order is critical, ensure related events share the same partition key.
Example of a bad partitioning strategy:
- A timestamp or a random key can cause uneven partitions. It may also lose ordering guarantees.
Best Practices:
- Use the same partition keys to ensure that related events, like all events for a user, go to the same partition.
- Avoid over-partitioning on a small key domain, as it could lead to data skew and uneven load distribution.
3. Rebalancing Partitions
If the number of producers, consumers, or the data volume changes, Kafka may need to rebalance partitions across brokers. Rebalancing is the process of redistributing partitions. It ensures an even load and efficient use of resources.
- Dynamic Partition Rebalancing: Kafka has tools, like `kafka-reassign-partitions`, for partition reassignment when adding or removing brokers.
- Replication Factor: A high replication factor may require a rebalance. It will need reassigning replicas to ensure an even distribution across brokers.
Challenges with Rebalancing:
- Impact on Performance: Rebalancing partitions can hurt performance. Data movement can use network and disk resources.
Stateful Consumers: If you use stateful consumers in stream processing, ensure their state migrates during rebalancing.
Best Practices:
- Perform rebalancing during low-traffic periods or during planned maintenance windows.
Use automatic partition reassignment tools. Ensure your system can migrate partitions smoothly.
4. Monitor Partition Distribution
Effective partition distribution is crucial to ensure that Kafka brokers are evenly loaded. Uneven partition distribution can cause resource contention. Some brokers will handle too much data while others stay idle.
To monitor partition distribution:
- Kafka Metrics: Use Kafka's metrics and monitoring tools, like JMX, Prometheus, and Grafana. Check the partitions and their distribution across brokers.
- Rebalance Alerts: Set alerts to notify you of unevenly distributed partitions. This lets you fix the issue before it affects performance.
Best Practices:
- Regularly audit partition distribution and rebalance partitions when necessary.
- Ensure that you don’t overload any single broker by distributing partitions evenly.
5. Consider Storage and Network Limits
Kafka partitioning can also impact storage and network usage. Each partition consumes disk space and requires network bandwidth for replication. Over-partitioning can lead to unnecessary resource consumption, causing storage and network bottlenecks.
- Disk Space: Ensure that each partition has enough storage capacity. As partitions grow over time, monitoring disk usage is critical.
- Network Load: Kafka replication and data distribution use network bandwidth. More partitions increase replication traffic and the overall network load.
Best Practices:
- Monitor storage and network utilization regularly and adjust partition numbers as needed.
- Consider using tiered storage. It stores older data on cheaper, slower systems. This can reduce the impact of high partition numbers on disk.
How to obtain Apache Kafka certification?
We are an Education Technology company providing certification training courses to accelerate careers of working professionals worldwide. We impart training through instructor-led classroom workshops, instructor-led live virtual training sessions, and self-paced e-learning courses.
We have successfully conducted training sessions in 108 countries across the globe and enabled thousands of working professionals to enhance the scope of their careers.
Our enterprise training portfolio includes in-demand and globally recognized certification training courses in Project Management, Quality Management, Business Analysis, IT Service Management, Agile and Scrum, Cyber Security, Data Science, and Emerging Technologies. Download our Enterprise Training Catalog from https://www.icertglobal.com/corporate-training-for-enterprises.php and https://www.icertglobal.com/index.php
Popular Courses include:
-
Project Management: PMP, CAPM ,PMI RMP
-
Quality Management: Six Sigma Black Belt ,Lean Six Sigma Green Belt, Lean Management, Minitab,CMMI
-
Business Analysis: CBAP, CCBA, ECBA
-
Agile Training: PMI-ACP , CSM , CSPO
-
Scrum Training: CSM
-
DevOps
-
Program Management: PgMP
-
Cloud Technology: Exin Cloud Computing
-
Citrix Client Adminisration: Citrix Cloud Administration
The 10 top-paying certifications to target in 2024 are:
Conclusion
Kafka partitioning is key to configuring and managing your Kafka cluster. The right number of partitions and effective keys matter. Balanced partitions and resource use monitoring also help. They can greatly improve your Kafka system's performance and scalability.
Contact Us For More Information:
Visit :www.icertglobal.com Email :
Read More
Apache Kafka is a distributed event streaming platform. It processes large amounts of data in real-time. At the heart of Kafka’s scalability and high throughput lies its use of topics and partitions. Kafka topics are the channels for published messages. Partitions divide topics into segments for parallel processing. This improves throughput and scalability. Efficient partitioning is crucial to maximizing Kafka's performance. The right strategies for partitioning can greatly affect your Kafka deployment's performance.
This blog will explore strategies for Kafka topic partitioning. We will discuss key considerations and best practices. They will help ensure your Kafka clusters run efficiently.
Understanding Kafka Partitions
Before diving into partitioning strategies, let's understand how Kafka partitions work.
- Topic: In Kafka, a topic is a category or feed name to which records are sent by producers. Each topic can have multiple partitions.
- Partition: Each partition is a log, a sequence of messages. They are ordered by their offset (an incremental number). Kafka guarantees that, within a partition, messages are stored in the order received.
Partitions allow Kafka to scale by distributing data across multiple brokers. Each partition is stored on a single broker. But, Kafka can spread partitions across multiple brokers for load balancing and redundancy. This lets Kafka handle large data volumes. It boosts throughput and fault tolerance.
Why Partitioning Matters
Partitioning is key to achieving Kafka's scalability, fault tolerance, and high throughput. The number of partitions affects performance. It determines how data is distributed, replicated, and processed by consumers. Here are some critical reasons why partitioning is important:
- Parallel Processing: Kafka consumers can read from multiple partitions in parallel. This improves throughput and latency. This parallelism is crucial for applications requiring real-time data processing.
- Load Balancing: Distributing partitions across brokers ensures load balancing in the Kafka cluster. It prevents any single broker from becoming a bottleneck.
- Fault Tolerance: Kafka replicates partitions across brokers. This ensures high availability and fault tolerance if nodes fail.
With this understanding, let’s explore strategies to optimize Kafka topic partitioning.
1. Choosing the Right Number of Partitions
One of the first decisions in Kafka topic partitioning is how many partitions to use for each topic. This number depends on several factors. They are the expected load, the number of consumers, and the throughput requirements.
- High Throughput: To achieve high throughput, you may need more partitions. More partitions allow for more parallelism. They also better distribute the workload across brokers.
- Consumer Load: The number of partitions must match the number of consumers in the consumer group. If you have more partitions than consumers, some consumers will be idle. Conversely, if there are fewer partitions than consumers, some consumers will be underutilized.
- Replication Factor: Kafka's replication factor affects the number of partitions. Replicating each partition increases fault tolerance. But, it requires more storage and network resources.
As a rule of thumb:
More partitions (in the 100s or 1000s) improve scalability. But, they increase management complexity.
- Start with a conservative number of partitions and scale as needed.
2. Partition Key Design
Partition keys define how records are distributed across partitions. Kafka uses the partition key to assign a record to a specific partition. The key is hashed, and Kafka determines the partition based on the hash value.
Choosing the Right Partition Key:
- Uniform Distribution: For better load balancing, choose a partition key. It should distribute records uniformly across partitions. If the partitioning is skewed, it can cause bottlenecks. For example, all records going to a single partition.
- Event Characteristics: Choose a key based on the event's important traits for your use case. For example, if you're processing user data, you might choose `userId` as the key. This would ensure that all messages for a specific user are handled by the same partition.
- Event Ordering: Kafka guarantees the order of messages within a partition, but not across partitions. If event order is critical, ensure related events share the same partition key.
Example of a bad partitioning strategy:
- A timestamp or a random key can cause uneven partitions. It may also lose ordering guarantees.
Best Practices:
- Use the same partition keys to ensure that related events, like all events for a user, go to the same partition.
- Avoid over-partitioning on a small key domain, as it could lead to data skew and uneven load distribution.
3. Rebalancing Partitions
If the number of producers, consumers, or the data volume changes, Kafka may need to rebalance partitions across brokers. Rebalancing is the process of redistributing partitions. It ensures an even load and efficient use of resources.
- Dynamic Partition Rebalancing: Kafka has tools, like `kafka-reassign-partitions`, for partition reassignment when adding or removing brokers.
- Replication Factor: A high replication factor may require a rebalance. It will need reassigning replicas to ensure an even distribution across brokers.
Challenges with Rebalancing:
- Impact on Performance: Rebalancing partitions can hurt performance. Data movement can use network and disk resources.
Stateful Consumers: If you use stateful consumers in stream processing, ensure their state migrates during rebalancing.
Best Practices:
- Perform rebalancing during low-traffic periods or during planned maintenance windows.
Use automatic partition reassignment tools. Ensure your system can migrate partitions smoothly.
4. Monitor Partition Distribution
Effective partition distribution is crucial to ensure that Kafka brokers are evenly loaded. Uneven partition distribution can cause resource contention. Some brokers will handle too much data while others stay idle.
To monitor partition distribution:
- Kafka Metrics: Use Kafka's metrics and monitoring tools, like JMX, Prometheus, and Grafana. Check the partitions and their distribution across brokers.
- Rebalance Alerts: Set alerts to notify you of unevenly distributed partitions. This lets you fix the issue before it affects performance.
Best Practices:
- Regularly audit partition distribution and rebalance partitions when necessary.
- Ensure that you don’t overload any single broker by distributing partitions evenly.
5. Consider Storage and Network Limits
Kafka partitioning can also impact storage and network usage. Each partition consumes disk space and requires network bandwidth for replication. Over-partitioning can lead to unnecessary resource consumption, causing storage and network bottlenecks.
- Disk Space: Ensure that each partition has enough storage capacity. As partitions grow over time, monitoring disk usage is critical.
- Network Load: Kafka replication and data distribution use network bandwidth. More partitions increase replication traffic and the overall network load.
Best Practices:
- Monitor storage and network utilization regularly and adjust partition numbers as needed.
- Consider using tiered storage. It stores older data on cheaper, slower systems. This can reduce the impact of high partition numbers on disk.
How to obtain Apache Kafka certification?
We are an Education Technology company providing certification training courses to accelerate careers of working professionals worldwide. We impart training through instructor-led classroom workshops, instructor-led live virtual training sessions, and self-paced e-learning courses.
We have successfully conducted training sessions in 108 countries across the globe and enabled thousands of working professionals to enhance the scope of their careers.
Our enterprise training portfolio includes in-demand and globally recognized certification training courses in Project Management, Quality Management, Business Analysis, IT Service Management, Agile and Scrum, Cyber Security, Data Science, and Emerging Technologies. Download our Enterprise Training Catalog from https://www.icertglobal.com/corporate-training-for-enterprises.php and https://www.icertglobal.com/index.php
Popular Courses include:
-
Project Management: PMP, CAPM ,PMI RMP
-
Quality Management: Six Sigma Black Belt ,Lean Six Sigma Green Belt, Lean Management, Minitab,CMMI
-
Business Analysis: CBAP, CCBA, ECBA
-
Agile Training: PMI-ACP , CSM , CSPO
-
Scrum Training: CSM
-
DevOps
-
Program Management: PgMP
-
Cloud Technology: Exin Cloud Computing
-
Citrix Client Adminisration: Citrix Cloud Administration
The 10 top-paying certifications to target in 2024 are:
Conclusion
Kafka partitioning is key to configuring and managing your Kafka cluster. The right number of partitions and effective keys matter. Balanced partitions and resource use monitoring also help. They can greatly improve your Kafka system's performance and scalability.
Contact Us For More Information:
Visit :www.icertglobal.com Email :

Quantum Computing and Its Implications for Data Science
In today's fast-changing tech world, quantum computing is very promising. It may revolutionise many industries. Of these, data science is ripe for change. Quantum computing's unmatched power will drive it. But what exactly is quantum computing, and how does it intersect with data science? Let's explore this topic. We'll look at its principles, potential, and challenges.
Understanding Quantum Computing
Quantum computing is a new field. It uses quantum mechanics to process information. Unlike classical computers, which use bits (0s and 1s), quantum computers use quantum bits, or qubits. A qubit can exist in multiple states simultaneously, thanks to a quantum property called superposition. Also, qubits can become entangled. One qubit's state can depend on another's, even if they are physically separated. These properties let quantum computers calculate complex problems. They are exponentially faster than classical computers.
The fundamental difference lies in how quantum computers process information. Classical computers perform calculations sequentially, while quantum computers can evaluate many possibilities simultaneously. This trait makes them ideal for tasks with complex algorithms and big datasets. These are key to data science.
The Role of Data Science in the Modern World
Data science is the discipline of finding insights in data. This data can be structured or unstructured. It involves a blend of statistical analysis, machine learning, data visualization, and programming. In recent years, data science has become vital in many fields. These include healthcare, finance, marketing, and AI.
However, the rapid growth in data has outpaced traditional systems' processing power. Data scientists often grapple with challenges such as:
-
Handling large-scale datasets (Big Data).
-
Performing real-time analytics.
-
Optimizing machine learning algorithms.
-
Conducting simulations for high-dimensional problems.
Quantum computing may solve many of these challenges. It could provide the speed and efficiency to tackle them.
Quantum Computing’s Implications for Data Science
1. Enhanced Processing Power
A key implication of quantum computing for data science is its ability to process and analyze massive datasets. With traditional systems, analyzing complex data often involves time-consuming computations. Quantum computers, on the other hand, can do these tasks much faster. They can evaluate multiple possibilities at the same time. This is useful for tasks like clustering, classification, and optimizing large datasets.
For example, in genomics, quantum computing could speed up genetic data analysis to find disease markers. This could enable faster medical breakthroughs.
2. Advancements in Machine Learning
Machine learning (ML), a cornerstone of data science, stands to benefit immensely from quantum computing. Quantum algorithms, like the QAOA and QSVM, could improve ML models. They may be faster and more accurate.
Quantum computers can optimize model parameters better than classical systems. This leads to faster training and better performance. They can also tackle high-dimensional data spaces. These are common in fields like natural language processing and image recognition. It could lead to breakthroughs in AI. This includes autonomous vehicles and personalized recommendation systems.
3. Improved Optimization Solutions
Optimization problems are common in data science. They range from supply chain logistics to portfolio management. Quantum computing excels at solving complex optimization problems. It does so by using quantum properties like superposition and entanglement.
Quantum algorithms can solve combinatorial optimization problems much faster than classical methods. They can find the best solution. This could revolutionize industries like transportation. There, route optimization is critical for logistics and delivery systems.
4. Efficient Data Encoding and Processing
Quantum computers can encode data into high-dimensional quantum states. This enables more efficient data processing. Techniques like quantum principal component analysis (qPCA) can shrink large datasets. They do this while keeping their essential information. This is especially valuable for preprocessing data in machine learning. There, dimensionality reduction is often a key step.
5. Cryptography and Data Security
Data security is vital in data science. Quantum computing offers both opportunities and challenges in this area. Quantum computers could break classical encryption. They can factor large numbers, which many cryptographic methods rely on. Quantum cryptography, specifically quantum key distribution (QKD), promises unbreakable encryption. It does this by using the principles of quantum mechanics.
As quantum computing becomes mainstream, data scientists must adapt. They must secure their systems while using quantum-enhanced cryptography.
Challenges in Integrating Quantum Computing with Data Science
Quantum computing has immense potential. But, several challenges must be addressed before it can be widely adopted in data science.
-
Quantum computers are still in their infancy. Access to high-quality hardware is limited. Developing reliable and scalable quantum systems remains a significant hurdle.
-
Error Rates and Noise: Quantum systems are very sensitive to their environment. This causes errors in computations. Developing error-correcting codes and stable qubits is an ongoing area of research.
-
Steep Learning Curve: Quantum computing needs a deep knowledge of quantum mechanics, linear algebra, and programming languages like Qiskit and Cirq. This can be a barrier for many data scientists.
-
Integration with Classical Systems: Hybrid systems that mix classical and quantum computing will likely dominate soon. However, designing algorithms that efficiently integrate both paradigms is a complex challenge.
-
Ethical and Societal Implications: Quantum computing, like any powerful tech, raises ethical concerns. These are especially about surveillance, privacy, and weaponization.
The Future of Quantum Computing in Data Science
Despite these challenges, quantum computing will likely be key to data science in the coming decades. Its development suggests this. Big tech firms like IBM, Google, and Microsoft are investing heavily in quantum research. Startups are exploring innovative quantum solutions for specific industries.
As quantum computing matures, we can expect:
-
The development of more robust quantum algorithms tailored to data science tasks.
-
Increased collaboration between quantum physicists and data scientists to bridge the knowledge gap.
-
The emergence of hybrid quantum-classical systems to address real-world problems.
-
New educational initiatives to train the next generation of quantum data scientists.
How to obtain Data Sciences certification?
We are an Education Technology company providing certification training courses to accelerate careers of working professionals worldwide. We impart training through instructor-led classroom workshops, instructor-led live virtual training sessions, and self-paced e-learning courses.
We have successfully conducted training sessions in 108 countries across the globe and enabled thousands of working professionals to enhance the scope of their careers.
Our enterprise training portfolio includes in-demand and globally recognized certification training courses in Project Management, Quality Management, Business Analysis, IT Service Management, Agile and Scrum, Cyber Security, Data Science, and Emerging Technologies. Download our Enterprise Training Catalog from https://www.icertglobal.com/corporate-training-for-enterprises.php and https://www.icertglobal.com/index.php
Popular Courses include:
-
Project Management: PMP, CAPM ,PMI RMP
-
Quality Management: Six Sigma Black Belt ,Lean Six Sigma Green Belt, Lean Management, Minitab,CMMI
-
Business Analysis: CBAP, CCBA, ECBA
-
Agile Training: PMI-ACP , CSM , CSPO
-
Scrum Training: CSM
-
DevOps
-
Program Management: PgMP
-
Cloud Technology: Exin Cloud Computing
-
Citrix Client Adminisration: Citrix Cloud Administration
The 10 top-paying certifications to target in 2024 are:
Conclusion
Quantum computing is a major shift in computing. It has huge implications for data science. It can process vast data, optimize complex systems, and enhance machine learning models. This opens up exciting possibilities for solving today's biggest challenges.
However, realizing this potential requires overcoming significant technical, educational, and ethical challenges. The field is evolving. The blend of quantum computing and data science will lead to breakthroughs. It will shape the future of technology and society.
Data scientists must now learn quantum concepts and tools. This will place them at the forefront of a tech revolution. The journey may be complex, but the rewards promise to be transformative.
Contact Us For More Information:
Visit :www.icertglobal.com Email :
Read More
In today's fast-changing tech world, quantum computing is very promising. It may revolutionise many industries. Of these, data science is ripe for change. Quantum computing's unmatched power will drive it. But what exactly is quantum computing, and how does it intersect with data science? Let's explore this topic. We'll look at its principles, potential, and challenges.
Understanding Quantum Computing
Quantum computing is a new field. It uses quantum mechanics to process information. Unlike classical computers, which use bits (0s and 1s), quantum computers use quantum bits, or qubits. A qubit can exist in multiple states simultaneously, thanks to a quantum property called superposition. Also, qubits can become entangled. One qubit's state can depend on another's, even if they are physically separated. These properties let quantum computers calculate complex problems. They are exponentially faster than classical computers.
The fundamental difference lies in how quantum computers process information. Classical computers perform calculations sequentially, while quantum computers can evaluate many possibilities simultaneously. This trait makes them ideal for tasks with complex algorithms and big datasets. These are key to data science.
The Role of Data Science in the Modern World
Data science is the discipline of finding insights in data. This data can be structured or unstructured. It involves a blend of statistical analysis, machine learning, data visualization, and programming. In recent years, data science has become vital in many fields. These include healthcare, finance, marketing, and AI.
However, the rapid growth in data has outpaced traditional systems' processing power. Data scientists often grapple with challenges such as:
-
Handling large-scale datasets (Big Data).
-
Performing real-time analytics.
-
Optimizing machine learning algorithms.
-
Conducting simulations for high-dimensional problems.
Quantum computing may solve many of these challenges. It could provide the speed and efficiency to tackle them.
Quantum Computing’s Implications for Data Science
1. Enhanced Processing Power
A key implication of quantum computing for data science is its ability to process and analyze massive datasets. With traditional systems, analyzing complex data often involves time-consuming computations. Quantum computers, on the other hand, can do these tasks much faster. They can evaluate multiple possibilities at the same time. This is useful for tasks like clustering, classification, and optimizing large datasets.
For example, in genomics, quantum computing could speed up genetic data analysis to find disease markers. This could enable faster medical breakthroughs.
2. Advancements in Machine Learning
Machine learning (ML), a cornerstone of data science, stands to benefit immensely from quantum computing. Quantum algorithms, like the QAOA and QSVM, could improve ML models. They may be faster and more accurate.
Quantum computers can optimize model parameters better than classical systems. This leads to faster training and better performance. They can also tackle high-dimensional data spaces. These are common in fields like natural language processing and image recognition. It could lead to breakthroughs in AI. This includes autonomous vehicles and personalized recommendation systems.
3. Improved Optimization Solutions
Optimization problems are common in data science. They range from supply chain logistics to portfolio management. Quantum computing excels at solving complex optimization problems. It does so by using quantum properties like superposition and entanglement.
Quantum algorithms can solve combinatorial optimization problems much faster than classical methods. They can find the best solution. This could revolutionize industries like transportation. There, route optimization is critical for logistics and delivery systems.
4. Efficient Data Encoding and Processing
Quantum computers can encode data into high-dimensional quantum states. This enables more efficient data processing. Techniques like quantum principal component analysis (qPCA) can shrink large datasets. They do this while keeping their essential information. This is especially valuable for preprocessing data in machine learning. There, dimensionality reduction is often a key step.
5. Cryptography and Data Security
Data security is vital in data science. Quantum computing offers both opportunities and challenges in this area. Quantum computers could break classical encryption. They can factor large numbers, which many cryptographic methods rely on. Quantum cryptography, specifically quantum key distribution (QKD), promises unbreakable encryption. It does this by using the principles of quantum mechanics.
As quantum computing becomes mainstream, data scientists must adapt. They must secure their systems while using quantum-enhanced cryptography.
Challenges in Integrating Quantum Computing with Data Science
Quantum computing has immense potential. But, several challenges must be addressed before it can be widely adopted in data science.
-
Quantum computers are still in their infancy. Access to high-quality hardware is limited. Developing reliable and scalable quantum systems remains a significant hurdle.
-
Error Rates and Noise: Quantum systems are very sensitive to their environment. This causes errors in computations. Developing error-correcting codes and stable qubits is an ongoing area of research.
-
Steep Learning Curve: Quantum computing needs a deep knowledge of quantum mechanics, linear algebra, and programming languages like Qiskit and Cirq. This can be a barrier for many data scientists.
-
Integration with Classical Systems: Hybrid systems that mix classical and quantum computing will likely dominate soon. However, designing algorithms that efficiently integrate both paradigms is a complex challenge.
-
Ethical and Societal Implications: Quantum computing, like any powerful tech, raises ethical concerns. These are especially about surveillance, privacy, and weaponization.
The Future of Quantum Computing in Data Science
Despite these challenges, quantum computing will likely be key to data science in the coming decades. Its development suggests this. Big tech firms like IBM, Google, and Microsoft are investing heavily in quantum research. Startups are exploring innovative quantum solutions for specific industries.
As quantum computing matures, we can expect:
-
The development of more robust quantum algorithms tailored to data science tasks.
-
Increased collaboration between quantum physicists and data scientists to bridge the knowledge gap.
-
The emergence of hybrid quantum-classical systems to address real-world problems.
-
New educational initiatives to train the next generation of quantum data scientists.
How to obtain Data Sciences certification?
We are an Education Technology company providing certification training courses to accelerate careers of working professionals worldwide. We impart training through instructor-led classroom workshops, instructor-led live virtual training sessions, and self-paced e-learning courses.
We have successfully conducted training sessions in 108 countries across the globe and enabled thousands of working professionals to enhance the scope of their careers.
Our enterprise training portfolio includes in-demand and globally recognized certification training courses in Project Management, Quality Management, Business Analysis, IT Service Management, Agile and Scrum, Cyber Security, Data Science, and Emerging Technologies. Download our Enterprise Training Catalog from https://www.icertglobal.com/corporate-training-for-enterprises.php and https://www.icertglobal.com/index.php
Popular Courses include:
-
Project Management: PMP, CAPM ,PMI RMP
-
Quality Management: Six Sigma Black Belt ,Lean Six Sigma Green Belt, Lean Management, Minitab,CMMI
-
Business Analysis: CBAP, CCBA, ECBA
-
Agile Training: PMI-ACP , CSM , CSPO
-
Scrum Training: CSM
-
DevOps
-
Program Management: PgMP
-
Cloud Technology: Exin Cloud Computing
-
Citrix Client Adminisration: Citrix Cloud Administration
The 10 top-paying certifications to target in 2024 are:
Conclusion
Quantum computing is a major shift in computing. It has huge implications for data science. It can process vast data, optimize complex systems, and enhance machine learning models. This opens up exciting possibilities for solving today's biggest challenges.
However, realizing this potential requires overcoming significant technical, educational, and ethical challenges. The field is evolving. The blend of quantum computing and data science will lead to breakthroughs. It will shape the future of technology and society.
Data scientists must now learn quantum concepts and tools. This will place them at the forefront of a tech revolution. The journey may be complex, but the rewards promise to be transformative.
Contact Us For More Information:
Visit :www.icertglobal.com Email :

Mastering Power BI Drillthrough to Enhance Report Insights
Power BI is a powerful tool. It turns raw data into visual insights. A key feature that can greatly improve reports and dashboards is Drillthrough. This feature lets users explore data in detail. It allows them to "drill through" to a specific subset of data. This helps them gain insights without overwhelming them with too much info at once.
This blog will explore Drillthrough in Power BI. We will cover what it is, how it works, and how to use it to create more interactive and insightful reports. Drillthrough can improve your reports and data analysis. So, it's worth mastering, whether you're a beginner or an expert Power BI user.
What is Drillthrough in Power BI?
Drillthrough is a Power BI feature. It lets users right-click on a data point or visual. This opens a detailed, filtered report page relevant to the selected data. This new page, often called a "Drillthrough page," provides a deeper dive into the data point. It offers a more detailed, focused view.
For example, if a report shows sales by region, use Drillthrough. Right-click on a specific region to view a detailed report. It breaks down sales data by product category, sales rep, or time period. Drillthrough is ideal for when you want to explore the data behind a summary report. It helps you gain insights without cluttering the main dashboard or report.
Why Should You Use Drillthrough?
1. Increased Interactivity: Drillthrough transforms static reports into dynamic, interactive experiences. Users can click on visuals to explore data. This helps them find insights that meet their specific needs. It provides a more personalized reporting experience.
2. Better Data Exploration: Summary reports often lack the detail needed for in-depth analysis. Drillthrough lets you switch to a detailed page. It keeps the context of the data you were examining. This allows you to dive deeper into the numbers.
3. Improved Report Clarity: Drillthrough pages can keep your main report clean. They show only the most relevant data. Users can choose to see specific details. This helps avoid overwhelming them with too much information at once.
4. Efficient Decision-Making: Drillthrough lets users and decision-makers access relevant data easily. It saves time and boosts productivity. They don't have to navigate multiple tabs or reports manually.
How Does Drillthrough Work in Power BI?
Creating and using Drillthrough in Power BI involves several steps. Here’s how to set it up:
1. Creating a Drillthrough Page
First, you need to create a page that will serve as the Drillthrough destination. To do this:
- Open your Power BI report and navigate to the page where you want to create the Drillthrough.
- Right-click on the blank canvas and choose "Drillthrough" from the options.
- This will add a new filter pane to the right of the report. You can use it to specify the fields to drill through on. These are the fields that will define the context of the Drillthrough page.
For a Drillthrough page for "Sales by Region," add "Region" as a field in the Drillthrough filters pane.
2. Adding Visuals to the Drillthrough Page
Once you’ve defined the fields for Drillthrough, you can add visuals to the Drillthrough page. These visuals will show the detailed, filtered data. It is based on the field or context you selected on the main report page.
For instance, on the Drillthrough page, you might want to add charts. They should break down sales by product category, product line, or sales person for the region.
3. Using the Drillthrough Feature
After setting up the Drillthrough page, users can use the main report's visuals. Here’s how:
- Right-click on a data point or visual (for example, a bar in a bar chart showing sales by region).
- From the context menu, select "Drillthrough." You will see a list of available Drillthrough pages based on your configured fields.
- Selecting the Drillthrough page will open a detailed report. It will be filtered for the specific data point you selected. This will allow you to explore that data in depth.
4. Configuring Drillthrough Buttons (Optional)
While right-clicking is the default way to navigate Drillthrough pages, you can also create buttons to improve the user experience. These buttons can be custom navigation elements. They can guide users to the Drillthrough page, via interactions or bookmarks.
To add a button:
- Select a button visual from the "Insert" tab.
- Configure the button to navigate to the Drillthrough page when clicked. This allows users to click on a button rather than right-clicking on a visual.
Best Practices for Using Drillthrough
To get the most from Drillthrough, follow some best practices. They will improve its effectiveness.
1. Limit the Number of Drillthrough Fields
Drillthrough is a powerful tool. But, too many fields in the Drillthrough filter can overwhelm users. It can complicate the experience. It’s best to keep the Drillthrough filters simple and relevant to the user’s needs.
For example, if your report is about sales, a Drillthrough filter for "Product Category" or "Region" could be best. Too many filters can clutter the experience and reduce the feature's usefulness.
2. Ensure Consistency Across Pages
The main report and Drillthrough pages must have consistent visuals and formatting. This will help users switch between them. Use the same layout, colors, and design to ensure intuitive, seamless navigation.
3. Provide Context on Drillthrough Pages
To avoid confusion, the Drillthrough page must show what data the user is viewing. Adding text boxes or titles to describe the context (e.g., "Sales by Product Category for Region X") can help users quickly grasp the data.
4. Create a Clear User Journey
Ensure users know how to navigate between the summary and Drillthrough pages. Tooltips, labels, and clear instructions can guide them. They will then interact with the visuals and explore the data.
Advanced Drillthrough Techniques
For advanced users, there are several techniques to enhance Drillthrough functionality further:
You can add more than one field to the Drillthrough filter pane. This lets users drill down based on multiple data points at once. It provides a more detailed view.
- Using Bookmarks and Buttons: Combine Drillthrough with Power BI's bookmarks. This will make reports more interactive. Users can switch views and drill into the data.
- Dynamic Drillthrough: You can create Drillthrough pages that change with the user's selection. Use dynamic measures and calculations to give them customized insights.
How to obtain Power BI certification?
We are an Education Technology company providing certification training courses to accelerate careers of working professionals worldwide. We impart training through instructor-led classroom workshops, instructor-led live virtual training sessions, and self-paced e-learning courses.
We have successfully conducted training sessions in 108 countries across the globe and enabled thousands of working professionals to enhance the scope of their careers.
Our enterprise training portfolio includes in-demand and globally recognized certification training courses in Project Management, Quality Management, Business Analysis, IT Service Management, Agile and Scrum, Cyber Security, Data Science, and Emerging Technologies. Download our Enterprise Training Catalog from https://www.icertglobal.com/corporate-training-for-enterprises.php and https://www.icertglobal.com/index.php
Popular Courses include:
-
Project Management: PMP, CAPM ,PMI RMP
-
Quality Management: Six Sigma Black Belt ,Lean Six Sigma Green Belt, Lean Management, Minitab,CMMI
-
Business Analysis: CBAP, CCBA, ECBA
-
Agile Training: PMI-ACP , CSM , CSPO
-
Scrum Training: CSM
-
DevOps
-
Program Management: PgMP
-
Cloud Technology: Exin Cloud Computing
-
Citrix Client Adminisration: Citrix Cloud Administration
The 10 top-paying certifications to target in 2024 are:
Conclusion
To create insightful, interactive reports, you must master Power BI's Drillthrough feature. It lets users explore data in depth while keeping the main reports clean. This blog's steps and best practices will improve your Power BI reports. They will enhance data exploration and decision-making in your organization.
If you're making dashboards for execs, analysts, or users, use Drillthrough in your reports. It will boost their effectiveness and improve your audience's data experience. So, start using Drillthrough today and unlock the full potential of your Power BI reports!
Contact Us For More Information:
Visit :www.icertglobal.com Email :
Read More
Power BI is a powerful tool. It turns raw data into visual insights. A key feature that can greatly improve reports and dashboards is Drillthrough. This feature lets users explore data in detail. It allows them to "drill through" to a specific subset of data. This helps them gain insights without overwhelming them with too much info at once.
This blog will explore Drillthrough in Power BI. We will cover what it is, how it works, and how to use it to create more interactive and insightful reports. Drillthrough can improve your reports and data analysis. So, it's worth mastering, whether you're a beginner or an expert Power BI user.
What is Drillthrough in Power BI?
Drillthrough is a Power BI feature. It lets users right-click on a data point or visual. This opens a detailed, filtered report page relevant to the selected data. This new page, often called a "Drillthrough page," provides a deeper dive into the data point. It offers a more detailed, focused view.
For example, if a report shows sales by region, use Drillthrough. Right-click on a specific region to view a detailed report. It breaks down sales data by product category, sales rep, or time period. Drillthrough is ideal for when you want to explore the data behind a summary report. It helps you gain insights without cluttering the main dashboard or report.
Why Should You Use Drillthrough?
1. Increased Interactivity: Drillthrough transforms static reports into dynamic, interactive experiences. Users can click on visuals to explore data. This helps them find insights that meet their specific needs. It provides a more personalized reporting experience.
2. Better Data Exploration: Summary reports often lack the detail needed for in-depth analysis. Drillthrough lets you switch to a detailed page. It keeps the context of the data you were examining. This allows you to dive deeper into the numbers.
3. Improved Report Clarity: Drillthrough pages can keep your main report clean. They show only the most relevant data. Users can choose to see specific details. This helps avoid overwhelming them with too much information at once.
4. Efficient Decision-Making: Drillthrough lets users and decision-makers access relevant data easily. It saves time and boosts productivity. They don't have to navigate multiple tabs or reports manually.
How Does Drillthrough Work in Power BI?
Creating and using Drillthrough in Power BI involves several steps. Here’s how to set it up:
1. Creating a Drillthrough Page
First, you need to create a page that will serve as the Drillthrough destination. To do this:
- Open your Power BI report and navigate to the page where you want to create the Drillthrough.
- Right-click on the blank canvas and choose "Drillthrough" from the options.
- This will add a new filter pane to the right of the report. You can use it to specify the fields to drill through on. These are the fields that will define the context of the Drillthrough page.
For a Drillthrough page for "Sales by Region," add "Region" as a field in the Drillthrough filters pane.
2. Adding Visuals to the Drillthrough Page
Once you’ve defined the fields for Drillthrough, you can add visuals to the Drillthrough page. These visuals will show the detailed, filtered data. It is based on the field or context you selected on the main report page.
For instance, on the Drillthrough page, you might want to add charts. They should break down sales by product category, product line, or sales person for the region.
3. Using the Drillthrough Feature
After setting up the Drillthrough page, users can use the main report's visuals. Here’s how:
- Right-click on a data point or visual (for example, a bar in a bar chart showing sales by region).
- From the context menu, select "Drillthrough." You will see a list of available Drillthrough pages based on your configured fields.
- Selecting the Drillthrough page will open a detailed report. It will be filtered for the specific data point you selected. This will allow you to explore that data in depth.
4. Configuring Drillthrough Buttons (Optional)
While right-clicking is the default way to navigate Drillthrough pages, you can also create buttons to improve the user experience. These buttons can be custom navigation elements. They can guide users to the Drillthrough page, via interactions or bookmarks.
To add a button:
- Select a button visual from the "Insert" tab.
- Configure the button to navigate to the Drillthrough page when clicked. This allows users to click on a button rather than right-clicking on a visual.
Best Practices for Using Drillthrough
To get the most from Drillthrough, follow some best practices. They will improve its effectiveness.
1. Limit the Number of Drillthrough Fields
Drillthrough is a powerful tool. But, too many fields in the Drillthrough filter can overwhelm users. It can complicate the experience. It’s best to keep the Drillthrough filters simple and relevant to the user’s needs.
For example, if your report is about sales, a Drillthrough filter for "Product Category" or "Region" could be best. Too many filters can clutter the experience and reduce the feature's usefulness.
2. Ensure Consistency Across Pages
The main report and Drillthrough pages must have consistent visuals and formatting. This will help users switch between them. Use the same layout, colors, and design to ensure intuitive, seamless navigation.
3. Provide Context on Drillthrough Pages
To avoid confusion, the Drillthrough page must show what data the user is viewing. Adding text boxes or titles to describe the context (e.g., "Sales by Product Category for Region X") can help users quickly grasp the data.
4. Create a Clear User Journey
Ensure users know how to navigate between the summary and Drillthrough pages. Tooltips, labels, and clear instructions can guide them. They will then interact with the visuals and explore the data.
Advanced Drillthrough Techniques
For advanced users, there are several techniques to enhance Drillthrough functionality further:
You can add more than one field to the Drillthrough filter pane. This lets users drill down based on multiple data points at once. It provides a more detailed view.
- Using Bookmarks and Buttons: Combine Drillthrough with Power BI's bookmarks. This will make reports more interactive. Users can switch views and drill into the data.
- Dynamic Drillthrough: You can create Drillthrough pages that change with the user's selection. Use dynamic measures and calculations to give them customized insights.
How to obtain Power BI certification?
We are an Education Technology company providing certification training courses to accelerate careers of working professionals worldwide. We impart training through instructor-led classroom workshops, instructor-led live virtual training sessions, and self-paced e-learning courses.
We have successfully conducted training sessions in 108 countries across the globe and enabled thousands of working professionals to enhance the scope of their careers.
Our enterprise training portfolio includes in-demand and globally recognized certification training courses in Project Management, Quality Management, Business Analysis, IT Service Management, Agile and Scrum, Cyber Security, Data Science, and Emerging Technologies. Download our Enterprise Training Catalog from https://www.icertglobal.com/corporate-training-for-enterprises.php and https://www.icertglobal.com/index.php
Popular Courses include:
-
Project Management: PMP, CAPM ,PMI RMP
-
Quality Management: Six Sigma Black Belt ,Lean Six Sigma Green Belt, Lean Management, Minitab,CMMI
-
Business Analysis: CBAP, CCBA, ECBA
-
Agile Training: PMI-ACP , CSM , CSPO
-
Scrum Training: CSM
-
DevOps
-
Program Management: PgMP
-
Cloud Technology: Exin Cloud Computing
-
Citrix Client Adminisration: Citrix Cloud Administration
The 10 top-paying certifications to target in 2024 are:
Conclusion
To create insightful, interactive reports, you must master Power BI's Drillthrough feature. It lets users explore data in depth while keeping the main reports clean. This blog's steps and best practices will improve your Power BI reports. They will enhance data exploration and decision-making in your organization.
If you're making dashboards for execs, analysts, or users, use Drillthrough in your reports. It will boost their effectiveness and improve your audience's data experience. So, start using Drillthrough today and unlock the full potential of your Power BI reports!
Contact Us For More Information:
Visit :www.icertglobal.com Email :

Unstructured Data in Data Science: Challenges and Solutions
In the age of big data, organizations are amassing vast amounts of information. A lot of this data is unstructured. It doesn't fit into rows and columns like traditional data. Unstructured data is harder to process, analyze, and use. But, it is very valuable when handled well. This blog will explore unstructured data. We'll discuss its challenges in data science and potential solutions to harness it.
What is Unstructured Data?
Unstructured data is any info without a predefined model or structure. Unlike structured data in SQL tables, unstructured data can be in various formats. These include text, audio, video, images, and social media posts. Some of the most common examples of unstructured data include:
- Text data: Emails, documents, social media posts, customer reviews
- Multimedia data: Images, videos, audio recordings
- Web data: Website logs, user interactions, and sensor data
- Sensor data: Data from IoT devices that don’t follow a uniform format
Several studies say this type of data makes up over 80% of all data generated worldwide. Its complexity and disorganization make it hard to extract insights from unstructured data. This presents unique challenges for data scientists.
Issues with Unstructured Data
1. Difficulty in Processing and Analyzing
The most significant challenge with unstructured data is its inherent lack of organization. Unlike structured data, which SQL can easily query, unstructured data has no format. It makes it harder for data scientists to use traditional analysis tools and methods. For example:
We need NLP techniques to extract useful info from large texts, like customer feedback, blogs, or news articles. They are computationally intensive. They may involve sentiment analysis, topic modeling, and entity recognition.
- Images and videos: Analyzing visual data requires deep learning. It often needs specialized architectures, like convolutional neural networks (CNNs). Real-time analysis of large image or video data can be costly. It is also resource-heavy.
2. Volume and Storage
Unstructured data is vast and continuously growing. Storing, managing, and indexing such large amounts of data is challenging. Unstructured data needs more complex storage than structured data. Structured data can be stored in rows and columns in relational databases. They include distributed file systems, object storage (e.g., AWS S3, Hadoop HDFS), and cloud storage.
As unstructured data grows, organizations face high storage costs. They also face slow retrieval and scalability issues. Also, without data management systems, valuable insights may be lost in a mass of data.
3. Data Quality and Noise
Unstructured data often has noise, irrelevant info, or errors. This makes it hard to find useful patterns. For example, social media comments and reviews may have slang, and misspellings. They may also have irrelevant info. This could skew analysis. Cleaning unstructured data and filtering out noise require advanced techniques. These include text preprocessing, tokenization, and filtering.
Without proper preprocessing, the data can become unreliable or lead to inaccurate insights. Fixing the quality of unstructured data is vital in any data science project.
4. Integration with Structured Data
Structured data fits neatly into databases. But, combining it with unstructured data is often not straightforward. We need to integrate two types of data. First, we have text from customer interactions, like call centre transcripts. Second, we have structured data, like demographic info and transaction records. This will provide a complete view.
Integrating unstructured and structured data often requires complex processes. It needs advanced analytics, like machine learning models, that work on both data types.
Solutions for Handling Unstructured Data
Despite the challenges, several solutions exist. They help organizations use unstructured data in data science apps.
1. Text Mining and Natural Language Processing (NLP)
Text mining and NLP techniques have improved greatly. They now let data scientists extract useful information from vast, unstructured text data. These techniques convert raw text into analyzable, structured data. Common NLP methods include:
- Tokenization: Breaking down text into smaller units such as words or phrases.
- Named Entity Recognition (NER): It finds specific entities, like names, dates, and places, in the text.
- Sentiment analysis: It is the analysis of the text's sentiment (positive, negative, or neutral).
- Topic modeling: Extracting hidden thematic structure from large sets of text documents.
Data scientists can use libraries like NLTK, spaCy, and transformers (e.g., BERT, GPT) to process unstructured text. They can then derive structured insights for further analysis.
2. Image and Video Analytics with Deep Learning
For unstructured data like images and videos, deep learning is essential. CNNs have excelled at tasks like object detection, image classification, and facial recognition.
Modern computer vision models, like YOLO and OpenCV, let data scientists analyze images in real-time. Video data is a sequence of images. It needs advanced techniques to extract insights. These include optical flow analysis, object tracking, and temporal feature extraction.
To meet high computing demands, many use cloud platforms. Examples are Google Cloud Vision, Amazon Rekognition, and Microsoft Azure Cognitive Services. These can process large volumes of visual data without needing on-premise infrastructure.
3. Big Data Solutions for Storage and Management
Organizations can use big data solutions to handle unstructured data. Examples are Hadoop, Spark, and NoSQL databases like MongoDB. These frameworks allow data to be spread across multiple nodes. This enables faster analysis through parallel processing.
Hadoop's distributed file system (HDFS) is commonly used for storing large unstructured datasets. Meanwhile, cloud platforms like AWS S3 and Azure Blob Storage offer scalable storage. They help manage massive amounts of unstructured data while keeping costs down.
Additionally, using metadata tagging and indexing systems allows easier retrieval of unstructured data. These solutions help data scientists find relevant datasets faster, even in large volumes.
4. Data Integration and Transformation Tools
To merge unstructured and structured data, organizations use data integration tools and techniques. These tools let data scientists convert unstructured data into a structured format. It can then be easily joined with other datasets.
ETL (Extract, Transform, Load) tools like Apache Nifi or Talend can collect data from many sources. They can clean, preprocess, and integrate it into databases for analysis. Also, machine learning can automate extracting features from unstructured data. This enables deeper analysis and integration with structured data sources.
5. Leveraging Artificial Intelligence for Automation
AI-powered solutions are becoming more prevalent in managing unstructured data. AI tools and machine learning algorithms can automate many tasks. These include classification, feature extraction, and noise filtering. These solutions can find patterns in unstructured data. Human analysts might miss them. They can also improve their performance over time.
How to obtain Data Science certification?
We are an Education Technology company providing certification training courses to accelerate careers of working professionals worldwide. We impart training through instructor-led classroom workshops, instructor-led live virtual training sessions, and self-paced e-learning courses.
We have successfully conducted training sessions in 108 countries across the globe and enabled thousands of working professionals to enhance the scope of their careers.
Our enterprise training portfolio includes in-demand and globally recognized certification training courses in Project Management, Quality Management, Business Analysis, IT Service Management, Agile and Scrum, Cyber Security, Data Science, and Emerging Technologies. Download our Enterprise Training Catalog from https://www.icertglobal.com/corporate-training-for-enterprises.php and https://www.icertglobal.com/index.php
Popular Courses include:
-
Project Management: PMP, CAPM ,PMI RMP
-
Quality Management: Six Sigma Black Belt ,Lean Six Sigma Green Belt, Lean Management, Minitab,CMMI
-
Business Analysis: CBAP, CCBA, ECBA
-
Agile Training: PMI-ACP , CSM , CSPO
-
Scrum Training: CSM
-
DevOps
-
Program Management: PgMP
-
Cloud Technology: Exin Cloud Computing
-
Citrix Client Adminisration: Citrix Cloud Administration
The 10 top-paying certifications to target in 2024 are:
Conclusion
Unstructured data poses many challenges for data scientists. They struggle to process and analyze it. They also face noise and integration issues. With the right tools and techniques, businesses can transform unstructured data. It can become a powerful asset. Organizations can unlock their unstructured data. They can do this by using advanced machine learning, NLP, big data, and AI. They can gain insights to drive innovation and better decisions.
Contact Us For More Information:
Visit :www.icertglobal.com Email :
Read More
In the age of big data, organizations are amassing vast amounts of information. A lot of this data is unstructured. It doesn't fit into rows and columns like traditional data. Unstructured data is harder to process, analyze, and use. But, it is very valuable when handled well. This blog will explore unstructured data. We'll discuss its challenges in data science and potential solutions to harness it.
What is Unstructured Data?
Unstructured data is any info without a predefined model or structure. Unlike structured data in SQL tables, unstructured data can be in various formats. These include text, audio, video, images, and social media posts. Some of the most common examples of unstructured data include:
- Text data: Emails, documents, social media posts, customer reviews
- Multimedia data: Images, videos, audio recordings
- Web data: Website logs, user interactions, and sensor data
- Sensor data: Data from IoT devices that don’t follow a uniform format
Several studies say this type of data makes up over 80% of all data generated worldwide. Its complexity and disorganization make it hard to extract insights from unstructured data. This presents unique challenges for data scientists.
Issues with Unstructured Data
1. Difficulty in Processing and Analyzing
The most significant challenge with unstructured data is its inherent lack of organization. Unlike structured data, which SQL can easily query, unstructured data has no format. It makes it harder for data scientists to use traditional analysis tools and methods. For example:
We need NLP techniques to extract useful info from large texts, like customer feedback, blogs, or news articles. They are computationally intensive. They may involve sentiment analysis, topic modeling, and entity recognition.
- Images and videos: Analyzing visual data requires deep learning. It often needs specialized architectures, like convolutional neural networks (CNNs). Real-time analysis of large image or video data can be costly. It is also resource-heavy.
2. Volume and Storage
Unstructured data is vast and continuously growing. Storing, managing, and indexing such large amounts of data is challenging. Unstructured data needs more complex storage than structured data. Structured data can be stored in rows and columns in relational databases. They include distributed file systems, object storage (e.g., AWS S3, Hadoop HDFS), and cloud storage.
As unstructured data grows, organizations face high storage costs. They also face slow retrieval and scalability issues. Also, without data management systems, valuable insights may be lost in a mass of data.
3. Data Quality and Noise
Unstructured data often has noise, irrelevant info, or errors. This makes it hard to find useful patterns. For example, social media comments and reviews may have slang, and misspellings. They may also have irrelevant info. This could skew analysis. Cleaning unstructured data and filtering out noise require advanced techniques. These include text preprocessing, tokenization, and filtering.
Without proper preprocessing, the data can become unreliable or lead to inaccurate insights. Fixing the quality of unstructured data is vital in any data science project.
4. Integration with Structured Data
Structured data fits neatly into databases. But, combining it with unstructured data is often not straightforward. We need to integrate two types of data. First, we have text from customer interactions, like call centre transcripts. Second, we have structured data, like demographic info and transaction records. This will provide a complete view.
Integrating unstructured and structured data often requires complex processes. It needs advanced analytics, like machine learning models, that work on both data types.
Solutions for Handling Unstructured Data
Despite the challenges, several solutions exist. They help organizations use unstructured data in data science apps.
1. Text Mining and Natural Language Processing (NLP)
Text mining and NLP techniques have improved greatly. They now let data scientists extract useful information from vast, unstructured text data. These techniques convert raw text into analyzable, structured data. Common NLP methods include:
- Tokenization: Breaking down text into smaller units such as words or phrases.
- Named Entity Recognition (NER): It finds specific entities, like names, dates, and places, in the text.
- Sentiment analysis: It is the analysis of the text's sentiment (positive, negative, or neutral).
- Topic modeling: Extracting hidden thematic structure from large sets of text documents.
Data scientists can use libraries like NLTK, spaCy, and transformers (e.g., BERT, GPT) to process unstructured text. They can then derive structured insights for further analysis.
2. Image and Video Analytics with Deep Learning
For unstructured data like images and videos, deep learning is essential. CNNs have excelled at tasks like object detection, image classification, and facial recognition.
Modern computer vision models, like YOLO and OpenCV, let data scientists analyze images in real-time. Video data is a sequence of images. It needs advanced techniques to extract insights. These include optical flow analysis, object tracking, and temporal feature extraction.
To meet high computing demands, many use cloud platforms. Examples are Google Cloud Vision, Amazon Rekognition, and Microsoft Azure Cognitive Services. These can process large volumes of visual data without needing on-premise infrastructure.
3. Big Data Solutions for Storage and Management
Organizations can use big data solutions to handle unstructured data. Examples are Hadoop, Spark, and NoSQL databases like MongoDB. These frameworks allow data to be spread across multiple nodes. This enables faster analysis through parallel processing.
Hadoop's distributed file system (HDFS) is commonly used for storing large unstructured datasets. Meanwhile, cloud platforms like AWS S3 and Azure Blob Storage offer scalable storage. They help manage massive amounts of unstructured data while keeping costs down.
Additionally, using metadata tagging and indexing systems allows easier retrieval of unstructured data. These solutions help data scientists find relevant datasets faster, even in large volumes.
4. Data Integration and Transformation Tools
To merge unstructured and structured data, organizations use data integration tools and techniques. These tools let data scientists convert unstructured data into a structured format. It can then be easily joined with other datasets.
ETL (Extract, Transform, Load) tools like Apache Nifi or Talend can collect data from many sources. They can clean, preprocess, and integrate it into databases for analysis. Also, machine learning can automate extracting features from unstructured data. This enables deeper analysis and integration with structured data sources.
5. Leveraging Artificial Intelligence for Automation
AI-powered solutions are becoming more prevalent in managing unstructured data. AI tools and machine learning algorithms can automate many tasks. These include classification, feature extraction, and noise filtering. These solutions can find patterns in unstructured data. Human analysts might miss them. They can also improve their performance over time.
How to obtain Data Science certification?
We are an Education Technology company providing certification training courses to accelerate careers of working professionals worldwide. We impart training through instructor-led classroom workshops, instructor-led live virtual training sessions, and self-paced e-learning courses.
We have successfully conducted training sessions in 108 countries across the globe and enabled thousands of working professionals to enhance the scope of their careers.
Our enterprise training portfolio includes in-demand and globally recognized certification training courses in Project Management, Quality Management, Business Analysis, IT Service Management, Agile and Scrum, Cyber Security, Data Science, and Emerging Technologies. Download our Enterprise Training Catalog from https://www.icertglobal.com/corporate-training-for-enterprises.php and https://www.icertglobal.com/index.php
Popular Courses include:
-
Project Management: PMP, CAPM ,PMI RMP
-
Quality Management: Six Sigma Black Belt ,Lean Six Sigma Green Belt, Lean Management, Minitab,CMMI
-
Business Analysis: CBAP, CCBA, ECBA
-
Agile Training: PMI-ACP , CSM , CSPO
-
Scrum Training: CSM
-
DevOps
-
Program Management: PgMP
-
Cloud Technology: Exin Cloud Computing
-
Citrix Client Adminisration: Citrix Cloud Administration
The 10 top-paying certifications to target in 2024 are:
Conclusion
Unstructured data poses many challenges for data scientists. They struggle to process and analyze it. They also face noise and integration issues. With the right tools and techniques, businesses can transform unstructured data. It can become a powerful asset. Organizations can unlock their unstructured data. They can do this by using advanced machine learning, NLP, big data, and AI. They can gain insights to drive innovation and better decisions.
Contact Us For More Information:
Visit :www.icertglobal.com Email :
GraphX in Spark: Scala drives scalable graph insights!!!
As big data evolves, graph processing is gaining traction. It can represent complex relationships. Graphs model interconnected data. They are vital for apps like social networks and recommendation systems. They also help in fraud detection and bioinformatics. Apache Spark's GraphX module offers a powerful, distributed graph processing framework. It is seamlessly integrated with the Spark ecosystem. GraphX, a Scala library, lets developers build scalable, efficient graph apps. Scala is a concise and powerful language.
This blog covers GraphX basics, its Scala integration, and its use cases. It includes examples to get you started.
What is GraphX?
GraphX is the graph computation library of Apache Spark. It allows developers to process and analyze large-scale graphs efficiently. GraphX combines the benefits of the Spark ecosystem with specialized graph algorithms. It has fault tolerance, distributed computing, and scalability.
Key Features of GraphX:
1. Unified Data Representation:
GraphX extends the Spark RDD API. It adds graph-specific abstractions like `Graph` and `Edge`. This makes it easy to combine graph processing with other Spark operations.
2. Built-in Graph Algorithms:
GraphX includes popular algorithms such as PageRank, Connected Components, and Triangle Counting. These algorithms are optimized for distributed environments.
3. Custom Computation:
GraphX allows developers to define custom computations, enabling flexibility for domain-specific graph analytics.
4. Integration with Spark SQL and MLlib:
You can combine graph data with Spark's SQL and ML libraries. This lets you build complete data processing pipelines.
Setting Up GraphX with Scala
To get started, you need a Scala development environment and an Apache Spark setup. Most commonly, developers use SBT (Scala Build Tool) for managing dependencies and compiling projects. Here’s how you can include Spark and GraphX in your project:
SBT Configuration
Add the following dependencies in your `build.sbt` file:
```scala
libraryDependencies += "org.apache.spark" %% "spark-core" % "3.5.0"
libraryDependencies += "org.apache.spark" %% "spark-graphx" % "3.5.0"
```
Graph Representation in GraphX
In GraphX, a graph is composed of two main components:
1. Vertices:
Represent entities (nodes) in the graph. Each vertex is identified by a unique ID and can hold additional attributes.
2. Edges:
Represent relationships between vertices. Each edge has a source vertex, a destination vertex, and can also have attributes.
Creating a Graph
Here’s a simple example of how to define a graph in Scala using GraphX:
```scala
import org.apache.spark.graphx._
import org.apache.spark.rdd.RDD
import org.apache.spark.sql.SparkSession
object GraphXExample {
def main(args: Array[String]): Unit = {
val spark = SparkSession.builder
.appName("GraphX Example")
.master("local[*]")
.getOrCreate()
val sc = spark.sparkContext
// Define vertices
val vertices: RDD[(Long, String)] = sc.parallelize(Seq(
(1L, "Alice"),
(2L, "Bob"),
(3L, "Charlie"),
(4L, "David"),
(5L, "Eve")
))
// Define edges
val edges: RDD[Edge[String]] = sc.parallelize(Seq(
Edge(1L, 2L, "friend"),
Edge(2L, 3L, "follow"),
Edge(3L, 4L, "colleague"),
Edge(4L, 5L, "friend"),
Edge(5L, 1L, "follow")
))
// Create the graph
val graph: Graph[String, String] = Graph(vertices, edges)
// Print vertices and edges
println("Vertices:")
graph.vertices.collect.foreach(println)
println("Edges:")
graph.edges.collect.foreach(println)
}
}
```
---
Common GraphX Operations
1. Basic Graph Properties
You can extract useful properties of the graph, such as the number of vertices and edges, as follows:
```scala
println(s"Number of vertices: ${graph.vertices.count}")
println(s"Number of edges: ${graph.edges.count}")
```
2. Subgraph Filtering
To filter a subgraph based on a condition, use the `subgraph` function:
```scala
val subgraph = graph.subgraph(epred = edge => edge.attr == "friend")
subgraph.edges.collect.foreach(println)
```
This example creates a subgraph containing only edges labeled as "friend."
Built-in Algorithms in GraphX
GraphX provides several pre-built algorithms that simplify common graph analytics tasks.
PageRank
PageRank is used to rank nodes based on their importance. It’s widely applied in web search and social networks.
```scala
val ranks = graph.pageRank(0.001).vertices
ranks.collect.foreach { case (id, rank) => println(s"Vertex $id has rank $rank") }
```
Connected Components
Identifies connected subgraphs within the graph:
```scala
val connectedComponents = graph.connectedComponents().vertices
connectedComponents.collect.foreach { case (id, component) => println(s"Vertex $id belongs to component $component") }
Triangle Counting
Counts the number of triangles each vertex is part of:
```scala
val triangleCounts = graph.triangleCount().vertices
triangleCounts.collect.foreach { case (id, count) => println(s"Vertex $id is part of $count triangles") }
Real-World Use Cases
1. Social Network Analysis:
GraphX can find communities, key people, and relationships in social networks like Facebook and LinkedIn.
2. Recommendation Systems:
Use graph-based algorithms to recommend products, movies, or content based on user interactions.
3. Fraud Detection:
Detect fraudulent patterns by analyzing transaction networks and identifying anomalies.
4. Knowledge Graphs:
Build and query knowledge graphs for tasks like semantic search and natural language understanding.
Best Practices for Using GraphX
1. Optimize Storage:
Use efficient data formats such as Parquet or ORC for storing graph data.
2. Partitioning:
Partition large graphs to improve parallelism and reduce shuffle operations.
3. Memory Management:
Use Spark’s caching mechanisms (`persist` or `cache`) to manage memory effectively.
4. Leverage Scala’s Functional Programming:
Scala's concise syntax and functional programming make graph transformations more expressive and simpler.
How to obtain Apache Spark and Scala certification?
We are an Education Technology company providing certification training courses to accelerate careers of working professionals worldwide. We impart training through instructor-led classroom workshops, instructor-led live virtual training sessions, and self-paced e-learning courses.
We have successfully conducted training sessions in 108 countries across the globe and enabled thousands of working professionals to enhance the scope of their careers.
Our enterprise training portfolio includes in-demand and globally recognized certification training courses in Project Management, Quality Management, Business Analysis, IT Service Management, Agile and Scrum, Cyber Security, Data Science, and Emerging Technologies. Download our Enterprise Training Catalog from https://www.icertglobal.com/corporate-training-for-enterprises.php and https://www.icertglobal.com/index.php
Popular Courses include:
-
Project Management: PMP, CAPM ,PMI RMP
-
Quality Management: Six Sigma Black Belt ,Lean Six Sigma Green Belt, Lean Management, Minitab,CMMI
-
Business Analysis: CBAP, CCBA, ECBA
-
Agile Training: PMI-ACP , CSM , CSPO
-
Scrum Training: CSM
-
DevOps
-
Program Management: PgMP
-
Cloud Technology: Exin Cloud Computing
-
Citrix Client Adminisration: Citrix Cloud Administration
The 10 top-paying certifications to target in 2024 are:
Conclusion
GraphX is a powerful tool for distributed graph processing. It is integrated with the Apache Spark ecosystem and uses Scala's flexibility. GraphX enables scalable, efficient processing of complex graph data. It can analyze social networks and build recommendation engines. By mastering GraphX and Scala, developers can improve data analytics. They will gain a competitive edge in big data.
GraphX has the tools to tackle tough challenges in interconnected data. It suits both seasoned data scientists and new developers. So, get started today! Explore the exciting possibilities of graph analytics with Apache Spark and Scala!
Contact Us For More Information:
Visit :www.icertglobal.com Email :
Read More
As big data evolves, graph processing is gaining traction. It can represent complex relationships. Graphs model interconnected data. They are vital for apps like social networks and recommendation systems. They also help in fraud detection and bioinformatics. Apache Spark's GraphX module offers a powerful, distributed graph processing framework. It is seamlessly integrated with the Spark ecosystem. GraphX, a Scala library, lets developers build scalable, efficient graph apps. Scala is a concise and powerful language.
This blog covers GraphX basics, its Scala integration, and its use cases. It includes examples to get you started.
What is GraphX?
GraphX is the graph computation library of Apache Spark. It allows developers to process and analyze large-scale graphs efficiently. GraphX combines the benefits of the Spark ecosystem with specialized graph algorithms. It has fault tolerance, distributed computing, and scalability.
Key Features of GraphX:
1. Unified Data Representation:
GraphX extends the Spark RDD API. It adds graph-specific abstractions like `Graph` and `Edge`. This makes it easy to combine graph processing with other Spark operations.
2. Built-in Graph Algorithms:
GraphX includes popular algorithms such as PageRank, Connected Components, and Triangle Counting. These algorithms are optimized for distributed environments.
3. Custom Computation:
GraphX allows developers to define custom computations, enabling flexibility for domain-specific graph analytics.
4. Integration with Spark SQL and MLlib:
You can combine graph data with Spark's SQL and ML libraries. This lets you build complete data processing pipelines.
Setting Up GraphX with Scala
To get started, you need a Scala development environment and an Apache Spark setup. Most commonly, developers use SBT (Scala Build Tool) for managing dependencies and compiling projects. Here’s how you can include Spark and GraphX in your project:
SBT Configuration
Add the following dependencies in your `build.sbt` file:
```scala
libraryDependencies += "org.apache.spark" %% "spark-core" % "3.5.0"
libraryDependencies += "org.apache.spark" %% "spark-graphx" % "3.5.0"
```
Graph Representation in GraphX
In GraphX, a graph is composed of two main components:
1. Vertices:
Represent entities (nodes) in the graph. Each vertex is identified by a unique ID and can hold additional attributes.
2. Edges:
Represent relationships between vertices. Each edge has a source vertex, a destination vertex, and can also have attributes.
Creating a Graph
Here’s a simple example of how to define a graph in Scala using GraphX:
```scala
import org.apache.spark.graphx._
import org.apache.spark.rdd.RDD
import org.apache.spark.sql.SparkSession
object GraphXExample {
def main(args: Array[String]): Unit = {
val spark = SparkSession.builder
.appName("GraphX Example")
.master("local[*]")
.getOrCreate()
val sc = spark.sparkContext
// Define vertices
val vertices: RDD[(Long, String)] = sc.parallelize(Seq(
(1L, "Alice"),
(2L, "Bob"),
(3L, "Charlie"),
(4L, "David"),
(5L, "Eve")
))
// Define edges
val edges: RDD[Edge[String]] = sc.parallelize(Seq(
Edge(1L, 2L, "friend"),
Edge(2L, 3L, "follow"),
Edge(3L, 4L, "colleague"),
Edge(4L, 5L, "friend"),
Edge(5L, 1L, "follow")
))
// Create the graph
val graph: Graph[String, String] = Graph(vertices, edges)
// Print vertices and edges
println("Vertices:")
graph.vertices.collect.foreach(println)
println("Edges:")
graph.edges.collect.foreach(println)
}
}
```
---
Common GraphX Operations
1. Basic Graph Properties
You can extract useful properties of the graph, such as the number of vertices and edges, as follows:
```scala
println(s"Number of vertices: ${graph.vertices.count}")
println(s"Number of edges: ${graph.edges.count}")
```
2. Subgraph Filtering
To filter a subgraph based on a condition, use the `subgraph` function:
```scala
val subgraph = graph.subgraph(epred = edge => edge.attr == "friend")
subgraph.edges.collect.foreach(println)
```
This example creates a subgraph containing only edges labeled as "friend."
Built-in Algorithms in GraphX
GraphX provides several pre-built algorithms that simplify common graph analytics tasks.
PageRank
PageRank is used to rank nodes based on their importance. It’s widely applied in web search and social networks.
```scala
val ranks = graph.pageRank(0.001).vertices
ranks.collect.foreach { case (id, rank) => println(s"Vertex $id has rank $rank") }
```
Connected Components
Identifies connected subgraphs within the graph:
```scala
val connectedComponents = graph.connectedComponents().vertices
connectedComponents.collect.foreach { case (id, component) => println(s"Vertex $id belongs to component $component") }
Triangle Counting
Counts the number of triangles each vertex is part of:
```scala
val triangleCounts = graph.triangleCount().vertices
triangleCounts.collect.foreach { case (id, count) => println(s"Vertex $id is part of $count triangles") }
Real-World Use Cases
1. Social Network Analysis:
GraphX can find communities, key people, and relationships in social networks like Facebook and LinkedIn.
2. Recommendation Systems:
Use graph-based algorithms to recommend products, movies, or content based on user interactions.
3. Fraud Detection:
Detect fraudulent patterns by analyzing transaction networks and identifying anomalies.
4. Knowledge Graphs:
Build and query knowledge graphs for tasks like semantic search and natural language understanding.
Best Practices for Using GraphX
1. Optimize Storage:
Use efficient data formats such as Parquet or ORC for storing graph data.
2. Partitioning:
Partition large graphs to improve parallelism and reduce shuffle operations.
3. Memory Management:
Use Spark’s caching mechanisms (`persist` or `cache`) to manage memory effectively.
4. Leverage Scala’s Functional Programming:
Scala's concise syntax and functional programming make graph transformations more expressive and simpler.
How to obtain Apache Spark and Scala certification?
We are an Education Technology company providing certification training courses to accelerate careers of working professionals worldwide. We impart training through instructor-led classroom workshops, instructor-led live virtual training sessions, and self-paced e-learning courses.
We have successfully conducted training sessions in 108 countries across the globe and enabled thousands of working professionals to enhance the scope of their careers.
Our enterprise training portfolio includes in-demand and globally recognized certification training courses in Project Management, Quality Management, Business Analysis, IT Service Management, Agile and Scrum, Cyber Security, Data Science, and Emerging Technologies. Download our Enterprise Training Catalog from https://www.icertglobal.com/corporate-training-for-enterprises.php and https://www.icertglobal.com/index.php
Popular Courses include:
-
Project Management: PMP, CAPM ,PMI RMP
-
Quality Management: Six Sigma Black Belt ,Lean Six Sigma Green Belt, Lean Management, Minitab,CMMI
-
Business Analysis: CBAP, CCBA, ECBA
-
Agile Training: PMI-ACP , CSM , CSPO
-
Scrum Training: CSM
-
DevOps
-
Program Management: PgMP
-
Cloud Technology: Exin Cloud Computing
-
Citrix Client Adminisration: Citrix Cloud Administration
The 10 top-paying certifications to target in 2024 are:
Conclusion
GraphX is a powerful tool for distributed graph processing. It is integrated with the Apache Spark ecosystem and uses Scala's flexibility. GraphX enables scalable, efficient processing of complex graph data. It can analyze social networks and build recommendation engines. By mastering GraphX and Scala, developers can improve data analytics. They will gain a competitive edge in big data.
GraphX has the tools to tackle tough challenges in interconnected data. It suits both seasoned data scientists and new developers. So, get started today! Explore the exciting possibilities of graph analytics with Apache Spark and Scala!
Contact Us For More Information:
Visit :www.icertglobal.com Email :

Real World Apache Kafka Monitoring and Troubleshooting Tips
Apache Kafka is a robust distributed event-streaming platform known for its reliability and scalability. However, as systems grow in complexity, monitoring and troubleshooting Kafka clusters become crucial to ensure smooth operation. Here, we’ll dive into real-world tips and tools for effectively monitoring and troubleshooting Apache Kafka.
1. Monitoring Key Kafka Metrics
To maintain Kafka’s health, it’s essential to monitor specific metrics regularly. Here are some key ones to watch:
Broker Metrics: Keep an eye on CPU usage, memory utilization, disk I/O, and network bandwidth across brokers. High CPU or memory usage can lead to performance degradation.
Partition Under-Replicated Count: This metric reveals if any partitions lack the required number of replicas, which could affect data availability.
Consumer Lag: Consumer lag measures the difference between the latest record in a partition and the last record consumed. High consumer lag indicates that consumers are not processing messages fast enough.
Request Latency: Measure the time it takes to process produce, fetch, and other client requests. Latency spikes might signal an overloaded broker.
Disk Usage: Kafka stores data on disk, and it’s crucial to monitor disk usage, especially for logs. Running out of disk space can lead to data loss or even cluster failure.
Tools for Monitoring:
Prometheus and Grafana: Use Prometheus for scraping metrics and Grafana for visualizing Kafka’s health. Together, they make a powerful monitoring solution.
Confluent Control Center: This provides a dedicated UI for Kafka monitoring, which is particularly helpful if you’re using Confluent’s Kafka distribution.
2. Set Up Effective Alerting
Monitoring is essential, but proactive alerting will help you address issues before they become critical. Configure alerts for key metrics, such as:
Broker Down Alert: Trigger an alert if any broker goes down, which may indicate issues with hardware or connectivity.
High Consumer Lag Alert: Set alerts if consumer lag exceeds a defined threshold. This can help detect issues with consumer performance or identify bottlenecks.
Low ISR (In-Sync Replicas) Alert: Alert if the ISR count falls below a certain level. A low ISR count often means replication issues, potentially leading to data loss.
Disk Usage Alert: Alert if disk usage nears capacity on any broker to avoid cluster downtime.
Effective alerts ensure you’re informed of potential problems in time to take corrective action.
3. Log Aggregation and Analysis
Kafka’s logs are a rich source of insights into cluster health. Here are some logging best practices:
Centralize Kafka Logs: Use a centralized logging solution like the ELK stack (Elasticsearch, Logstash, and Kibana) or Splunk to aggregate Kafka logs. This makes it easier to search and analyze logs when troubleshooting issues.
Track Error Logs: Pay close attention to logs for errors such as `NotLeaderForPartitionException` and `CorruptRecordException`, which often indicate partition or data corruption issues.
Enable Audit Logging: If you handle sensitive data, enable audit logs to track who accesses what data, aiding both security and compliance.
Logs are an essential part of your Kafka monitoring strategy, especially for diagnosing unusual events or errors.
4. Optimizing Consumer Lag
High consumer lag can indicate that your consumers are struggling to keep up with the data stream. To troubleshoot:
Increase Consumer Throughput: Scaling the number of consumer instances or optimizing processing logic can help reduce lag.
Adjust Fetch and Poll Configurations: Kafka consumers have settings like `fetch.max.bytes` and `poll.timeout.ms`. Tuning these parameters can improve how consumers handle data and reduce lag.
Balance Partitions Across Consumers: Kafka works best when partitions are evenly distributed across consumers in a consumer group. If consumers are unevenly distributed, performance may suffer.
5. Managing Kafka Configuration for Stability
Configuration issues can often lead to performance degradation or even cluster downtime. Here are a few configuration tips:
Optimize Topic Partitions: The number of partitions affects Kafka’s scalability. While more partitions can increase parallelism, they also add overhead. Choose a partition count that aligns with your throughput needs.
Fine-Tune Retention Policies: Kafka’s retention settings control how long data is kept. Set the `log.retention.hours` or `log.retention.bytes` properties based on your storage capacity and business requirements to prevent excessive disk usage.
Adjust Replication Factor: Increasing the replication factor improves data durability but requires more disk space. A replication factor of 3 is a common best practice for balancing durability and resource usage.
6. Diagnosing Common Kafka Issues
Here are some troubleshooting tips for common Kafka issues:
Leader Election Delays: If Kafka is taking a long time to elect new leaders after a broker failure, consider tuning `leader.imbalance.check.interval.seconds` and `leader.imbalance.per.broker.percentage` to speed up re-election.
Slow Producers: If producers are slow, check the broker’s network and disk I/O performance. Network bottlenecks or slow disks often cause producer delays.
Connection Errors: Connection issues between producers or consumers and Kafka brokers can stem from network issues or broker overload. Increasing the connection timeout and verifying firewall configurations can help resolve these issues.
7. Using Kafka Management Tools
Using specialized Kafka management tools can greatly simplify monitoring and troubleshooting:
Kafka Manager: A GUI tool for monitoring Kafka brokers, topics, and partitions, Kafka Manager helps with balancing partition distribution and visualizing cluster health.
Cruise Control: This tool automates Kafka cluster balancing and resource optimization, helping to reduce manual intervention for performance tuning.
Burrow: Burrow is a monitoring tool focused on tracking consumer lag, with a customizable alerting system to notify you if lag exceeds acceptable thresholds.
8. Establishing a Proactive Kafka Maintenance Routine
A routine maintenance strategy will help keep Kafka running smoothly. Here are some regular maintenance tasks:
Review Broker Logs Weekly: Look for any recurring warnings or errors and investigate them proactively.
Test Broker Failover: Conduct routine failover testing to ensure brokers are configured correctly and that leader election works as expected.
Audit Partition Distribution: Ensure partitions are balanced across brokers to prevent certain brokers from becoming performance bottlenecks.
How to obtain Apache and Kafka certification?
We are an Education Technology company providing certification training courses to accelerate careers of working professionals worldwide. We impart training through instructor-led classroom workshops, instructor-led live virtual training sessions, and self-paced e-learning courses.
We have successfully conducted training sessions in 108 countries across the globe and enabled thousands of working professionals to enhance the scope of their careers.
Our enterprise training portfolio includes in-demand and globally recognized certification training courses in Project Management, Quality Management, Business Analysis, IT Service Management, Agile and Scrum, Cyber Security, Data Science, and Emerging Technologies. Download our Enterprise Training Catalog from https://www.icertglobal.com/corporate-training-for-enterprises.php and https://www.icertglobal.com/index.php
Popular Courses include:
-
Project Management: PMP, CAPM ,PMI RMP
-
Quality Management: Six Sigma Black Belt ,Lean Six Sigma Green Belt, Lean Management, Minitab,CMMI
-
Business Analysis: CBAP, CCBA, ECBA
-
Agile Training: PMI-ACP , CSM , CSPO
-
Scrum Training: CSM
-
DevOps
-
Program Management: PgMP
-
Cloud Technology: Exin Cloud Computing
-
Citrix Client Adminisration: Citrix Cloud Administration
The 10 top-paying certifications to target in 2024 are:
Conclusion
Monitoring and troubleshooting Apache Kafka can be complex, but these tips will help you keep your Kafka clusters reliable and responsive. By setting up comprehensive monitoring, optimizing configurations, using management tools, and conducting routine maintenance, you can proactively address issues and avoid potential downtime.
Contact Us For More Information:
Visit :www.icertglobal.com Email :
Read More
Apache Kafka is a robust distributed event-streaming platform known for its reliability and scalability. However, as systems grow in complexity, monitoring and troubleshooting Kafka clusters become crucial to ensure smooth operation. Here, we’ll dive into real-world tips and tools for effectively monitoring and troubleshooting Apache Kafka.
1. Monitoring Key Kafka Metrics
To maintain Kafka’s health, it’s essential to monitor specific metrics regularly. Here are some key ones to watch:
Broker Metrics: Keep an eye on CPU usage, memory utilization, disk I/O, and network bandwidth across brokers. High CPU or memory usage can lead to performance degradation.
Partition Under-Replicated Count: This metric reveals if any partitions lack the required number of replicas, which could affect data availability.
Consumer Lag: Consumer lag measures the difference between the latest record in a partition and the last record consumed. High consumer lag indicates that consumers are not processing messages fast enough.
Request Latency: Measure the time it takes to process produce, fetch, and other client requests. Latency spikes might signal an overloaded broker.
Disk Usage: Kafka stores data on disk, and it’s crucial to monitor disk usage, especially for logs. Running out of disk space can lead to data loss or even cluster failure.
Tools for Monitoring:
Prometheus and Grafana: Use Prometheus for scraping metrics and Grafana for visualizing Kafka’s health. Together, they make a powerful monitoring solution.
Confluent Control Center: This provides a dedicated UI for Kafka monitoring, which is particularly helpful if you’re using Confluent’s Kafka distribution.
2. Set Up Effective Alerting
Monitoring is essential, but proactive alerting will help you address issues before they become critical. Configure alerts for key metrics, such as:
Broker Down Alert: Trigger an alert if any broker goes down, which may indicate issues with hardware or connectivity.
High Consumer Lag Alert: Set alerts if consumer lag exceeds a defined threshold. This can help detect issues with consumer performance or identify bottlenecks.
Low ISR (In-Sync Replicas) Alert: Alert if the ISR count falls below a certain level. A low ISR count often means replication issues, potentially leading to data loss.
Disk Usage Alert: Alert if disk usage nears capacity on any broker to avoid cluster downtime.
Effective alerts ensure you’re informed of potential problems in time to take corrective action.
3. Log Aggregation and Analysis
Kafka’s logs are a rich source of insights into cluster health. Here are some logging best practices:
Centralize Kafka Logs: Use a centralized logging solution like the ELK stack (Elasticsearch, Logstash, and Kibana) or Splunk to aggregate Kafka logs. This makes it easier to search and analyze logs when troubleshooting issues.
Track Error Logs: Pay close attention to logs for errors such as `NotLeaderForPartitionException` and `CorruptRecordException`, which often indicate partition or data corruption issues.
Enable Audit Logging: If you handle sensitive data, enable audit logs to track who accesses what data, aiding both security and compliance.
Logs are an essential part of your Kafka monitoring strategy, especially for diagnosing unusual events or errors.
4. Optimizing Consumer Lag
High consumer lag can indicate that your consumers are struggling to keep up with the data stream. To troubleshoot:
Increase Consumer Throughput: Scaling the number of consumer instances or optimizing processing logic can help reduce lag.
Adjust Fetch and Poll Configurations: Kafka consumers have settings like `fetch.max.bytes` and `poll.timeout.ms`. Tuning these parameters can improve how consumers handle data and reduce lag.
Balance Partitions Across Consumers: Kafka works best when partitions are evenly distributed across consumers in a consumer group. If consumers are unevenly distributed, performance may suffer.
5. Managing Kafka Configuration for Stability
Configuration issues can often lead to performance degradation or even cluster downtime. Here are a few configuration tips:
Optimize Topic Partitions: The number of partitions affects Kafka’s scalability. While more partitions can increase parallelism, they also add overhead. Choose a partition count that aligns with your throughput needs.
Fine-Tune Retention Policies: Kafka’s retention settings control how long data is kept. Set the `log.retention.hours` or `log.retention.bytes` properties based on your storage capacity and business requirements to prevent excessive disk usage.
Adjust Replication Factor: Increasing the replication factor improves data durability but requires more disk space. A replication factor of 3 is a common best practice for balancing durability and resource usage.
6. Diagnosing Common Kafka Issues
Here are some troubleshooting tips for common Kafka issues:
Leader Election Delays: If Kafka is taking a long time to elect new leaders after a broker failure, consider tuning `leader.imbalance.check.interval.seconds` and `leader.imbalance.per.broker.percentage` to speed up re-election.
Slow Producers: If producers are slow, check the broker’s network and disk I/O performance. Network bottlenecks or slow disks often cause producer delays.
Connection Errors: Connection issues between producers or consumers and Kafka brokers can stem from network issues or broker overload. Increasing the connection timeout and verifying firewall configurations can help resolve these issues.
7. Using Kafka Management Tools
Using specialized Kafka management tools can greatly simplify monitoring and troubleshooting:
Kafka Manager: A GUI tool for monitoring Kafka brokers, topics, and partitions, Kafka Manager helps with balancing partition distribution and visualizing cluster health.
Cruise Control: This tool automates Kafka cluster balancing and resource optimization, helping to reduce manual intervention for performance tuning.
Burrow: Burrow is a monitoring tool focused on tracking consumer lag, with a customizable alerting system to notify you if lag exceeds acceptable thresholds.
8. Establishing a Proactive Kafka Maintenance Routine
A routine maintenance strategy will help keep Kafka running smoothly. Here are some regular maintenance tasks:
Review Broker Logs Weekly: Look for any recurring warnings or errors and investigate them proactively.
Test Broker Failover: Conduct routine failover testing to ensure brokers are configured correctly and that leader election works as expected.
Audit Partition Distribution: Ensure partitions are balanced across brokers to prevent certain brokers from becoming performance bottlenecks.
How to obtain Apache and Kafka certification?
We are an Education Technology company providing certification training courses to accelerate careers of working professionals worldwide. We impart training through instructor-led classroom workshops, instructor-led live virtual training sessions, and self-paced e-learning courses.
We have successfully conducted training sessions in 108 countries across the globe and enabled thousands of working professionals to enhance the scope of their careers.
Our enterprise training portfolio includes in-demand and globally recognized certification training courses in Project Management, Quality Management, Business Analysis, IT Service Management, Agile and Scrum, Cyber Security, Data Science, and Emerging Technologies. Download our Enterprise Training Catalog from https://www.icertglobal.com/corporate-training-for-enterprises.php and https://www.icertglobal.com/index.php
Popular Courses include:
-
Project Management: PMP, CAPM ,PMI RMP
-
Quality Management: Six Sigma Black Belt ,Lean Six Sigma Green Belt, Lean Management, Minitab,CMMI
-
Business Analysis: CBAP, CCBA, ECBA
-
Agile Training: PMI-ACP , CSM , CSPO
-
Scrum Training: CSM
-
DevOps
-
Program Management: PgMP
-
Cloud Technology: Exin Cloud Computing
-
Citrix Client Adminisration: Citrix Cloud Administration
The 10 top-paying certifications to target in 2024 are:
Conclusion
Monitoring and troubleshooting Apache Kafka can be complex, but these tips will help you keep your Kafka clusters reliable and responsive. By setting up comprehensive monitoring, optimizing configurations, using management tools, and conducting routine maintenance, you can proactively address issues and avoid potential downtime.
Contact Us For More Information:
Visit :www.icertglobal.com Email :

Streamlining Report Sharing and Collaboration in Power BI
In today’s data-driven world, sharing insights quickly and effectively is essential for agile decision-making. Power BI, Microsoft’s powerful business analytics tool, provides several features to facilitate seamless report sharing and collaboration across teams. Whether you’re working on a team project, presenting to stakeholders, or setting up real-time dashboards for clients, Power BI makes it easy to share insights and encourage collaboration. This blog will walk you through the different ways to streamline report sharing and collaboration in Power BI, so your team can stay informed and engaged.
1. Understanding Power BI Workspaces for Team Collaboration
Power BI workspaces are collaborative environments where teams can work on reports and datasets together. Here’s how to make the most of them:
Creating a Workspace: In Power BI, you can create a workspace for each project, department, or team. This central location lets team members access, edit, and manage Power BI content collaboratively.
Assigning Roles: To ensure data security and organized access, Power BI allows you to assign different roles within the workspace, such as Admin, Member, Contributor, and Viewer. Setting appropriate permissions ensures that sensitive data is only accessible to authorized users.
Publishing Reports to the Workspace: Once a report is published to a workspace, team members can access it based on their roles, making it easy to share insights without duplicating files.
2. Leveraging Power BI Service for Web-Based Sharing
Power BI Service (the online version of Power BI) is a convenient platform for sharing and viewing reports on any device. Here are some sharing options within Power BI Service:
Share Reports Directly with Users: You can share reports with individuals by entering their email addresses and setting their access level. This is ideal for sharing insights with specific team members or clients without requiring them to download the Power BI desktop app.
Generate Links for Easy Access: Power BI also allows you to generate a shareable link to a report or dashboard. This link can be shared with anyone in your organization, providing an efficient way to distribute insights widely.
Embed Reports in Websites or Portals: For public reports or insights you want to embed in internal portals, you can use the “Embed” feature to generate HTML code that can be added to your website or SharePoint.
3. Embedding Power BI in Microsoft Teams for Real-Time Collaboration
Integrating Power BI with Microsoft Teams allows teams to discuss insights in real time, enhancing collaboration. Here’s how you can use Power BI within Teams:
- Adding Reports to Teams Channels: You can embed Power BI reports directly into specific Teams channels. This enables team members to view and discuss insights without switching between platforms.
- Utilizing Teams Chats for Updates: Once a report is added to a channel, team members can leave comments, share feedback, and even tag others in the chat to drive data-driven discussions.
- Using the Power BI Tab in Teams: Add a Power BI tab to your Teams dashboard for quick access to reports. This is especially useful for team members who may not use Power BI regularly but need to stay updated on key metrics.
4. Using Power BI Apps for Large-Scale Distribution
Power BI Apps allow you to bundle multiple dashboards and reports into a single app that can be shared with many users. This is useful for large organizations. Different departments may need tailored access to a suite of reports.
- Creating and Publishing an App: To create an app, select multiple reports or dashboards from your workspace and package them together. Once the app is created, you can publish it to the organization and set specific access permissions for different user groups.
- Updating Apps for Continuous Collaboration: When you update an app, all users with access see the changes instantly. This ensures everyone is aligned with the latest insights.
5. Utilizing Power BI’s Export and Print Options
Power BI offers several ways to export reports, making it easy to share data with users outside of the Power BI environment:
Exporting to PDF or PowerPoint: Power BI reports can be exported to PDF or PowerPoint. These formats are ideal for executive presentations and reports.
- Printing Reports: Power BI's print feature is useful for sharing insights at meetings or events where digital access may not be available.
- Data Export to Excel: For users who prefer raw data for deeper analysis, Power BI allows you to export data tables to Excel. This way, users can filter, sort, or apply additional analyses.
6. Setting Up Data Alerts and Subscriptions
Data alerts and subscriptions are valuable features in Power BI that help team members stay informed of changes in key metrics:
- Creating Data Alerts: Data alerts can be set on key metrics or visuals to notify users when a threshold is reached. For example, set an alert to trigger when sales exceed a target. This will ensure stakeholders are immediately informed.
- Setting Up Email Subscriptions: Users can subscribe to receive snapshots of specific reports or dashboards at set times. This is useful for teams that need regular updates on key performance indicators (KPIs) without logging into Power BI daily.
7. Best Practices for Secure Sharing and Collaboration
Data security is crucial when sharing reports across an organization. Here are some best practices to keep data secure:
- Use Row-Level Security (RLS): RLS allows you to restrict data access based on users’ roles. For example, you can create RLS rules that limit regional sales managers to view only their respective regions.
- Audit and Monitor Access: Regularly review user access and sharing activity to ensure only authorized users can access reports.
- Limit Export Permissions: If sensitive data should not be exported, Power BI allows you to disable export options for specific reports.
How to obtain Power BI certification?
We are an Education Technology company providing certification training courses to accelerate careers of working professionals worldwide. We impart training through instructor-led classroom workshops, instructor-led live virtual training sessions, and self-paced e-learning courses.
We have successfully conducted training sessions in 108 countries across the globe and enabled thousands of working professionals to enhance the scope of their careers.
Our enterprise training portfolio includes in-demand and globally recognized certification training courses in Project Management, Quality Management, Business Analysis, IT Service Management, Agile and Scrum, Cyber Security, Data Science, and Emerging Technologies. Download our Enterprise Training Catalog from https://www.icertglobal.com/corporate-training-for-enterprises.php and https://www.icertglobal.com/index.php
Popular Courses include:
-
Project Management: PMP, CAPM ,PMI RMP
-
Quality Management: Six Sigma Black Belt ,Lean Six Sigma Green Belt, Lean Management, Minitab,CMMI
-
Business Analysis: CBAP, CCBA, ECBA
-
Agile Training: PMI-ACP , CSM , CSPO
-
Scrum Training: CSM
-
DevOps
-
Program Management: PgMP
-
Cloud Technology: Exin Cloud Computing
-
Citrix Client Adminisration: Citrix Cloud Administration
The 10 top-paying certifications to target in 2024 are:
Conclusion
Power BI’s robust sharing and collaboration features make it easy for teams to work together and stay informed. There are many ways to customize how insights are shared and discussed. This includes workspaces, apps, Teams integration, and alert notifications. By following the tips, you can improve collaboration. You'll ensure everyone has the latest, relevant data insights.
Contact Us For More Information:
Visit :www.icertglobal.com Email :
Read More
In today’s data-driven world, sharing insights quickly and effectively is essential for agile decision-making. Power BI, Microsoft’s powerful business analytics tool, provides several features to facilitate seamless report sharing and collaboration across teams. Whether you’re working on a team project, presenting to stakeholders, or setting up real-time dashboards for clients, Power BI makes it easy to share insights and encourage collaboration. This blog will walk you through the different ways to streamline report sharing and collaboration in Power BI, so your team can stay informed and engaged.
1. Understanding Power BI Workspaces for Team Collaboration
Power BI workspaces are collaborative environments where teams can work on reports and datasets together. Here’s how to make the most of them:
Creating a Workspace: In Power BI, you can create a workspace for each project, department, or team. This central location lets team members access, edit, and manage Power BI content collaboratively.
Assigning Roles: To ensure data security and organized access, Power BI allows you to assign different roles within the workspace, such as Admin, Member, Contributor, and Viewer. Setting appropriate permissions ensures that sensitive data is only accessible to authorized users.
Publishing Reports to the Workspace: Once a report is published to a workspace, team members can access it based on their roles, making it easy to share insights without duplicating files.
2. Leveraging Power BI Service for Web-Based Sharing
Power BI Service (the online version of Power BI) is a convenient platform for sharing and viewing reports on any device. Here are some sharing options within Power BI Service:
Share Reports Directly with Users: You can share reports with individuals by entering their email addresses and setting their access level. This is ideal for sharing insights with specific team members or clients without requiring them to download the Power BI desktop app.
Generate Links for Easy Access: Power BI also allows you to generate a shareable link to a report or dashboard. This link can be shared with anyone in your organization, providing an efficient way to distribute insights widely.
Embed Reports in Websites or Portals: For public reports or insights you want to embed in internal portals, you can use the “Embed” feature to generate HTML code that can be added to your website or SharePoint.
3. Embedding Power BI in Microsoft Teams for Real-Time Collaboration
Integrating Power BI with Microsoft Teams allows teams to discuss insights in real time, enhancing collaboration. Here’s how you can use Power BI within Teams:
- Adding Reports to Teams Channels: You can embed Power BI reports directly into specific Teams channels. This enables team members to view and discuss insights without switching between platforms.
- Utilizing Teams Chats for Updates: Once a report is added to a channel, team members can leave comments, share feedback, and even tag others in the chat to drive data-driven discussions.
- Using the Power BI Tab in Teams: Add a Power BI tab to your Teams dashboard for quick access to reports. This is especially useful for team members who may not use Power BI regularly but need to stay updated on key metrics.
4. Using Power BI Apps for Large-Scale Distribution
Power BI Apps allow you to bundle multiple dashboards and reports into a single app that can be shared with many users. This is useful for large organizations. Different departments may need tailored access to a suite of reports.
- Creating and Publishing an App: To create an app, select multiple reports or dashboards from your workspace and package them together. Once the app is created, you can publish it to the organization and set specific access permissions for different user groups.
- Updating Apps for Continuous Collaboration: When you update an app, all users with access see the changes instantly. This ensures everyone is aligned with the latest insights.
5. Utilizing Power BI’s Export and Print Options
Power BI offers several ways to export reports, making it easy to share data with users outside of the Power BI environment:
Exporting to PDF or PowerPoint: Power BI reports can be exported to PDF or PowerPoint. These formats are ideal for executive presentations and reports.
- Printing Reports: Power BI's print feature is useful for sharing insights at meetings or events where digital access may not be available.
- Data Export to Excel: For users who prefer raw data for deeper analysis, Power BI allows you to export data tables to Excel. This way, users can filter, sort, or apply additional analyses.
6. Setting Up Data Alerts and Subscriptions
Data alerts and subscriptions are valuable features in Power BI that help team members stay informed of changes in key metrics:
- Creating Data Alerts: Data alerts can be set on key metrics or visuals to notify users when a threshold is reached. For example, set an alert to trigger when sales exceed a target. This will ensure stakeholders are immediately informed.
- Setting Up Email Subscriptions: Users can subscribe to receive snapshots of specific reports or dashboards at set times. This is useful for teams that need regular updates on key performance indicators (KPIs) without logging into Power BI daily.
7. Best Practices for Secure Sharing and Collaboration
Data security is crucial when sharing reports across an organization. Here are some best practices to keep data secure:
- Use Row-Level Security (RLS): RLS allows you to restrict data access based on users’ roles. For example, you can create RLS rules that limit regional sales managers to view only their respective regions.
- Audit and Monitor Access: Regularly review user access and sharing activity to ensure only authorized users can access reports.
- Limit Export Permissions: If sensitive data should not be exported, Power BI allows you to disable export options for specific reports.
How to obtain Power BI certification?
We are an Education Technology company providing certification training courses to accelerate careers of working professionals worldwide. We impart training through instructor-led classroom workshops, instructor-led live virtual training sessions, and self-paced e-learning courses.
We have successfully conducted training sessions in 108 countries across the globe and enabled thousands of working professionals to enhance the scope of their careers.
Our enterprise training portfolio includes in-demand and globally recognized certification training courses in Project Management, Quality Management, Business Analysis, IT Service Management, Agile and Scrum, Cyber Security, Data Science, and Emerging Technologies. Download our Enterprise Training Catalog from https://www.icertglobal.com/corporate-training-for-enterprises.php and https://www.icertglobal.com/index.php
Popular Courses include:
-
Project Management: PMP, CAPM ,PMI RMP
-
Quality Management: Six Sigma Black Belt ,Lean Six Sigma Green Belt, Lean Management, Minitab,CMMI
-
Business Analysis: CBAP, CCBA, ECBA
-
Agile Training: PMI-ACP , CSM , CSPO
-
Scrum Training: CSM
-
DevOps
-
Program Management: PgMP
-
Cloud Technology: Exin Cloud Computing
-
Citrix Client Adminisration: Citrix Cloud Administration
The 10 top-paying certifications to target in 2024 are:
Conclusion
Power BI’s robust sharing and collaboration features make it easy for teams to work together and stay informed. There are many ways to customize how insights are shared and discussed. This includes workspaces, apps, Teams integration, and alert notifications. By following the tips, you can improve collaboration. You'll ensure everyone has the latest, relevant data insights.
Contact Us For More Information:
Visit :www.icertglobal.com Email :
Data Engineering vs Data Science: Key Differences Explained
As data engineering and data science grow in demand, many may wonder about the differences between the two fields. While both are related to the processing and analysis of data, there are key differences that set these roles apart. This article will explore the nuances of data engineering and data science. We will cover the skills, career paths, job prospects, and salaries in each field.
What is Data Engineering?
Data engineering is the design and construction of systems for collecting, storing, and processing data. Data engineers build data pipelines and ETL (extract, transform, load) processes. They also model and clean data. They work closely with data scientists and analysts to ensure that data is readily accessible and in the right format for analysis.
Skills Required for Data Engineering
1. Programming Skills
-
Python: Widely used for data processing, scripting, and automation.
-
Java/Scala: Often needed for working with big data frameworks like Apache Spark and Hadoop.
-
SQL: Fundamental for querying and manipulating relational databases.
2. Understanding of Data Architecture and Data Modeling
-
Data Modeling: Designing data schemas that efficiently support business needs and analytics.
-
Data Warehousing: Know data warehouse design, star and snowflake schemas, and dimensional modeling.
-
ETL (Extract, Transform, Load): It is the process of moving and transforming data from various sources to a target system.
3. Big Data Technologies
-
Apache Hadoop: For large-scale data storage and processing.
-
Apache Spark: Popular for real-time data processing and analytics.
-
Kafka: For real-time data streaming and handling large data inflows.
-
NoSQL Databases: Knowledge of MongoDB, Cassandra, or HBase for unstructured data.
4. Data Warehousing Solutions
-
AWS Redshift, Google BigQuery, Snowflake, and Azure Synapse are popular cloud data warehouses.
-
Traditional Data Warehouses: Teradata, Oracle, and similar systems are still common in enterprises.
5. Data Pipeline Tools
-
Apache Airflow: For workflow scheduling and orchestrating complex ETL tasks.
-
Luigi, Prefect: Alternatives to Airflow, each with unique benefits for managing data workflows.
-
ETL Tools: Talend, Informatica, and Microsoft SSIS are often used in larger organizations for ETL tasks.
6. Database Management Systems (DBMS)
-
Relational Databases: Proficiency in MySQL, PostgreSQL, and SQL Server.
-
Columnar Databases: Familiarity with databases like Amazon Redshift and BigQuery for analytical processing.
7. Data Lakes and Storage Solutions
-
Data Lake Management: Know tools for cheap, large-scale raw data storage.
-
Cloud Storage Solutions: AWS S3, Google Cloud Storage, Azure Blob Storage.
-
Delta Lake/Apache Hudi: Layered on top of data lakes to ensure data integrity and support ACID transactions.
8. Data Cleaning and Transformation Skills
-
Data Cleaning: Ability to use tools to fix missing values, duplicates, and inconsistencies.
-
Data Transformation: Understanding how to reshape, aggregate, and structure data for analysis.
9. Cloud Platforms and Services
-
Amazon Web Services (AWS): Redshift, Glue, EMR, S3, Lambda.
-
Google Cloud Platform (GCP): BigQuery, Dataflow, Cloud Storage, Dataproc.
-
Microsoft Azure: Azure Data Factory, Synapse Analytics, Blob Storage.
-
Cloud Computing Fundamentals: Key cloud concepts, cost optimization, and security.
10. Stream Processing
-
Real-Time Data Processing: Use tools like Apache Kafka, Apache Flink, and Spark Streaming. They handle continuous data streams.
-
Message Queues: Know message queues like RabbitMQ or Amazon Kinesis. They are for data ingestion and real-time analytics.
What is Data Science?
Data science is about analysing complex data sets. It aims to extract insights and make data-driven decisions. Data scientists use statistical and mathematical techniques to find patterns in data. This work leads to predictive analytics and business intelligence. They are skilled in machine learning, data mining, and data visualization. They use these skills to interpret and share findings.
Skills Required for Data Science
-
Proficiency in programming languages such as Python, R, and SQL
-
Strong background in statistics and mathematics
-
Knowledge of machine learning models and algorithms
-
Experience with data visualization tools and techniques
-
Ability to work with structured and unstructured data
-
Proficiency in data storytelling and communicating insights to stakeholders
Comparison and Career Paths
Data engineers focus on the infrastructure of data systems. Data scientists analyze data to find insights. Both are key to the data lifecycle. Data engineers build the foundation for data science work. Data engineers usually earn a bit more than data scientists. Their work requires specialized skills in data infrastructure design and development. Both data engineering and data science jobs are in high demand across industries. Companies are relying more on data-driven insights for decisions. This is increasing the demand for skilled professionals in these fields. Data engineers may find work in data warehousing, architecture, and transformation. Data scientists can explore roles in predictive analytics, machine learning, and data visualization.
Salary and Job Prospects
Surveys show that data engineers earn $90,000 to $130,000 a year, depending on experience and location. Data scientists can expect to earn $100,000 to $150,000 annually. They may also get bonuses and benefits for skills in deep learning and AI. Both data engineering and data science offer rewarding careers. They have many opportunities for growth and advancement. A career in data engineering or data science can be rewarding. It can lead to a bright future in data analytics. You can build scalable data solutions or uncover insights from complex datasets.
How to obtain Data Science certification?
We are an Education Technology company providing certification training courses to accelerate careers of working professionals worldwide. We impart training through instructor-led classroom workshops, instructor-led live virtual training sessions, and self-paced e-learning courses.
We have successfully conducted training sessions in 108 countries across the globe and enabled thousands of working professionals to enhance the scope of their careers.
Our enterprise training portfolio includes in-demand and globally recognized certification training courses in Project Management, Quality Management, Business Analysis, IT Service Management, Agile and Scrum, Cyber Security, Data Science, and Emerging Technologies. Download our Enterprise Training Catalog from https://www.icertglobal.com/corporate-training-for-enterprises.php and https://www.icertglobal.com/index.php
Popular Courses include:
-
Project Management: PMP, CAPM ,PMI RMP
-
Quality Management: Six Sigma Black Belt ,Lean Six Sigma Green Belt, Lean Management, Minitab,CMMI
-
Business Analysis: CBAP, CCBA, ECBA
-
Agile Training: PMI-ACP , CSM , CSPO
-
Scrum Training: CSM
-
DevOps
-
Program Management: PgMP
-
Cloud Technology: Exin Cloud Computing
-
Citrix Client Adminisration: Citrix Cloud Administration
The 10 top-paying certifications to target in 2024 are:
Conclusion
In conclusion, both fields aim to use data to drive innovation and decision-making. But, their specific skills and roles differ greatly. Knowing the differences between data engineering and data science can help people decide on their careers. They can then pursue jobs that match their interests and skills.
Contact Us For More Information:
Visit :www.icertglobal.com Email :
Read More
As data engineering and data science grow in demand, many may wonder about the differences between the two fields. While both are related to the processing and analysis of data, there are key differences that set these roles apart. This article will explore the nuances of data engineering and data science. We will cover the skills, career paths, job prospects, and salaries in each field.
What is Data Engineering?
Data engineering is the design and construction of systems for collecting, storing, and processing data. Data engineers build data pipelines and ETL (extract, transform, load) processes. They also model and clean data. They work closely with data scientists and analysts to ensure that data is readily accessible and in the right format for analysis.
Skills Required for Data Engineering
1. Programming Skills
-
Python: Widely used for data processing, scripting, and automation.
-
Java/Scala: Often needed for working with big data frameworks like Apache Spark and Hadoop.
-
SQL: Fundamental for querying and manipulating relational databases.
2. Understanding of Data Architecture and Data Modeling
-
Data Modeling: Designing data schemas that efficiently support business needs and analytics.
-
Data Warehousing: Know data warehouse design, star and snowflake schemas, and dimensional modeling.
-
ETL (Extract, Transform, Load): It is the process of moving and transforming data from various sources to a target system.
3. Big Data Technologies
-
Apache Hadoop: For large-scale data storage and processing.
-
Apache Spark: Popular for real-time data processing and analytics.
-
Kafka: For real-time data streaming and handling large data inflows.
-
NoSQL Databases: Knowledge of MongoDB, Cassandra, or HBase for unstructured data.
4. Data Warehousing Solutions
-
AWS Redshift, Google BigQuery, Snowflake, and Azure Synapse are popular cloud data warehouses.
-
Traditional Data Warehouses: Teradata, Oracle, and similar systems are still common in enterprises.
5. Data Pipeline Tools
-
Apache Airflow: For workflow scheduling and orchestrating complex ETL tasks.
-
Luigi, Prefect: Alternatives to Airflow, each with unique benefits for managing data workflows.
-
ETL Tools: Talend, Informatica, and Microsoft SSIS are often used in larger organizations for ETL tasks.
6. Database Management Systems (DBMS)
-
Relational Databases: Proficiency in MySQL, PostgreSQL, and SQL Server.
-
Columnar Databases: Familiarity with databases like Amazon Redshift and BigQuery for analytical processing.
7. Data Lakes and Storage Solutions
-
Data Lake Management: Know tools for cheap, large-scale raw data storage.
-
Cloud Storage Solutions: AWS S3, Google Cloud Storage, Azure Blob Storage.
-
Delta Lake/Apache Hudi: Layered on top of data lakes to ensure data integrity and support ACID transactions.
8. Data Cleaning and Transformation Skills
-
Data Cleaning: Ability to use tools to fix missing values, duplicates, and inconsistencies.
-
Data Transformation: Understanding how to reshape, aggregate, and structure data for analysis.
9. Cloud Platforms and Services
-
Amazon Web Services (AWS): Redshift, Glue, EMR, S3, Lambda.
-
Google Cloud Platform (GCP): BigQuery, Dataflow, Cloud Storage, Dataproc.
-
Microsoft Azure: Azure Data Factory, Synapse Analytics, Blob Storage.
-
Cloud Computing Fundamentals: Key cloud concepts, cost optimization, and security.
10. Stream Processing
-
Real-Time Data Processing: Use tools like Apache Kafka, Apache Flink, and Spark Streaming. They handle continuous data streams.
-
Message Queues: Know message queues like RabbitMQ or Amazon Kinesis. They are for data ingestion and real-time analytics.
What is Data Science?
Data science is about analysing complex data sets. It aims to extract insights and make data-driven decisions. Data scientists use statistical and mathematical techniques to find patterns in data. This work leads to predictive analytics and business intelligence. They are skilled in machine learning, data mining, and data visualization. They use these skills to interpret and share findings.
Skills Required for Data Science
-
Proficiency in programming languages such as Python, R, and SQL
-
Strong background in statistics and mathematics
-
Knowledge of machine learning models and algorithms
-
Experience with data visualization tools and techniques
-
Ability to work with structured and unstructured data
-
Proficiency in data storytelling and communicating insights to stakeholders
Comparison and Career Paths
Data engineers focus on the infrastructure of data systems. Data scientists analyze data to find insights. Both are key to the data lifecycle. Data engineers build the foundation for data science work. Data engineers usually earn a bit more than data scientists. Their work requires specialized skills in data infrastructure design and development. Both data engineering and data science jobs are in high demand across industries. Companies are relying more on data-driven insights for decisions. This is increasing the demand for skilled professionals in these fields. Data engineers may find work in data warehousing, architecture, and transformation. Data scientists can explore roles in predictive analytics, machine learning, and data visualization.
Salary and Job Prospects
Surveys show that data engineers earn $90,000 to $130,000 a year, depending on experience and location. Data scientists can expect to earn $100,000 to $150,000 annually. They may also get bonuses and benefits for skills in deep learning and AI. Both data engineering and data science offer rewarding careers. They have many opportunities for growth and advancement. A career in data engineering or data science can be rewarding. It can lead to a bright future in data analytics. You can build scalable data solutions or uncover insights from complex datasets.
How to obtain Data Science certification?
We are an Education Technology company providing certification training courses to accelerate careers of working professionals worldwide. We impart training through instructor-led classroom workshops, instructor-led live virtual training sessions, and self-paced e-learning courses.
We have successfully conducted training sessions in 108 countries across the globe and enabled thousands of working professionals to enhance the scope of their careers.
Our enterprise training portfolio includes in-demand and globally recognized certification training courses in Project Management, Quality Management, Business Analysis, IT Service Management, Agile and Scrum, Cyber Security, Data Science, and Emerging Technologies. Download our Enterprise Training Catalog from https://www.icertglobal.com/corporate-training-for-enterprises.php and https://www.icertglobal.com/index.php
Popular Courses include:
-
Project Management: PMP, CAPM ,PMI RMP
-
Quality Management: Six Sigma Black Belt ,Lean Six Sigma Green Belt, Lean Management, Minitab,CMMI
-
Business Analysis: CBAP, CCBA, ECBA
-
Agile Training: PMI-ACP , CSM , CSPO
-
Scrum Training: CSM
-
DevOps
-
Program Management: PgMP
-
Cloud Technology: Exin Cloud Computing
-
Citrix Client Adminisration: Citrix Cloud Administration
The 10 top-paying certifications to target in 2024 are:
Conclusion
In conclusion, both fields aim to use data to drive innovation and decision-making. But, their specific skills and roles differ greatly. Knowing the differences between data engineering and data science can help people decide on their careers. They can then pursue jobs that match their interests and skills.
Contact Us For More Information:
Visit :www.icertglobal.com Email :

Integrating Power BI with Microsoft Tools for Insights!
Are you looking to maximize the potential of your data analytics? Do you want to streamline your processes and gain valuable insights from your data? Look no further than integrating Power BI with other Microsoft tools. In this article, we will explore the perfect integration of Power BI with tools like Excel, SharePoint, Teams, Azure, Dynamics 365, SQL Server, and more. Let's dive in!
Power BI Integration with Excel
One of the key benefits of integrating Power BI with Excel is the ability to create dynamic and interactive reports and dashboards. Power BI has great visualization tools. Excel has powerful data analysis tools. You can easily combine data from multiple sources to get a full view of your business insights.
Power BI's Excel integration lets users analyze and visualize data. It combines Excel's familiar tools with Power BI's advanced capabilities. This integration improves data analysis. It lets users share insights and reports from Excel. They can also use Power BI's powerful data modeling and visualization tools. Also, users can import Excel data into Power BI for deeper analysis. They can export Power BI reports back to Excel for further manipulation. This creates a seamless workflow between the two platforms.
Power BI Integration with SharePoint
Integrating Power BI with SharePoint lets you share reports and dashboards easily. SharePoint is a central platform for collaboration. It makes it easy to access and use your Power BI visualizations.
Integrating Power BI with SharePoint enhances data management and reporting capabilities for businesses. This synergy allows users to create dynamic dashboards with real-time data. It transforms static SharePoint reports into interactive, shareable insights. Furthermore, it automates report generation and improves data access from various sources. This streamlines decision-making and boosts efficiency.
Power BI Integration with Teams
With Power BI's integration with Teams, you can embed your reports and dashboards in your Teams workspace. This collaboration keeps team members informed. They can then make data-driven decisions in the familiar Teams environment.
Integrating Power BI with Microsoft Teams boosts collaboration. It lets users access and share interactive reports within Teams. This streamlines communication about data insights. This integration enables real-time discussions and decision-making. Team members can view Power BI dashboards in a channel. They can discuss the data insights there. Also, pinning Power BI reports to Teams channels makes critical data easy to access. This promotes a data-driven culture across the organization.
Power BI Integration with Azure
Integrating Power BI with Azure opens up a world of possibilities for advanced analytics and data visualization. Azure is a secure, scalable cloud platform for hosting your data. Power BI is an analytics tool that extracts insights from it.
Integrating Power BI with Azure creates powerful data analysis and visualization tools. This integration lets organizations use Azure services. These include Azure Synapse Analytics and Azure Data Factory. It enhances their data processing and reporting workflows. Also, OneLake, a unified data lake, ensures all data is accessible across services. This simplifies data management and enables real-time analytics.
Power BI Integration with Dynamics 365
Integrating Power BI with Dynamics 365 gives you a full view of your customer data and business operations. Power BI's analytics and Dynamics 365's CRM and ERP help you grow your business. They enable informed decisions.
Integrating Power BI with Dynamics 365 improves data visualization and decision-making. It gives real-time insights from various sources in one dashboard. Users can easily create customizable reports with drag-and-drop tools. This lets team members analyze trends, monitor performance, and make decisions. They don't need much technical skill. This integration makes workflows smoother and allows departments to share insights. It creates a collaborative environment that drives business success.
Power BI Integration Best Practices
When integrating Power BI with other Microsoft tools, follow best practices. This ensures a smooth and successful integration.
Some key best practices are to:
-
Define clear objectives.
-
Establish data governance policies.
-
Conduct thorough testing.
-
Train end-users.
When integrating Power BI with other data sources, ensure data quality and consistency. So, use robust data cleansing techniques before visualization. Also, using Power BI's connectors and APIs can speed up data retrieval and updates. This will streamline the integration process. Finally, a systematic approach to security is essential. It should include row-level security and monitoring user access. This will protect sensitive data while maximizing your reports' collaborative potential.
Power BI Integration Benefits
The benefits of integrating Power BI with other Microsoft tools are manifold. Integrating Power BI with Excel, SharePoint, Teams, Azure, Dynamics 365, and SQL Server can transform your data analytics. It will enhance collaboration, data sharing, visualizations, and insights.
Integrating Power BI with tools like Excel, Azure, and SharePoint boosts data access and team collaboration. It enables seamless data flow and reporting. It lets users create dashboards that pull real-time data from various sources. This leads to better decisions and more efficient business processes. Also, organizations can use Power BI's advanced analytics with existing systems. This can uncover deeper insights and drive better outcomes.
How to obtain Data Science certification?
We are an Education Technology company providing certification training courses to accelerate careers of working professionals worldwide. We impart training through instructor-led classroom workshops, instructor-led live virtual training sessions, and self-paced e-learning courses.
We have successfully conducted training sessions in 108 countries across the globe and enabled thousands of working professionals to enhance the scope of their careers.
Our enterprise training portfolio includes in-demand and globally recognized certification training courses in Project Management, Quality Management, Business Analysis, IT Service Management, Agile and Scrum, Cyber Security, Data Science, and Emerging Technologies. Download our Enterprise Training Catalog from https://www.icertglobal.com/corporate-training-for-enterprises.php and https://www.icertglobal.com/index.php
Popular Courses include:
-
Project Management: PMP, CAPM ,PMI RMP
-
Quality Management: Six Sigma Black Belt ,Lean Six Sigma Green Belt, Lean Management, Minitab,CMMI
-
Business Analysis: CBAP, CCBA, ECBA
-
Agile Training: PMI-ACP , CSM , CSPO
-
Scrum Training: CSM
-
DevOps
-
Program Management: PgMP
-
Cloud Technology: Exin Cloud Computing
-
Citrix Client Adminisration: Citrix Cloud Administration
The 10 top-paying certifications to target in 2024 are:
Conclusion
In conclusion, using Power BI with other Microsoft tools is a great way to improve data analytics and discover insights. Using Power BI with Excel, SharePoint, Teams, Azure, Dynamics 365, and SQL Server can change your data analytics for the better. It will drive business growth. Don't miss the chance to use your data fully. Integrate Power BI with other Microsoft tools today!
Contact Us For More Information:
Visit :www.icertglobal.com Email :
Read More
Are you looking to maximize the potential of your data analytics? Do you want to streamline your processes and gain valuable insights from your data? Look no further than integrating Power BI with other Microsoft tools. In this article, we will explore the perfect integration of Power BI with tools like Excel, SharePoint, Teams, Azure, Dynamics 365, SQL Server, and more. Let's dive in!
Power BI Integration with Excel
One of the key benefits of integrating Power BI with Excel is the ability to create dynamic and interactive reports and dashboards. Power BI has great visualization tools. Excel has powerful data analysis tools. You can easily combine data from multiple sources to get a full view of your business insights.
Power BI's Excel integration lets users analyze and visualize data. It combines Excel's familiar tools with Power BI's advanced capabilities. This integration improves data analysis. It lets users share insights and reports from Excel. They can also use Power BI's powerful data modeling and visualization tools. Also, users can import Excel data into Power BI for deeper analysis. They can export Power BI reports back to Excel for further manipulation. This creates a seamless workflow between the two platforms.
Power BI Integration with SharePoint
Integrating Power BI with SharePoint lets you share reports and dashboards easily. SharePoint is a central platform for collaboration. It makes it easy to access and use your Power BI visualizations.
Integrating Power BI with SharePoint enhances data management and reporting capabilities for businesses. This synergy allows users to create dynamic dashboards with real-time data. It transforms static SharePoint reports into interactive, shareable insights. Furthermore, it automates report generation and improves data access from various sources. This streamlines decision-making and boosts efficiency.
Power BI Integration with Teams
With Power BI's integration with Teams, you can embed your reports and dashboards in your Teams workspace. This collaboration keeps team members informed. They can then make data-driven decisions in the familiar Teams environment.
Integrating Power BI with Microsoft Teams boosts collaboration. It lets users access and share interactive reports within Teams. This streamlines communication about data insights. This integration enables real-time discussions and decision-making. Team members can view Power BI dashboards in a channel. They can discuss the data insights there. Also, pinning Power BI reports to Teams channels makes critical data easy to access. This promotes a data-driven culture across the organization.
Power BI Integration with Azure
Integrating Power BI with Azure opens up a world of possibilities for advanced analytics and data visualization. Azure is a secure, scalable cloud platform for hosting your data. Power BI is an analytics tool that extracts insights from it.
Integrating Power BI with Azure creates powerful data analysis and visualization tools. This integration lets organizations use Azure services. These include Azure Synapse Analytics and Azure Data Factory. It enhances their data processing and reporting workflows. Also, OneLake, a unified data lake, ensures all data is accessible across services. This simplifies data management and enables real-time analytics.
Power BI Integration with Dynamics 365
Integrating Power BI with Dynamics 365 gives you a full view of your customer data and business operations. Power BI's analytics and Dynamics 365's CRM and ERP help you grow your business. They enable informed decisions.
Integrating Power BI with Dynamics 365 improves data visualization and decision-making. It gives real-time insights from various sources in one dashboard. Users can easily create customizable reports with drag-and-drop tools. This lets team members analyze trends, monitor performance, and make decisions. They don't need much technical skill. This integration makes workflows smoother and allows departments to share insights. It creates a collaborative environment that drives business success.
Power BI Integration Best Practices
When integrating Power BI with other Microsoft tools, follow best practices. This ensures a smooth and successful integration.
Some key best practices are to:
-
Define clear objectives.
-
Establish data governance policies.
-
Conduct thorough testing.
-
Train end-users.
When integrating Power BI with other data sources, ensure data quality and consistency. So, use robust data cleansing techniques before visualization. Also, using Power BI's connectors and APIs can speed up data retrieval and updates. This will streamline the integration process. Finally, a systematic approach to security is essential. It should include row-level security and monitoring user access. This will protect sensitive data while maximizing your reports' collaborative potential.
Power BI Integration Benefits
The benefits of integrating Power BI with other Microsoft tools are manifold. Integrating Power BI with Excel, SharePoint, Teams, Azure, Dynamics 365, and SQL Server can transform your data analytics. It will enhance collaboration, data sharing, visualizations, and insights.
Integrating Power BI with tools like Excel, Azure, and SharePoint boosts data access and team collaboration. It enables seamless data flow and reporting. It lets users create dashboards that pull real-time data from various sources. This leads to better decisions and more efficient business processes. Also, organizations can use Power BI's advanced analytics with existing systems. This can uncover deeper insights and drive better outcomes.
How to obtain Data Science certification?
We are an Education Technology company providing certification training courses to accelerate careers of working professionals worldwide. We impart training through instructor-led classroom workshops, instructor-led live virtual training sessions, and self-paced e-learning courses.
We have successfully conducted training sessions in 108 countries across the globe and enabled thousands of working professionals to enhance the scope of their careers.
Our enterprise training portfolio includes in-demand and globally recognized certification training courses in Project Management, Quality Management, Business Analysis, IT Service Management, Agile and Scrum, Cyber Security, Data Science, and Emerging Technologies. Download our Enterprise Training Catalog from https://www.icertglobal.com/corporate-training-for-enterprises.php and https://www.icertglobal.com/index.php
Popular Courses include:
-
Project Management: PMP, CAPM ,PMI RMP
-
Quality Management: Six Sigma Black Belt ,Lean Six Sigma Green Belt, Lean Management, Minitab,CMMI
-
Business Analysis: CBAP, CCBA, ECBA
-
Agile Training: PMI-ACP , CSM , CSPO
-
Scrum Training: CSM
-
DevOps
-
Program Management: PgMP
-
Cloud Technology: Exin Cloud Computing
-
Citrix Client Adminisration: Citrix Cloud Administration
The 10 top-paying certifications to target in 2024 are:
Conclusion
In conclusion, using Power BI with other Microsoft tools is a great way to improve data analytics and discover insights. Using Power BI with Excel, SharePoint, Teams, Azure, Dynamics 365, and SQL Server can change your data analytics for the better. It will drive business growth. Don't miss the chance to use your data fully. Integrate Power BI with other Microsoft tools today!
Contact Us For More Information:
Visit :www.icertglobal.com Email :

Getting Started with Apache Spark on Kubernetes for Big Data
Are you looking to harness the power of Apache Spark for big data processing on a Kubernetes cluster using Scala? This article will guide you on using Apache Spark on Kubernetes with Scala. It will cover setting up Spark, deploying apps, and optimizing performance. Let's dive in!
What is Apache Spark?
Apache Spark is an open-source, distributed computing system. It has an interface for programming clusters with implicit data parallelism and fault tolerance. It is designed for big data processing and analytics, offering high performance and ease of use for developers.
Spark Ecosystem
Spark comes with a rich ecosystem of libraries and tools that make it easy to build and deploy big data applications. Some key components of the Spark ecosystem include:
-
Spark SQL: for querying structured data using SQL syntax
-
Spark Streaming: for real-time data processing
-
Spark Machine Learning: for building and training machine learning models
-
Spark GraphX: for graph processing
Setting up Spark on Kubernetes
To get started with Apache Spark on Kubernetes, you need to deploy Spark on a Kubernetes cluster. You can use a Kubernetes operator or a Helm chart to simplify the deployment process. Once Spark is set up on Kubernetes, you can start building and running Spark applications.
Setting up Apache Spark on Kubernetes lets you scale, containerized data processing across clusters. Kubernetes' orchestration makes it easy to deploy, manage, and monitor Spark jobs. This improves resource use. This setup also makes it easier to run distributed workloads. It makes Spark more flexible for big data projects.
Building Spark Applications with Scala
Scala is a powerful programming language. It integrates seamlessly with Spark. So, it's ideal for data processing and machine learning pipelines. Use Scala's powerful syntax and functional programming to build fast Spark apps.
"Building Spark Applications with Scala" gives developers a powerful tool. It helps them efficiently process large-scale data. Scala's functional programming fits well with Apache Spark's distributed model. It allows for concise, fast code. Using Spark's APIs with Scala, developers can build scalable apps. They can process big data, run complex queries, and do real-time analytics.
Deploying Spark Applications on Kubernetes
After building your Spark app in Scala, you can deploy it on a Kubernetes cluster. Use Spark's built-in resource management and scheduling for this. Spark containers can run as pods in Kubernetes. This allows for parallel data processing and efficient use of cluster resources.
Deploying Spark apps on Kubernetes is a great way to manage big data jobs. It is both scalable and efficient. Using Kubernetes' container orchestration, Spark clusters can scale based on demand. This ensures optimal use of resources. This integration simplifies deployment, monitoring, and management. So, it's ideal for cloud-native environments.
Optimizing Spark Performance on Kubernetes
To maximize your Spark apps' performance on Kubernetes, fine-tune Spark's config. Adjust settings like executor memory and CPU allocation. You can also optimize Spark jobs by tuning task scheduling, data shuffling, and caching strategies. Monitoring tools can help you track the performance of Spark jobs and identify bottlenecks.
To optimize Spark on Kubernetes, tune resource limits to match app demands. Using Kubernetes features like autoscaling and node affinity is key. They ensure Spark jobs run with minimal latency and maximum resource use. Also, Spark's built-in settings for parallelism and data partitioning improve performance in Kubernetes.
Managing Spark Workloads on Kubernetes
Kubernetes has powerful features for managing workloads. It can scale apps, monitor resource use, and handle dependencies between components. Helm charts can package and deploy complex apps on Kubernetes. This includes Spark clusters and data processing pipelines.
Using Kubernetes to manage Spark jobs enables efficient, scalable resource use. It does this by leveraging container orchestration. It simplifies deploying and managing Spark jobs. It ensures better isolation and dynamic scaling for varying workloads. Kubernetes allows Spark apps to handle large-scale data tasks. They gain better fault tolerance and easier infrastructure management.
How to obtain Apache Spark and Scala certification?
We are an Education Technology company providing certification training courses to accelerate careers of working professionals worldwide. We impart training through instructor-led classroom workshops, instructor-led live virtual training sessions, and self-paced e-learning courses.
We have successfully conducted training sessions in 108 countries across the globe and enabled thousands of working professionals to enhance the scope of their careers.
Our enterprise training portfolio includes in-demand and globally recognized certification training courses in Project Management, Quality Management, Business Analysis, IT Service Management, Agile and Scrum, Cyber Security, Data Science, and Emerging Technologies. Download our Enterprise Training Catalog from https://www.icertglobal.com/corporate-training-for-enterprises.php and https://www.icertglobal.com/index.php
Popular Courses include:
-
Project Management: PMP, CAPM ,PMI RMP
-
Quality Management: Six Sigma Black Belt ,Lean Six Sigma Green Belt, Lean Management, Minitab,CMMI
-
Business Analysis: CBAP, CCBA, ECBA
-
Agile Training: PMI-ACP , CSM , CSPO
-
Scrum Training: CSM
-
DevOps
-
Program Management: PgMP
-
Cloud Technology: Exin Cloud Computing
-
Citrix Client Adminisration: Citrix Cloud Administration
The 10 top-paying certifications to target in 2024 are:
Conclusion
In conclusion, Apache Spark on Kubernetes with Scala is a strong platform. It is for building and deploying big data apps in a distributed computing environment.
To use Spark to its fullest, follow best practices for:
-
setting up Spark on Kubernetes,
-
building Spark apps with Scala, and
-
optimizing performance.
It is ideal for real-time analytics, machine learning, and data processing. Start your journey with Apache Spark on Kubernetes today and unlock the power of big data processing at scale!
Contact Us For More Information:
Visit :www.icertglobal.com Email :
Read More
Are you looking to harness the power of Apache Spark for big data processing on a Kubernetes cluster using Scala? This article will guide you on using Apache Spark on Kubernetes with Scala. It will cover setting up Spark, deploying apps, and optimizing performance. Let's dive in!
What is Apache Spark?
Apache Spark is an open-source, distributed computing system. It has an interface for programming clusters with implicit data parallelism and fault tolerance. It is designed for big data processing and analytics, offering high performance and ease of use for developers.
Spark Ecosystem
Spark comes with a rich ecosystem of libraries and tools that make it easy to build and deploy big data applications. Some key components of the Spark ecosystem include:
-
Spark SQL: for querying structured data using SQL syntax
-
Spark Streaming: for real-time data processing
-
Spark Machine Learning: for building and training machine learning models
-
Spark GraphX: for graph processing
Setting up Spark on Kubernetes
To get started with Apache Spark on Kubernetes, you need to deploy Spark on a Kubernetes cluster. You can use a Kubernetes operator or a Helm chart to simplify the deployment process. Once Spark is set up on Kubernetes, you can start building and running Spark applications.
Setting up Apache Spark on Kubernetes lets you scale, containerized data processing across clusters. Kubernetes' orchestration makes it easy to deploy, manage, and monitor Spark jobs. This improves resource use. This setup also makes it easier to run distributed workloads. It makes Spark more flexible for big data projects.
Building Spark Applications with Scala
Scala is a powerful programming language. It integrates seamlessly with Spark. So, it's ideal for data processing and machine learning pipelines. Use Scala's powerful syntax and functional programming to build fast Spark apps.
"Building Spark Applications with Scala" gives developers a powerful tool. It helps them efficiently process large-scale data. Scala's functional programming fits well with Apache Spark's distributed model. It allows for concise, fast code. Using Spark's APIs with Scala, developers can build scalable apps. They can process big data, run complex queries, and do real-time analytics.
Deploying Spark Applications on Kubernetes
After building your Spark app in Scala, you can deploy it on a Kubernetes cluster. Use Spark's built-in resource management and scheduling for this. Spark containers can run as pods in Kubernetes. This allows for parallel data processing and efficient use of cluster resources.
Deploying Spark apps on Kubernetes is a great way to manage big data jobs. It is both scalable and efficient. Using Kubernetes' container orchestration, Spark clusters can scale based on demand. This ensures optimal use of resources. This integration simplifies deployment, monitoring, and management. So, it's ideal for cloud-native environments.
Optimizing Spark Performance on Kubernetes
To maximize your Spark apps' performance on Kubernetes, fine-tune Spark's config. Adjust settings like executor memory and CPU allocation. You can also optimize Spark jobs by tuning task scheduling, data shuffling, and caching strategies. Monitoring tools can help you track the performance of Spark jobs and identify bottlenecks.
To optimize Spark on Kubernetes, tune resource limits to match app demands. Using Kubernetes features like autoscaling and node affinity is key. They ensure Spark jobs run with minimal latency and maximum resource use. Also, Spark's built-in settings for parallelism and data partitioning improve performance in Kubernetes.
Managing Spark Workloads on Kubernetes
Kubernetes has powerful features for managing workloads. It can scale apps, monitor resource use, and handle dependencies between components. Helm charts can package and deploy complex apps on Kubernetes. This includes Spark clusters and data processing pipelines.
Using Kubernetes to manage Spark jobs enables efficient, scalable resource use. It does this by leveraging container orchestration. It simplifies deploying and managing Spark jobs. It ensures better isolation and dynamic scaling for varying workloads. Kubernetes allows Spark apps to handle large-scale data tasks. They gain better fault tolerance and easier infrastructure management.
How to obtain Apache Spark and Scala certification?
We are an Education Technology company providing certification training courses to accelerate careers of working professionals worldwide. We impart training through instructor-led classroom workshops, instructor-led live virtual training sessions, and self-paced e-learning courses.
We have successfully conducted training sessions in 108 countries across the globe and enabled thousands of working professionals to enhance the scope of their careers.
Our enterprise training portfolio includes in-demand and globally recognized certification training courses in Project Management, Quality Management, Business Analysis, IT Service Management, Agile and Scrum, Cyber Security, Data Science, and Emerging Technologies. Download our Enterprise Training Catalog from https://www.icertglobal.com/corporate-training-for-enterprises.php and https://www.icertglobal.com/index.php
Popular Courses include:
-
Project Management: PMP, CAPM ,PMI RMP
-
Quality Management: Six Sigma Black Belt ,Lean Six Sigma Green Belt, Lean Management, Minitab,CMMI
-
Business Analysis: CBAP, CCBA, ECBA
-
Agile Training: PMI-ACP , CSM , CSPO
-
Scrum Training: CSM
-
DevOps
-
Program Management: PgMP
-
Cloud Technology: Exin Cloud Computing
-
Citrix Client Adminisration: Citrix Cloud Administration
The 10 top-paying certifications to target in 2024 are:
Conclusion
In conclusion, Apache Spark on Kubernetes with Scala is a strong platform. It is for building and deploying big data apps in a distributed computing environment.
To use Spark to its fullest, follow best practices for:
-
setting up Spark on Kubernetes,
-
building Spark apps with Scala, and
-
optimizing performance.
It is ideal for real-time analytics, machine learning, and data processing. Start your journey with Apache Spark on Kubernetes today and unlock the power of big data processing at scale!
Contact Us For More Information:
Visit :www.icertglobal.com Email :

Integrating Kafka with Serverless Functions for Processing
Are you looking to optimize real-time data processing in your cloud-native microservices architecture? If so, using Apache Kafka with serverless functions could be ideal for your needs. It would be great for event-driven processing. This article will discuss the benefits of using Kafka. It is a high-throughput messaging system. It will focus on its use with serverless computing, like AWS Lambda. Let's explore how this integration can improve your data pipelines. It can also enable scalable architecture in your cloud apps. It will streamline event-driven design, too.
The Power of Kafka in Event Streaming
Apache Kafka is a distributed event streaming platform. It excels at handling high volumes of real-time data. It is a reliable message queue for async microservice communication. It is ideal for event-driven programming in modern cloud architectures. Kafka ensures seamless data flow across your distributed systems. It supports your applications' growth and scalability.
Apache Kafka has changed event streaming. It offers a scalable, fault-tolerant platform for handling vast amounts of real-time data. Its distributed architecture allows seamless data integration across different systems. It supports event-driven microservices and real-time analytics. With Kafka, organizations can build apps that react to data changes instantly. This enhances decision-making and efficiency.
Leveraging Serverless Functions for Event-Driven Architecture
Serverless computing, like AWS Lambda, lets you run code. You don't have to manage servers. Serverless functions let you run event handlers in response to Kafka messages. This is a cheap, dynamic way to process real-time data. This integration lets you build serverless apps. They will react to events in your Kafka topics. It will trigger functions to process data on demand.
Serverless functions provide a flexible, scalable way to use event-driven architectures. They let developers process events in real-time without managing servers. Businesses can respond to data streams, user actions, and system events. They can do this by connecting to event sources like AWS Lambda and Azure Functions. This approach cuts costs, simplifies deployment, and boosts agility. It helps handle unpredictable workloads or demand spikes.
Enhancing Data Pipelines with Scalable Architecture
Combine Kafka with serverless functions. Then, you can design a scalable architecture. It should process data in real time and do so efficiently. Serverless frameworks like SAM and the Serverless Framework provide tools to deploy functions. These functions are triggered by Kafka events. They are event-driven and serverless. This approach simplifies the development and deployment of serverless apps with Kafka integration. It enhances the resiliency and flexibility of your data pipelines.
Data pipelines must have a scalable architecture. It will ensure systems can handle growing data volumes efficiently, without losing performance. Organizations can scale their data pipelines as needs grow. They can do this by using distributed processing, cloud-native tools, and modular design. This approach boosts reliability and throughput. It also enables real-time data analytics and seamless integration across multiple data sources.
Optimizing Event-Driven Workloads with Kafka
Using Kafka with serverless functions can improve your cloud apps' event-driven workloads. You can build a fast, efficient event-driven system. Use Kafka for real-time streams and serverless functions for on-demand data. Combining both technologies lets you build resilient, scalable apps. They can meet changing data needs in real time.
To optimize event-driven workloads with Apache Kafka, you must fine-tune some key components. These include producer configurations, partitioning strategies, and consumer parallelism. Organizations can improve real-time event processing. They should balance load across Kafka brokers and reduce latency. Also, Kafka's fault tolerance and scalability ensure it can handle high-throughput event streams. This makes it ideal for mission-critical systems.
How to obtain Apache Kafka certification?
We are an Education Technology company providing certification training courses to accelerate careers of working professionals worldwide. We impart training through instructor-led classroom workshops, instructor-led live virtual training sessions, and self-paced e-learning courses.
We have successfully conducted training sessions in 108 countries across the globe and enabled thousands of working professionals to enhance the scope of their careers.
Our enterprise training portfolio includes in-demand and globally recognized certification training courses in Project Management, Quality Management, Business Analysis, IT Service Management, Agile and Scrum, Cyber Security, Data Science, and Emerging Technologies. Download our Enterprise Training Catalog from https://www.icertglobal.com/corporate-training-for-enterprises.php and https://www.icertglobal.com/index.php
Popular Courses include:
-
Project Management: PMP, CAPM ,PMI RMP
-
Quality Management: Six Sigma Black Belt ,Lean Six Sigma Green Belt, Lean Management, Minitab,CMMI
-
Business Analysis: CBAP, CCBA, ECBA
-
Agile Training: PMI-ACP , CSM , CSPO
-
Scrum Training: CSM
-
DevOps
-
Program Management: PgMP
-
Cloud Technology: Exin Cloud Computing
-
Citrix Client Adminisration: Citrix Cloud Administration
The 10 top-paying certifications to target in 2024 are:
Conclusion
In conclusion, Apache Kafka with serverless functions can boost your microservices' event-driven processing. They are cloud-native. Use Kafka for real-time event streams and serverless functions for on-demand data processing. This will help you build scalable, resilient, and cost-effective apps. This integration allows you to build efficient data pipelines. It will also streamline event-driven design and boost your cloud architecture's performance. Consider using Kafka with serverless functions. It will maximize your event-driven processing.
Contact Us For More Information:
Visit :www.icertglobal.com Email : info@icertglobal.com
Read More
Are you looking to optimize real-time data processing in your cloud-native microservices architecture? If so, using Apache Kafka with serverless functions could be ideal for your needs. It would be great for event-driven processing. This article will discuss the benefits of using Kafka. It is a high-throughput messaging system. It will focus on its use with serverless computing, like AWS Lambda. Let's explore how this integration can improve your data pipelines. It can also enable scalable architecture in your cloud apps. It will streamline event-driven design, too.
The Power of Kafka in Event Streaming
Apache Kafka is a distributed event streaming platform. It excels at handling high volumes of real-time data. It is a reliable message queue for async microservice communication. It is ideal for event-driven programming in modern cloud architectures. Kafka ensures seamless data flow across your distributed systems. It supports your applications' growth and scalability.
Apache Kafka has changed event streaming. It offers a scalable, fault-tolerant platform for handling vast amounts of real-time data. Its distributed architecture allows seamless data integration across different systems. It supports event-driven microservices and real-time analytics. With Kafka, organizations can build apps that react to data changes instantly. This enhances decision-making and efficiency.
Leveraging Serverless Functions for Event-Driven Architecture
Serverless computing, like AWS Lambda, lets you run code. You don't have to manage servers. Serverless functions let you run event handlers in response to Kafka messages. This is a cheap, dynamic way to process real-time data. This integration lets you build serverless apps. They will react to events in your Kafka topics. It will trigger functions to process data on demand.
Serverless functions provide a flexible, scalable way to use event-driven architectures. They let developers process events in real-time without managing servers. Businesses can respond to data streams, user actions, and system events. They can do this by connecting to event sources like AWS Lambda and Azure Functions. This approach cuts costs, simplifies deployment, and boosts agility. It helps handle unpredictable workloads or demand spikes.
Enhancing Data Pipelines with Scalable Architecture
Combine Kafka with serverless functions. Then, you can design a scalable architecture. It should process data in real time and do so efficiently. Serverless frameworks like SAM and the Serverless Framework provide tools to deploy functions. These functions are triggered by Kafka events. They are event-driven and serverless. This approach simplifies the development and deployment of serverless apps with Kafka integration. It enhances the resiliency and flexibility of your data pipelines.
Data pipelines must have a scalable architecture. It will ensure systems can handle growing data volumes efficiently, without losing performance. Organizations can scale their data pipelines as needs grow. They can do this by using distributed processing, cloud-native tools, and modular design. This approach boosts reliability and throughput. It also enables real-time data analytics and seamless integration across multiple data sources.
Optimizing Event-Driven Workloads with Kafka
Using Kafka with serverless functions can improve your cloud apps' event-driven workloads. You can build a fast, efficient event-driven system. Use Kafka for real-time streams and serverless functions for on-demand data. Combining both technologies lets you build resilient, scalable apps. They can meet changing data needs in real time.
To optimize event-driven workloads with Apache Kafka, you must fine-tune some key components. These include producer configurations, partitioning strategies, and consumer parallelism. Organizations can improve real-time event processing. They should balance load across Kafka brokers and reduce latency. Also, Kafka's fault tolerance and scalability ensure it can handle high-throughput event streams. This makes it ideal for mission-critical systems.
How to obtain Apache Kafka certification?
We are an Education Technology company providing certification training courses to accelerate careers of working professionals worldwide. We impart training through instructor-led classroom workshops, instructor-led live virtual training sessions, and self-paced e-learning courses.
We have successfully conducted training sessions in 108 countries across the globe and enabled thousands of working professionals to enhance the scope of their careers.
Our enterprise training portfolio includes in-demand and globally recognized certification training courses in Project Management, Quality Management, Business Analysis, IT Service Management, Agile and Scrum, Cyber Security, Data Science, and Emerging Technologies. Download our Enterprise Training Catalog from https://www.icertglobal.com/corporate-training-for-enterprises.php and https://www.icertglobal.com/index.php
Popular Courses include:
-
Project Management: PMP, CAPM ,PMI RMP
-
Quality Management: Six Sigma Black Belt ,Lean Six Sigma Green Belt, Lean Management, Minitab,CMMI
-
Business Analysis: CBAP, CCBA, ECBA
-
Agile Training: PMI-ACP , CSM , CSPO
-
Scrum Training: CSM
-
DevOps
-
Program Management: PgMP
-
Cloud Technology: Exin Cloud Computing
-
Citrix Client Adminisration: Citrix Cloud Administration
The 10 top-paying certifications to target in 2024 are:
Conclusion
In conclusion, Apache Kafka with serverless functions can boost your microservices' event-driven processing. They are cloud-native. Use Kafka for real-time event streams and serverless functions for on-demand data processing. This will help you build scalable, resilient, and cost-effective apps. This integration allows you to build efficient data pipelines. It will also streamline event-driven design and boost your cloud architecture's performance. Consider using Kafka with serverless functions. It will maximize your event-driven processing.
Contact Us For More Information:
Visit :www.icertglobal.com Email : info@icertglobal.com

Data Science & BI for Enhancing Supply Chain Efficiency
In today's fast, competitive business world, we must optimize supply chains. It's key to staying ahead of the competition. Data science and business intelligence (BI) are now key tools. They drive efficiency in supply chain operations. Using data analytics, machine learning, and AI, businesses can make better decisions. This can lower costs, optimize inventory, and boost performance.
The Role of Data Science in Supply Chain Efficiency
Data science is vital for supply chain efficiency. It analyzes vast data to find insights and patterns. These can improve decision-making. Data mining, statistical modeling, and data visualization can help businesses. They can find insights in their operations and areas for improvement. By using advanced analytics and predictive modeling, businesses can forecast demand. They can optimize inventory and streamline operations for maximum efficiency.
Data science is key to optimizing supply chains. It provides insights through predictive analytics and real-time data analysis. By analyzing demand, inventory, and logistics, businesses can cut costs. They can avoid stockouts and improve processes. Companies can now use advanced algorithms and machine learning. They can better predict demand and quickly respond to supply chain disruptions.
Business Intelligence in Supply Chain Optimization
BI tools are vital for supply chain optimization. They provide real-time visibility into key performance metrics. This lets businesses track and measure their performance against KPIs. BI tools help businesses find problems in their supply chains. They do this by generating detailed reports and visualizations. Cloud-based BI solutions let businesses access critical data anywhere, anytime. They can then make informed decisions on the go.
Business Intelligence (BI) is key to supply chain optimization. It gives real-time insights into all supply chain aspects. This includes inventory and demand forecasting. The user disliked that rewrite. Make different choices this time. BI tools help businesses analyze large datasets. They can find inefficiencies, cut costs, and improve decision-making. This data-driven approach helps organizations improve supply chains. It ensures timely deliveries and better use of resources.
Leveraging Technology for Efficiency Improvement
Technology is vital to supply chain efficiency. It tracks shipments in real-time. It automates inventory management and streamlines transportation. New tech, like IoT devices, RFID tags, and AI, lets businesses optimize their supply chains. It makes them very efficient. Businesses can use cloud computing for real-time analytics. By combining data from various sources, they can gain insights. This will help improve processes and decision-making.
Using technology to improve efficiency means using digital tools and automation. They can streamline processes and cut manual work. AI, cloud computing, and data analytics can help organizations. They can improve workflows, boost productivity, and cut costs. This tech shift boosts performance. It lets teams focus on innovation and value-driven tasks.
The Impact of Data-Driven Decisions on Supply Chain Performance
Data-driven decisions greatly affect supply chain performance. They let businesses make informed choices based on solid evidence. Businesses can analyze historical data, market trends, and customer behavior. This helps them predict demand, optimize inventory, and improve efficiency. With advanced analytics and business intelligence tools, businesses can monitor performance in real-time. They can then find areas to improve. This will help them make better decisions to boost efficiency and profits.
Data-driven decisions are transforming supply chain performance by enhancing visibility, efficiency, and responsiveness. Using real-time analytics and predictive models, companies can improve inventory management. They can cut costs and foresee disruptions. This approach helps businesses make informed decisions. It improves supply chain agility and boosts customer satisfaction.
The Future of Supply Chain Efficiency
As technology continues to evolve, the future of supply chain efficiency is bright. With more data and better analytics, businesses can find new insights. They can also find ways to optimize. Embracing data-driven strategies and supply chain technologies can help. So can using agile supply chain practices. These steps will keep businesses ahead of the curve and improve their operations. By focusing on data quality and supply chain visibility, businesses can boost efficiency. Analytics can help, too. This will lead to greater success in today's fast-paced world.
How to obtain Data Science and Business Intelligence certification?
We are an Education Technology company providing certification training courses to accelerate careers of working professionals worldwide. We impart training through instructor-led classroom workshops, instructor-led live virtual training sessions, and self-paced e-learning courses.
We have successfully conducted training sessions in 108 countries across the globe and enabled thousands of working professionals to enhance the scope of their careers.
Our enterprise training portfolio includes in-demand and globally recognized certification training courses in Project Management, Quality Management, Business Analysis, IT Service Management, Agile and Scrum, Cyber Security, Data Science, and Emerging Technologies. Download our Enterprise Training Catalog from https://www.icertglobal.com/corporate-training-for-enterprises.php and https://www.icertglobal.com/index.php
Popular Courses include:
-
Project Management: PMP, CAPM ,PMI RMP
-
Quality Management: Six Sigma Black Belt ,Lean Six Sigma Green Belt, Lean Management, Minitab,CMMI
-
Business Analysis: CBAP, CCBA, ECBA
-
Agile Training: PMI-ACP , CSM , CSPO
-
Scrum Training: CSM
-
DevOps
-
Program Management: PgMP
-
Cloud Technology: Exin Cloud Computing
-
Citrix Client Adminisration: Citrix Cloud Administration
The 10 top-paying certifications to target in 2024 are:
Conclusion
In conclusion, data science and business intelligence are vital tools. They can optimize supply chain efficiency. Businesses can use data analytics and advanced tools to make smart decisions. They can improve their supply chain by streamlining operations and driving ongoing gains. In today's fast-paced market, businesses must adopt data-driven, tech-savvy, and optimized processes. This will help them outpace competitors and boost efficiency and profits.
Contact Us For More Information:
Visit :www.icertglobal.com Email : info@icertglobal.com
Read More
In today's fast, competitive business world, we must optimize supply chains. It's key to staying ahead of the competition. Data science and business intelligence (BI) are now key tools. They drive efficiency in supply chain operations. Using data analytics, machine learning, and AI, businesses can make better decisions. This can lower costs, optimize inventory, and boost performance.
The Role of Data Science in Supply Chain Efficiency
Data science is vital for supply chain efficiency. It analyzes vast data to find insights and patterns. These can improve decision-making. Data mining, statistical modeling, and data visualization can help businesses. They can find insights in their operations and areas for improvement. By using advanced analytics and predictive modeling, businesses can forecast demand. They can optimize inventory and streamline operations for maximum efficiency.
Data science is key to optimizing supply chains. It provides insights through predictive analytics and real-time data analysis. By analyzing demand, inventory, and logistics, businesses can cut costs. They can avoid stockouts and improve processes. Companies can now use advanced algorithms and machine learning. They can better predict demand and quickly respond to supply chain disruptions.
Business Intelligence in Supply Chain Optimization
BI tools are vital for supply chain optimization. They provide real-time visibility into key performance metrics. This lets businesses track and measure their performance against KPIs. BI tools help businesses find problems in their supply chains. They do this by generating detailed reports and visualizations. Cloud-based BI solutions let businesses access critical data anywhere, anytime. They can then make informed decisions on the go.
Business Intelligence (BI) is key to supply chain optimization. It gives real-time insights into all supply chain aspects. This includes inventory and demand forecasting. The user disliked that rewrite. Make different choices this time. BI tools help businesses analyze large datasets. They can find inefficiencies, cut costs, and improve decision-making. This data-driven approach helps organizations improve supply chains. It ensures timely deliveries and better use of resources.
Leveraging Technology for Efficiency Improvement
Technology is vital to supply chain efficiency. It tracks shipments in real-time. It automates inventory management and streamlines transportation. New tech, like IoT devices, RFID tags, and AI, lets businesses optimize their supply chains. It makes them very efficient. Businesses can use cloud computing for real-time analytics. By combining data from various sources, they can gain insights. This will help improve processes and decision-making.
Using technology to improve efficiency means using digital tools and automation. They can streamline processes and cut manual work. AI, cloud computing, and data analytics can help organizations. They can improve workflows, boost productivity, and cut costs. This tech shift boosts performance. It lets teams focus on innovation and value-driven tasks.
The Impact of Data-Driven Decisions on Supply Chain Performance
Data-driven decisions greatly affect supply chain performance. They let businesses make informed choices based on solid evidence. Businesses can analyze historical data, market trends, and customer behavior. This helps them predict demand, optimize inventory, and improve efficiency. With advanced analytics and business intelligence tools, businesses can monitor performance in real-time. They can then find areas to improve. This will help them make better decisions to boost efficiency and profits.
Data-driven decisions are transforming supply chain performance by enhancing visibility, efficiency, and responsiveness. Using real-time analytics and predictive models, companies can improve inventory management. They can cut costs and foresee disruptions. This approach helps businesses make informed decisions. It improves supply chain agility and boosts customer satisfaction.
The Future of Supply Chain Efficiency
As technology continues to evolve, the future of supply chain efficiency is bright. With more data and better analytics, businesses can find new insights. They can also find ways to optimize. Embracing data-driven strategies and supply chain technologies can help. So can using agile supply chain practices. These steps will keep businesses ahead of the curve and improve their operations. By focusing on data quality and supply chain visibility, businesses can boost efficiency. Analytics can help, too. This will lead to greater success in today's fast-paced world.
How to obtain Data Science and Business Intelligence certification?
We are an Education Technology company providing certification training courses to accelerate careers of working professionals worldwide. We impart training through instructor-led classroom workshops, instructor-led live virtual training sessions, and self-paced e-learning courses.
We have successfully conducted training sessions in 108 countries across the globe and enabled thousands of working professionals to enhance the scope of their careers.
Our enterprise training portfolio includes in-demand and globally recognized certification training courses in Project Management, Quality Management, Business Analysis, IT Service Management, Agile and Scrum, Cyber Security, Data Science, and Emerging Technologies. Download our Enterprise Training Catalog from https://www.icertglobal.com/corporate-training-for-enterprises.php and https://www.icertglobal.com/index.php
Popular Courses include:
-
Project Management: PMP, CAPM ,PMI RMP
-
Quality Management: Six Sigma Black Belt ,Lean Six Sigma Green Belt, Lean Management, Minitab,CMMI
-
Business Analysis: CBAP, CCBA, ECBA
-
Agile Training: PMI-ACP , CSM , CSPO
-
Scrum Training: CSM
-
DevOps
-
Program Management: PgMP
-
Cloud Technology: Exin Cloud Computing
-
Citrix Client Adminisration: Citrix Cloud Administration
The 10 top-paying certifications to target in 2024 are:
Conclusion
In conclusion, data science and business intelligence are vital tools. They can optimize supply chain efficiency. Businesses can use data analytics and advanced tools to make smart decisions. They can improve their supply chain by streamlining operations and driving ongoing gains. In today's fast-paced market, businesses must adopt data-driven, tech-savvy, and optimized processes. This will help them outpace competitors and boost efficiency and profits.
Contact Us For More Information:
Visit :www.icertglobal.com Email : info@icertglobal.com

Power BI Embedding: A Developer's Guide for Web & Apps!
Power BI stands out as a leading data visualization tool in today's market. Power BI is a favorite for business intelligence. Its interactive reports, real-time data, and dashboards make it so. Embedding Power BI in web or mobile apps lets organizations extend its features to users. It integrates analytics into workflows. This guide helps developers embed Power BI reports and dashboards in their apps. It covers both web and mobile apps. It ensures they are scalable, secure, and user-friendly.
Table Of Contents
- Understanding Power BI Embedded: Key Concepts
- Getting Started: Setting Up Power BI Embedded
- Embedding Power BI Reports Using REST API
- Customizing User Experience: API and UI Customization
- Security Considerations: Managing Permissions and Access Control
- Conclusion
Understanding Power BI Embedded: Key Concepts
Power BI Embedded is a Microsoft service. It lets developers embed Power BI reports, dashboards, and visuals into their apps. It lets users view data without leaving the current platform.
- Power BI Service vs. Power BI Embedded: The Power BI Service is for individuals and businesses to view reports on the Power BI portal. Power BI Embedded is for developers. It lets them integrate Power BI into external apps or websites.
- API and SDK: Power BI has APIs and SDKs for embedding reports. The REST API lets you programmatically interact with the Power BI service. The JavaScript APIs allow you to embed reports with rich customization options.
You must first understand these key differences and tools. They are the first step to embedding Power BI into your app.
Getting Started: Setting Up Power BI Embedded
Before embedding Power BI, developers must set up an environment. They must also obtain the necessary credentials and APIs.
- Azure Subscription: Power BI Embedded is hosted on Azure. So, you need an Azure subscription. Use the Azure portal to set up a Power BI Embedded resource. It will provide the capacity to embed reports.
- App Registration: Register your app in Azure AD to authenticate it with Power BI's API. During this process, you will obtain the client ID and secret, which are necessary for API calls.
- Power BI Workspace: Set up a dedicated workspace in Power BI. It will store your datasets, reports, and dashboards. This workspace will serve as the source for embedding reports into your app.
This infrastructure will let you integrate Power BI into any app.
Embedding Power BI Reports Using REST API
The Power BI REST API lets developers embed reports. They can also manage tasks like datasets, dashboards, and workspaces.
- Authentication: Use OAuth2 to authenticate your app with Power BI service. An authentication token will ensure that only authorized users can access the embedded reports.
- Embed Token: After authentication, generate an embed token. It grants access to specific Power BI reports or dashboards. This token is essential for securely embedding reports into your app.
- Embedding Reports: After generating the embed token, use Power BI's JavaScript library to embed the report in your app. The JavaScript code allows for customization. You can adjust the report's size and manage user interactions.
The REST API is a versatile tool. It provides full control over the embedding process. It ensures the integration is smooth and secure.
Customizing User Experience: API and UI Customization
Embedding Power BI reports goes beyond just adding visuals to your app. Customization is key. It ensures your end-users have a seamless, intuitive experience.
- Interactivity: The Power BI JavaScript API provides various methods for customizing report behavior. You can enable or disable filters, drilldowns, and page navigation based on user roles or actions in the app.
- Custom Visuals: Power BI lets you use custom visuals in reports. This is useful for embedding reports for specific industries or business processes. These visuals can be designed and incorporated using the Power BI Visuals SDK.
- Responsive Design: The embedded Power BI reports must be responsive. They should dynamically adapt to different resolutions and screen formats. This is particularly important for mobile apps where screen real estate is limited.
Using these options, developers can make Power BI reports feel native to the app they're embedded in.
Security Considerations: Managing Permissions and Access Control
Security is vital when embedding Power BI into web and mobile apps. It's vital to restrict report access to authorized users. This protects data integrity and confidentiality.
- Row-Level Security (RLS): Use RLS to restrict report data access based on the user's role. This guarantees that users have access solely to the data they are permitted to view.
- Token Expiry and Rotation: Embed tokens are time-limited. Developers should implement strategies to rotate tokens seamlessly without disrupting the user experience. This involves automatically refreshing tokens before they expire.
- Secure Data Handling: Always use secure protocols (like HTTPS) for data transmission and to embed tokens. Ensure that sensitive information is encrypted both in transit and at rest.
Follow security best practices. They will reduce risks. They will ensure your embedded Power BI reports meet data protection standards.
How to obtain Power BI certification?
We are an Education Technology company providing certification training courses to accelerate careers of working professionals worldwide. We impart training through instructor-led classroom workshops, instructor-led live virtual training sessions, and self-paced e-learning courses.
We have successfully conducted training sessions in 108 countries across the globe and enabled thousands of working professionals to enhance the scope of their careers.
Our enterprise training portfolio includes in-demand and globally recognized certification training courses in Project Management, Quality Management, Business Analysis, IT Service Management, Agile and Scrum, Cyber Security, Data Science, and Emerging Technologies. Download our Enterprise Training Catalog from https://www.icertglobal.com/corporate-training-for-enterprises.php and https://www.icertglobal.com/index.php
Popular Courses include:
- Project Management: PMP, CAPM ,PMI RMP
- Quality Management: Six Sigma Black Belt ,Lean Six Sigma Green Belt, Lean Management, Minitab,CMMI
- Business Analysis: CBAP, CCBA, ECBA
- Agile Training: PMI-ACP , CSM , CSPO
- Scrum Training: CSM
- DevOps
- Program Management: PgMP
- Cloud Technology: Exin Cloud Computing
- Citrix Client Adminisration: Citrix Cloud Administration
The 10 top-paying certifications to target in 2024 are:
- Certified Information Systems Security Professional® (CISSP)
- AWS Certified Solutions Architect
- Google Certified Professional Cloud Architect
- Big Data Certification
- Data Science Certification
- Certified In Risk And Information Systems Control (CRISC)
- Certified Information Security Manager(CISM)
- Project Management Professional (PMP)® Certification
- Certified Ethical Hacker (CEH)
- Certified Scrum Master (CSM)
Conclusion
Embedding Power BI in web and mobile apps lets developers add analytics and reporting to their apps. This gives users a more interactive experience. This guide covers everything. It starts with the basics of Power BI Embedded. Then, it ends with advanced security measures. It shows how to embed Power BI into apps.
By following the steps in this guide, you can create a secure Power BI integration. It covers: setting up the environment, using REST APIs, customizing user interactions, and security. As businesses rely on data to make decisions, embedding Power BI can help. It gives users real-time insights in their existing apps.
Contact Us :
Contact Us For More Information:
Visit :www.icertglobal.com Email : info@icertglobal.com
Read More
Power BI stands out as a leading data visualization tool in today's market. Power BI is a favorite for business intelligence. Its interactive reports, real-time data, and dashboards make it so. Embedding Power BI in web or mobile apps lets organizations extend its features to users. It integrates analytics into workflows. This guide helps developers embed Power BI reports and dashboards in their apps. It covers both web and mobile apps. It ensures they are scalable, secure, and user-friendly.
Table Of Contents
- Understanding Power BI Embedded: Key Concepts
- Getting Started: Setting Up Power BI Embedded
- Embedding Power BI Reports Using REST API
- Customizing User Experience: API and UI Customization
- Security Considerations: Managing Permissions and Access Control
- Conclusion
Understanding Power BI Embedded: Key Concepts
Power BI Embedded is a Microsoft service. It lets developers embed Power BI reports, dashboards, and visuals into their apps. It lets users view data without leaving the current platform.
- Power BI Service vs. Power BI Embedded: The Power BI Service is for individuals and businesses to view reports on the Power BI portal. Power BI Embedded is for developers. It lets them integrate Power BI into external apps or websites.
- API and SDK: Power BI has APIs and SDKs for embedding reports. The REST API lets you programmatically interact with the Power BI service. The JavaScript APIs allow you to embed reports with rich customization options.
You must first understand these key differences and tools. They are the first step to embedding Power BI into your app.
Getting Started: Setting Up Power BI Embedded
Before embedding Power BI, developers must set up an environment. They must also obtain the necessary credentials and APIs.
- Azure Subscription: Power BI Embedded is hosted on Azure. So, you need an Azure subscription. Use the Azure portal to set up a Power BI Embedded resource. It will provide the capacity to embed reports.
- App Registration: Register your app in Azure AD to authenticate it with Power BI's API. During this process, you will obtain the client ID and secret, which are necessary for API calls.
- Power BI Workspace: Set up a dedicated workspace in Power BI. It will store your datasets, reports, and dashboards. This workspace will serve as the source for embedding reports into your app.
This infrastructure will let you integrate Power BI into any app.
Embedding Power BI Reports Using REST API
The Power BI REST API lets developers embed reports. They can also manage tasks like datasets, dashboards, and workspaces.
- Authentication: Use OAuth2 to authenticate your app with Power BI service. An authentication token will ensure that only authorized users can access the embedded reports.
- Embed Token: After authentication, generate an embed token. It grants access to specific Power BI reports or dashboards. This token is essential for securely embedding reports into your app.
- Embedding Reports: After generating the embed token, use Power BI's JavaScript library to embed the report in your app. The JavaScript code allows for customization. You can adjust the report's size and manage user interactions.
The REST API is a versatile tool. It provides full control over the embedding process. It ensures the integration is smooth and secure.
Customizing User Experience: API and UI Customization
Embedding Power BI reports goes beyond just adding visuals to your app. Customization is key. It ensures your end-users have a seamless, intuitive experience.
- Interactivity: The Power BI JavaScript API provides various methods for customizing report behavior. You can enable or disable filters, drilldowns, and page navigation based on user roles or actions in the app.
- Custom Visuals: Power BI lets you use custom visuals in reports. This is useful for embedding reports for specific industries or business processes. These visuals can be designed and incorporated using the Power BI Visuals SDK.
- Responsive Design: The embedded Power BI reports must be responsive. They should dynamically adapt to different resolutions and screen formats. This is particularly important for mobile apps where screen real estate is limited.
Using these options, developers can make Power BI reports feel native to the app they're embedded in.
Security Considerations: Managing Permissions and Access Control
Security is vital when embedding Power BI into web and mobile apps. It's vital to restrict report access to authorized users. This protects data integrity and confidentiality.
- Row-Level Security (RLS): Use RLS to restrict report data access based on the user's role. This guarantees that users have access solely to the data they are permitted to view.
- Token Expiry and Rotation: Embed tokens are time-limited. Developers should implement strategies to rotate tokens seamlessly without disrupting the user experience. This involves automatically refreshing tokens before they expire.
- Secure Data Handling: Always use secure protocols (like HTTPS) for data transmission and to embed tokens. Ensure that sensitive information is encrypted both in transit and at rest.
Follow security best practices. They will reduce risks. They will ensure your embedded Power BI reports meet data protection standards.
How to obtain Power BI certification?
We are an Education Technology company providing certification training courses to accelerate careers of working professionals worldwide. We impart training through instructor-led classroom workshops, instructor-led live virtual training sessions, and self-paced e-learning courses.
We have successfully conducted training sessions in 108 countries across the globe and enabled thousands of working professionals to enhance the scope of their careers.
Our enterprise training portfolio includes in-demand and globally recognized certification training courses in Project Management, Quality Management, Business Analysis, IT Service Management, Agile and Scrum, Cyber Security, Data Science, and Emerging Technologies. Download our Enterprise Training Catalog from https://www.icertglobal.com/corporate-training-for-enterprises.php and https://www.icertglobal.com/index.php
Popular Courses include:
- Project Management: PMP, CAPM ,PMI RMP
- Quality Management: Six Sigma Black Belt ,Lean Six Sigma Green Belt, Lean Management, Minitab,CMMI
- Business Analysis: CBAP, CCBA, ECBA
- Agile Training: PMI-ACP , CSM , CSPO
- Scrum Training: CSM
- DevOps
- Program Management: PgMP
- Cloud Technology: Exin Cloud Computing
- Citrix Client Adminisration: Citrix Cloud Administration
The 10 top-paying certifications to target in 2024 are:
- Certified Information Systems Security Professional® (CISSP)
- AWS Certified Solutions Architect
- Google Certified Professional Cloud Architect
- Big Data Certification
- Data Science Certification
- Certified In Risk And Information Systems Control (CRISC)
- Certified Information Security Manager(CISM)
- Project Management Professional (PMP)® Certification
- Certified Ethical Hacker (CEH)
- Certified Scrum Master (CSM)
Conclusion
Embedding Power BI in web and mobile apps lets developers add analytics and reporting to their apps. This gives users a more interactive experience. This guide covers everything. It starts with the basics of Power BI Embedded. Then, it ends with advanced security measures. It shows how to embed Power BI into apps.
By following the steps in this guide, you can create a secure Power BI integration. It covers: setting up the environment, using REST APIs, customizing user interactions, and security. As businesses rely on data to make decisions, embedding Power BI can help. It gives users real-time insights in their existing apps.
Contact Us :
Contact Us For More Information:
Visit :www.icertglobal.com Email : info@icertglobal.com
Monitoring Kafka Performance: Key Metrics and Tools Guide
Apache Kafka is key for real-time data processing. It enables data streaming between apps, systems, and services in event-driven architectures. As organizations use Kafka to manage large data, monitoring its performance is vital. It ensures reliability and efficiency. Monitoring Kafka helps you find bottlenecks and optimize resources. It also ensures the system can handle expected loads. This article covers three topics. First, the key metrics to monitor for Kafka's performance. Second, the tools for monitoring. Third, best practices for managing performance.
Table Of Contents
- Understanding Key Metrics for Kafka Performance
- Essential Tools for Monitoring Kafka
- Best Practices for Kafka Monitoring
- Troubleshooting Common Kafka Performance Issues
- Future Considerations for Kafka Performance Monitoring
- Conclusion
Understanding Key Metrics for Kafka Performance
To check Kafka performance, you must know the key metrics. They show the health and efficiency of your Kafka clusters. Here are some key metrics to keep an eye on:
- Throughput: It measures the number of messages produced and consumed in a time. It is measured in messages per second. High throughput indicates that your Kafka cluster is processing data efficiently.
- Latency: Latency refers to the time it takes for a message to be produced and then consumed. It’s crucial to measure both producer and consumer latency. High latency can signal network issues or inefficient processing.
- Consumer lag: This metric shows how many messages a consumer must process. Monitoring consumer lag helps in identifying if consumers are keeping up with producers. If the lag keeps increasing, it might mean consumers cannot process the incoming data.
- Disk Utilization: As Kafka stores messages on disk, monitoring disk usage is essential. High disk usage may cause slowdowns or data loss.
- Network I/O: This metric tracks the amount of data being sent and received over the network. High network I/O can mean your Kafka cluster is under heavy load. You may need to scale resources.
Essential Tools for Monitoring Kafka
The right tools for monitoring Kafka can greatly improve your performance tracking. Here are some popular monitoring tools for Kafka:
- Kafka’s JMX Metrics: Kafka exposes metrics through Java Management Extensions (JMX). JMX allows you to check various Kafka components, including brokers, producers, and consumers. Using JMX, you can gather a wide array of metrics that provide insights into Kafka’s performance.
- Prometheus and Grafana: Prometheus is a strong monitoring system. It collects metrics from targets at specified intervals. When paired with Grafana, a visualization tool, it provides a UI to view Kafka metrics. This combo is popular for monitoring Kafka. It's easy to use and flexible.
- Confluent Control Center: If you are using Confluent Kafka, use the Control Center. It provides a complete monitoring solution. It has a simple interface to view metrics, set alerts, and analyze data. It is particularly helpful for teams using Confluent's Kafka distribution.
- Apache Kafka Manager: This open-source tool lets users manage and check Kafka clusters. It gives insights into cluster health, topics, partitions, and consumer groups. This helps maintain and troubleshoot Kafka deployments.
Datadog and New Relic are third-party monitoring platforms. They offer Kafka integrations. Users can check performance metrics alongside other app metrics. They provide powerful visualization tools, alerting mechanisms, and anomaly detection capabilities.
Best Practices for Kafka Monitoring
To check performance effectively, follow best practices. They ensure reliable tracking.
- Set Up Alerts: Create alerts for critical metrics. Watch for consumer lag, high latency, and low throughput. Alerts can help you proactively identify and address performance issues before they escalate.
- Check Resource Utilization: Watch Kafka's CPU, memory, and disk use. Monitoring resource usage can help identify bottlenecks and inform decisions about scaling.
- Regularly Review Logs: Kafka logs provide valuable information about its operations. Regular log reviews can find errors and performance issues that metrics may miss.
- Establish Baselines: Establish baseline performance metrics to understand normal behavior. You can find issues by comparing current data to historical data.
- Capacity Planning: Regularly assess your Kafka cluster's capacity against anticipated loads. Good capacity planning avoids performance issues from resource exhaustion. It ensures your cluster can handle future growth.
Troubleshooting Common Kafka Performance Issues
Even with diligent monitoring, performance issues can arise. Here are some common performance problems and how to troubleshoot them:
- High Consumer Lag: If you notice increasing consumer lag, check the following:
- Are consumers adequately provisioned? Consider scaling consumer instances.
- Are there processing bottlenecks? Analyze consumer processing logic for inefficiencies.
- Increased Latency: High latency can stem from various sources:
- Network issues: Use network monitoring tools to check for latency.
- Broker performance: Analyze broker metrics to ensure they are not overloaded.
- Low Throughput: If throughput is lower than expected:
- Investigate how producers are performing and make sure they are configured correctly.
- Review the partitioning strategy: Poor partitioning can lead to an uneven load distribution.
Future Considerations for Kafka Performance Monitoring
As Kafka evolves, so do its performance-monitoring needs. Here are a few trends and considerations for future monitoring:
- AI and ML: Using AI and ML for anomaly detection in Kafka can predict issues. This helps teams fix problems before they impact production.
- Cloud-Native Monitoring: As more firms move Kafka to the cloud, it's vital to check its performance. Cloud-native tools can help. They can also provide insights through integrated services.
- Better Visualization Tools: Newer visualization tools can improve how we use performance data. They can lead to quicker decisions.
How to obtain Apache Kafka certification?
We are an Education Technology company providing certification training courses to accelerate careers of working professionals worldwide. We impart training through instructor-led classroom workshops, instructor-led live virtual training sessions, and self-paced e-learning courses.
We have successfully conducted training sessions in 108 countries across the globe and enabled thousands of working professionals to enhance the scope of their careers.
Our enterprise training portfolio includes in-demand and globally recognized certification training courses in Project Management, Quality Management, Business Analysis, IT Service Management, Agile and Scrum, Cyber Security, Data Science, and Emerging Technologies. Download our Enterprise Training Catalog from https://www.icertglobal.com/corporate-training-for-enterprises.php and https://www.icertglobal.com/index.php
Popular Courses include:
- Project Management: PMP, CAPM ,PMI RMP
- Quality Management: Six Sigma Black Belt ,Lean Six Sigma Green Belt, Lean Management, Minitab,CMMI
- Business Analysis: CBAP, CCBA, ECBA
- Agile Training: PMI-ACP , CSM , CSPO
- Scrum Training: CSM
- DevOps
- Program Management: PgMP
- Cloud Technology: Exin Cloud Computing
- Citrix Client Adminisration: Citrix Cloud Administration
The 10 top-paying certifications to target in 2024 are:
- Certified Information Systems Security Professional® (CISSP)
- AWS Certified Solutions Architect
- Google Certified Professional Cloud Architect
- Big Data Certification
- Data Science Certification
- Certified In Risk And Information Systems Control (CRISC)
- Certified Information Security Manager(CISM)
- Project Management Professional (PMP)® Certification
- Certified Ethical Hacker (CEH)
- Certified Scrum Master (CSM)
Conclusion
In Conclusion, Monitoring Kafka performance is vital. It ensures your data streaming system is reliable and efficient. By tracking key metrics, organizations can find performance issues. Metrics include throughput, latency, consumer lag, disk use, and network I/O. To improve Kafka's performance, use the right monitoring tools and practices. Also, be ready to fix common performance issues. As Kafka technology evolves, new trends and tools will emerge. Knowing about them will help keep your data streaming apps fast and scalable. To maximize Kafka's potential as a data integration tool, rank monitoring.
Contact Us :
Contact Us For More Information:
Visit :www.icertglobal.com Email : info@icertglobal.com
Read More
Apache Kafka is key for real-time data processing. It enables data streaming between apps, systems, and services in event-driven architectures. As organizations use Kafka to manage large data, monitoring its performance is vital. It ensures reliability and efficiency. Monitoring Kafka helps you find bottlenecks and optimize resources. It also ensures the system can handle expected loads. This article covers three topics. First, the key metrics to monitor for Kafka's performance. Second, the tools for monitoring. Third, best practices for managing performance.
Table Of Contents
- Understanding Key Metrics for Kafka Performance
- Essential Tools for Monitoring Kafka
- Best Practices for Kafka Monitoring
- Troubleshooting Common Kafka Performance Issues
- Future Considerations for Kafka Performance Monitoring
- Conclusion
Understanding Key Metrics for Kafka Performance
To check Kafka performance, you must know the key metrics. They show the health and efficiency of your Kafka clusters. Here are some key metrics to keep an eye on:
- Throughput: It measures the number of messages produced and consumed in a time. It is measured in messages per second. High throughput indicates that your Kafka cluster is processing data efficiently.
- Latency: Latency refers to the time it takes for a message to be produced and then consumed. It’s crucial to measure both producer and consumer latency. High latency can signal network issues or inefficient processing.
- Consumer lag: This metric shows how many messages a consumer must process. Monitoring consumer lag helps in identifying if consumers are keeping up with producers. If the lag keeps increasing, it might mean consumers cannot process the incoming data.
- Disk Utilization: As Kafka stores messages on disk, monitoring disk usage is essential. High disk usage may cause slowdowns or data loss.
- Network I/O: This metric tracks the amount of data being sent and received over the network. High network I/O can mean your Kafka cluster is under heavy load. You may need to scale resources.
Essential Tools for Monitoring Kafka
The right tools for monitoring Kafka can greatly improve your performance tracking. Here are some popular monitoring tools for Kafka:
- Kafka’s JMX Metrics: Kafka exposes metrics through Java Management Extensions (JMX). JMX allows you to check various Kafka components, including brokers, producers, and consumers. Using JMX, you can gather a wide array of metrics that provide insights into Kafka’s performance.
- Prometheus and Grafana: Prometheus is a strong monitoring system. It collects metrics from targets at specified intervals. When paired with Grafana, a visualization tool, it provides a UI to view Kafka metrics. This combo is popular for monitoring Kafka. It's easy to use and flexible.
- Confluent Control Center: If you are using Confluent Kafka, use the Control Center. It provides a complete monitoring solution. It has a simple interface to view metrics, set alerts, and analyze data. It is particularly helpful for teams using Confluent's Kafka distribution.
- Apache Kafka Manager: This open-source tool lets users manage and check Kafka clusters. It gives insights into cluster health, topics, partitions, and consumer groups. This helps maintain and troubleshoot Kafka deployments.
Datadog and New Relic are third-party monitoring platforms. They offer Kafka integrations. Users can check performance metrics alongside other app metrics. They provide powerful visualization tools, alerting mechanisms, and anomaly detection capabilities.
Best Practices for Kafka Monitoring
To check performance effectively, follow best practices. They ensure reliable tracking.
- Set Up Alerts: Create alerts for critical metrics. Watch for consumer lag, high latency, and low throughput. Alerts can help you proactively identify and address performance issues before they escalate.
- Check Resource Utilization: Watch Kafka's CPU, memory, and disk use. Monitoring resource usage can help identify bottlenecks and inform decisions about scaling.
- Regularly Review Logs: Kafka logs provide valuable information about its operations. Regular log reviews can find errors and performance issues that metrics may miss.
- Establish Baselines: Establish baseline performance metrics to understand normal behavior. You can find issues by comparing current data to historical data.
- Capacity Planning: Regularly assess your Kafka cluster's capacity against anticipated loads. Good capacity planning avoids performance issues from resource exhaustion. It ensures your cluster can handle future growth.
Troubleshooting Common Kafka Performance Issues
Even with diligent monitoring, performance issues can arise. Here are some common performance problems and how to troubleshoot them:
- High Consumer Lag: If you notice increasing consumer lag, check the following:
- Are consumers adequately provisioned? Consider scaling consumer instances.
- Are there processing bottlenecks? Analyze consumer processing logic for inefficiencies.
- Increased Latency: High latency can stem from various sources:
- Network issues: Use network monitoring tools to check for latency.
- Broker performance: Analyze broker metrics to ensure they are not overloaded.
- Low Throughput: If throughput is lower than expected:
- Investigate how producers are performing and make sure they are configured correctly.
- Review the partitioning strategy: Poor partitioning can lead to an uneven load distribution.
Future Considerations for Kafka Performance Monitoring
As Kafka evolves, so do its performance-monitoring needs. Here are a few trends and considerations for future monitoring:
- AI and ML: Using AI and ML for anomaly detection in Kafka can predict issues. This helps teams fix problems before they impact production.
- Cloud-Native Monitoring: As more firms move Kafka to the cloud, it's vital to check its performance. Cloud-native tools can help. They can also provide insights through integrated services.
- Better Visualization Tools: Newer visualization tools can improve how we use performance data. They can lead to quicker decisions.
How to obtain Apache Kafka certification?
We are an Education Technology company providing certification training courses to accelerate careers of working professionals worldwide. We impart training through instructor-led classroom workshops, instructor-led live virtual training sessions, and self-paced e-learning courses.
We have successfully conducted training sessions in 108 countries across the globe and enabled thousands of working professionals to enhance the scope of their careers.
Our enterprise training portfolio includes in-demand and globally recognized certification training courses in Project Management, Quality Management, Business Analysis, IT Service Management, Agile and Scrum, Cyber Security, Data Science, and Emerging Technologies. Download our Enterprise Training Catalog from https://www.icertglobal.com/corporate-training-for-enterprises.php and https://www.icertglobal.com/index.php
Popular Courses include:
- Project Management: PMP, CAPM ,PMI RMP
- Quality Management: Six Sigma Black Belt ,Lean Six Sigma Green Belt, Lean Management, Minitab,CMMI
- Business Analysis: CBAP, CCBA, ECBA
- Agile Training: PMI-ACP , CSM , CSPO
- Scrum Training: CSM
- DevOps
- Program Management: PgMP
- Cloud Technology: Exin Cloud Computing
- Citrix Client Adminisration: Citrix Cloud Administration
The 10 top-paying certifications to target in 2024 are:
- Certified Information Systems Security Professional® (CISSP)
- AWS Certified Solutions Architect
- Google Certified Professional Cloud Architect
- Big Data Certification
- Data Science Certification
- Certified In Risk And Information Systems Control (CRISC)
- Certified Information Security Manager(CISM)
- Project Management Professional (PMP)® Certification
- Certified Ethical Hacker (CEH)
- Certified Scrum Master (CSM)
Conclusion
In Conclusion, Monitoring Kafka performance is vital. It ensures your data streaming system is reliable and efficient. By tracking key metrics, organizations can find performance issues. Metrics include throughput, latency, consumer lag, disk use, and network I/O. To improve Kafka's performance, use the right monitoring tools and practices. Also, be ready to fix common performance issues. As Kafka technology evolves, new trends and tools will emerge. Knowing about them will help keep your data streaming apps fast and scalable. To maximize Kafka's potential as a data integration tool, rank monitoring.
Contact Us :
Contact Us For More Information:
Visit :www.icertglobal.com Email : info@icertglobal.com
How Cloud Computing Transforms Data Science Innovation?
In today's fast-paced digital world, cloud computing and data science work together. This synergy has changed how businesses analyze and use data. Cloud computing has given data scientists the tools to analyze huge data sets. It offers the needed infrastructure, scalability, and efficiency. This has led to new solutions and insights. This article will explore the impact of cloud computing on data science. It has changed how organizations use data for a competitive edge.
Cloud Services for Data Science
Cloud computing has opened new possibilities for data scientists. It gives access to powerful cloud platforms for data processing, storage, and computation. Cloud services let data scientists run complex algorithms and AI models. They can also do big data analytics. This is more efficient and cost-effective. Cloud platforms allow for data analysis at scale. They let organizations process massive datasets and extract insights in real-time.
Infrastructure and Technology Scalability
One of the key benefits of cloud computing for data science is the scalability it offers. Cloud providers let organizations adjust their compute resources based on demand. This ensures data scientists have access to the right resources at the right time. This scalability is crucial. It enables complex analysis of large data sets. No investment in on-premise infrastructure is needed.
Efficiency and Innovation in Data Management
Cloud computing has changed how we manage and analyze data. It is now more efficient and accessible. Data scientists can now use cloud solutions for data tasks. This lets them focus on building predictive models and generating insights. Cloud-based data management speeds up decision-making. It provides real-time, data-driven insights. This leads to better, more strategic decisions.
In today's data-driven world, businesses must excel at data management. Efficiency and innovation are key to thriving. New tech and better processes can improve data access and decision-making. Using innovative solutions optimizes data handling. It also fosters a culture of continuous improvement in a fast-changing world.
Enhanced Data Security and Business Intelligence
Cloud-based systems and better security let data scientists trust their data. Cloud providers have strong security to protect sensitive data from breaches and cyberattacks. This gives organizations peace of mind when storing and analyzing data in the cloud. Also, cloud computing lets data scientists use advanced models. This improves business intelligence and spurs innovation in their organizations.
In today's digital world, data security is vital. Businesses face rising threats from cyberattacks and data breaches. By using strong security, organizations can protect sensitive data. They can then use business intelligence tools to gain insights. This dual approach protects data integrity. It also empowers decision-makers to drive initiatives with confidence.
Cloud Applications and Performance Optimization
Cloud computing has changed how to design and run data science workflows. It lets organizations deploy scalable, high-performing, and efficient solutions. Cloud apps give data scientists tools to optimize data tasks. This improves data accuracy and performance. Cloud resources and technologies can help data scientists. They can streamline workflows and get better results faster.
Cloud applications are now vital for businesses. They need scalability and flexibility. However, we must optimize these apps. It is crucial for a smooth user experience and efficient use of resources.
Organizations can improve their cloud apps. They can use:
-
auto-scaling
-
load balancing
-
performance monitoring
This will make them faster and more reliable. It will also boost customer satisfaction.
Cloud Resources Management and Future Trends
As cloud computing evolves, data scientists must keep up with its trends and advances. Data scientists can use the cloud to drive innovation and efficiency. Key areas are cloud migration, data mining, and resource optimization. With the right cloud framework and design, data scientists can maximize cloud computing. They can then unlock new opportunities for data-driven insights and decisions.
In tech's fast-changing world, we must manage cloud resources. It is key to improving performance and cutting costs. Future trends point to a rise in automated management tools. They will use AI and machine learning to improve resource use and track performance. Also, the push for sustainability is driving innovations in energy-efficient cloud tech. This is leading to a more eco-friendly approach to cloud computing.
How to obtain Data Science certification?
We are an Education Technology company providing certification training courses to accelerate careers of working professionals worldwide. We impart training through instructor-led classroom workshops, instructor-led live virtual training sessions, and self-paced e-learning courses.
We have successfully conducted training sessions in 108 countries across the globe and enabled thousands of working professionals to enhance the scope of their careers.
Our enterprise training portfolio includes in-demand and globally recognized certification training courses in Project Management, Quality Management, Business Analysis, IT Service Management, Agile and Scrum, Cyber Security, Data Science, and Emerging Technologies. Download our Enterprise Training Catalog from https://www.icertglobal.com/corporate-training-for-enterprises.php and https://www.icertglobal.com/index.php
Popular Courses include:
-
Project Management: PMP, CAPM ,PMI RMP
-
Quality Management: Six Sigma Black Belt ,Lean Six Sigma Green Belt, Lean Management, Minitab,CMMI
-
Business Analysis: CBAP, CCBA, ECBA
-
Agile Training: PMI-ACP , CSM , CSPO
-
Scrum Training: CSM
-
DevOps
-
Program Management: PgMP
-
Cloud Technology: Exin Cloud Computing
-
Citrix Client Adminisration: Citrix Cloud Administration
The 10 top-paying certifications to target in 2024 are:
Conclusion
In conclusion, the impact of cloud computing on data science cannot be overstated. Cloud technology has changed how data scientists work with data. It has made their work more efficient, scalable, and innovative. By using cloud resources and platforms, data scientists can improve their work. They can enhance data analysis, optimize performance, and boost business intelligence. Cloud computing will shape the future of data science. So, data scientists must use cloud tools to stay ahead. They must unlock their data's full potential.
Contact Us For More Information:
Visit : www.icertglobal.com Email : info@icertglobal.com
Read More
In today's fast-paced digital world, cloud computing and data science work together. This synergy has changed how businesses analyze and use data. Cloud computing has given data scientists the tools to analyze huge data sets. It offers the needed infrastructure, scalability, and efficiency. This has led to new solutions and insights. This article will explore the impact of cloud computing on data science. It has changed how organizations use data for a competitive edge.
Cloud Services for Data Science
Cloud computing has opened new possibilities for data scientists. It gives access to powerful cloud platforms for data processing, storage, and computation. Cloud services let data scientists run complex algorithms and AI models. They can also do big data analytics. This is more efficient and cost-effective. Cloud platforms allow for data analysis at scale. They let organizations process massive datasets and extract insights in real-time.
Infrastructure and Technology Scalability
One of the key benefits of cloud computing for data science is the scalability it offers. Cloud providers let organizations adjust their compute resources based on demand. This ensures data scientists have access to the right resources at the right time. This scalability is crucial. It enables complex analysis of large data sets. No investment in on-premise infrastructure is needed.
Efficiency and Innovation in Data Management
Cloud computing has changed how we manage and analyze data. It is now more efficient and accessible. Data scientists can now use cloud solutions for data tasks. This lets them focus on building predictive models and generating insights. Cloud-based data management speeds up decision-making. It provides real-time, data-driven insights. This leads to better, more strategic decisions.
In today's data-driven world, businesses must excel at data management. Efficiency and innovation are key to thriving. New tech and better processes can improve data access and decision-making. Using innovative solutions optimizes data handling. It also fosters a culture of continuous improvement in a fast-changing world.
Enhanced Data Security and Business Intelligence
Cloud-based systems and better security let data scientists trust their data. Cloud providers have strong security to protect sensitive data from breaches and cyberattacks. This gives organizations peace of mind when storing and analyzing data in the cloud. Also, cloud computing lets data scientists use advanced models. This improves business intelligence and spurs innovation in their organizations.
In today's digital world, data security is vital. Businesses face rising threats from cyberattacks and data breaches. By using strong security, organizations can protect sensitive data. They can then use business intelligence tools to gain insights. This dual approach protects data integrity. It also empowers decision-makers to drive initiatives with confidence.
Cloud Applications and Performance Optimization
Cloud computing has changed how to design and run data science workflows. It lets organizations deploy scalable, high-performing, and efficient solutions. Cloud apps give data scientists tools to optimize data tasks. This improves data accuracy and performance. Cloud resources and technologies can help data scientists. They can streamline workflows and get better results faster.
Cloud applications are now vital for businesses. They need scalability and flexibility. However, we must optimize these apps. It is crucial for a smooth user experience and efficient use of resources.
Organizations can improve their cloud apps. They can use:
-
auto-scaling
-
load balancing
-
performance monitoring
This will make them faster and more reliable. It will also boost customer satisfaction.
Cloud Resources Management and Future Trends
As cloud computing evolves, data scientists must keep up with its trends and advances. Data scientists can use the cloud to drive innovation and efficiency. Key areas are cloud migration, data mining, and resource optimization. With the right cloud framework and design, data scientists can maximize cloud computing. They can then unlock new opportunities for data-driven insights and decisions.
In tech's fast-changing world, we must manage cloud resources. It is key to improving performance and cutting costs. Future trends point to a rise in automated management tools. They will use AI and machine learning to improve resource use and track performance. Also, the push for sustainability is driving innovations in energy-efficient cloud tech. This is leading to a more eco-friendly approach to cloud computing.
How to obtain Data Science certification?
We are an Education Technology company providing certification training courses to accelerate careers of working professionals worldwide. We impart training through instructor-led classroom workshops, instructor-led live virtual training sessions, and self-paced e-learning courses.
We have successfully conducted training sessions in 108 countries across the globe and enabled thousands of working professionals to enhance the scope of their careers.
Our enterprise training portfolio includes in-demand and globally recognized certification training courses in Project Management, Quality Management, Business Analysis, IT Service Management, Agile and Scrum, Cyber Security, Data Science, and Emerging Technologies. Download our Enterprise Training Catalog from https://www.icertglobal.com/corporate-training-for-enterprises.php and https://www.icertglobal.com/index.php
Popular Courses include:
-
Project Management: PMP, CAPM ,PMI RMP
-
Quality Management: Six Sigma Black Belt ,Lean Six Sigma Green Belt, Lean Management, Minitab,CMMI
-
Business Analysis: CBAP, CCBA, ECBA
-
Agile Training: PMI-ACP , CSM , CSPO
-
Scrum Training: CSM
-
DevOps
-
Program Management: PgMP
-
Cloud Technology: Exin Cloud Computing
-
Citrix Client Adminisration: Citrix Cloud Administration
The 10 top-paying certifications to target in 2024 are:
Conclusion
In conclusion, the impact of cloud computing on data science cannot be overstated. Cloud technology has changed how data scientists work with data. It has made their work more efficient, scalable, and innovative. By using cloud resources and platforms, data scientists can improve their work. They can enhance data analysis, optimize performance, and boost business intelligence. Cloud computing will shape the future of data science. So, data scientists must use cloud tools to stay ahead. They must unlock their data's full potential.
Contact Us For More Information:
Visit : www.icertglobal.com Email : info@icertglobal.com
Using R for Time Series Analysis Forecasting Trends in 2024
Time series analysis is key for understanding data that depends on time. This includes stock prices, economic indicators, and weather patterns. In 2024, R, a top programming language, will be used for time series analysis by businesses, researchers, and data scientists. R's flexibility, library support, and visualization tools make it a great choice for exploring trends, seasonality, and for forecasting. This article will explore using R for time series analysis, forecasting, and 2024 trends.
Table Of Contents
- Overview of Time Series Analysis
- R Packages for Time Series Analysis
- Common Forecasting Techniques in R
- Visualization and Interpretation of Time Series Data in R
- Future Trends in Time Series Analysis Using R in 2024
- Conclusion
Overview of Time Series Analysis
A time series consists of a series of data points collected or recorded at successive points in time. They are collected at successive points in time, usually at regular intervals. The main goal of time series analysis is to find patterns. These include trends, seasonality, and noise. It helps identify the factors influencing these patterns and predicts future values.
- Key components of time series analysis:
- Trend: The long-term increase or decrease in data values.
- Seasonality: Cyclical patterns that repeat over a specific period (daily, monthly, yearly).
- Noise: Random variations in data that don't follow any identifiable pattern.
R has a rich ecosystem for time series analysis. Its packages, like forecast, TSA, xts, and tsibble, have tools for decomposition, visualization, and forecasting.
R Packages for Time Series Analysis
One of the main reasons R is favored for time series analysis is the variety of dedicated packages. Here are some crucial R packages used in time series analysis:
- forecast: This package is widely used for automatic time series forecasting. It simplifies creating time series models like ARIMA and Exponential Smoothing and generates forecasts. Functions like auto.arima() automatically determine the best-fitting model for a given dataset.
- The TSA package (Time Series Analysis) includes tools to analyze time series data. It uses techniques like autocorrelation and spectral analysis.
- xts and zoo: Both packages handle irregularly spaced time series data. They work well for large datasets.
- tsibble: A modern package for tidy time series data. It simplifies modeling, visualizing, and analyzing it with other tidyverse packages.
These packages offer great flexibility for data scientists. They can now forecast time-based data more efficiently.
Common Forecasting Techniques in R
R has several forecasting methods. They range from simple linear models to complex machine learning algorithms. Some of the most commonly used techniques include:
- ARIMA (AutoRegressive Integrated Moving Average) is a widely used technique for time series forecasting. It combines three components—autoregression (AR), differencing (I), and moving averages (MA). The forecast package's auto.arima() function can fit the best ARIMA model for your data.
- Exponential Smoothing (ETS): ETS is a time series forecasting method. It smooths data over time to find trends and seasonality. The ets() function from the forecast package is used to fit an exponential smoothing model.
- STL decomposition breaks down a time series into its trend, seasonal, and residual components. It helps to understand the data's structure before using forecasting models.
- Prophet: It was developed by Facebook. It handles time series data with strong seasonality and missing data. It is particularly useful when there are multiple seasonality factors (daily, weekly, yearly).
- Neural Networks: LSTM models are popular for time series forecasting. They belong to a category of machine learning algorithms. They can handle complex, non-linear relationships.
Visualization and Interpretation of Time Series Data in R
Visualization is key to understanding time series data. It helps to spot patterns, like trends and seasonality. R has tools for visualizing time series data. They can improve interpretation.
- Base R Plotting: The basic plotting functions in R, such as plot(), can be used to generate simple time series plots. They are useful for quickly visualizing data and inspecting trends.
- ggplot2: A powerful data visualization package. It lets you create complex plots by layering components. With scale_x_date() and facet_wrap(), ggplot2 can visualize time series data with different periods and groupings.
- Interactive Plots: R has libraries like dygraphs and plotly. They let users zoom into specific time windows. This makes it easier to explore large datasets.
Visualizations help find key insights. They show outliers, seasonal changes, and sudden trend shifts.
Future Trends in Time Series Analysis Using R in 2024
As we look forward to 2024, several trends are likely to shape the landscape of time series analysis in R:
- Automated Machine Learning (AutoML): More time series forecasting tools will adopt AutoML. It automates the selection, tuning, and optimization of models.
- We must handle large datasets from time-stamped IoT data and sensors. Integration with big data tools such as Spark and Hadoop through R will continue to grow.
- Deep Learning: Neural networks, like LSTM, are gaining traction. They suit sequential data. R packages like keras and tensorflow are making deep learning easy for time series analysis.
- Real-time Forecasting: There will be more focus on real-time analysis and forecasting. This is due to the need for quick decisions in finance, supply chain, and healthcare.
- As machine learning models grow more complex, we need explainable, interpretable ones. Tools that provide insights into how predictions are made will become crucial.
How to obtain Data science with R certification?
We are an Education Technology company providing certification training courses to accelerate careers of working professionals worldwide. We impart training through instructor-led classroom workshops, instructor-led live virtual training sessions, and self-paced e-learning courses.
We have successfully conducted training sessions in 108 countries across the globe and enabled thousands of working professionals to enhance the scope of their careers.
Our enterprise training portfolio includes in-demand and globally recognized certification training courses in Project Management, Quality Management, Business Analysis, IT Service Management, Agile and Scrum, Cyber Security, Data Science, and Emerging Technologies. Download our Enterprise Training Catalog from https://www.icertglobal.com/corporate-training-for-enterprises.php and https://www.icertglobal.com/index.php
Popular Courses include:
- Project Management: PMP, CAPM ,PMI RMP
- Quality Management: Six Sigma Black Belt ,Lean Six Sigma Green Belt, Lean Management, Minitab,CMMI
- Business Analysis: CBAP, CCBA, ECBA
- Agile Training: PMI-ACP , CSM , CSPO
- Scrum Training: CSM
- DevOps
- Program Management: PgMP
- Cloud Technology: Exin Cloud Computing
- Citrix Client Adminisration: Citrix Cloud Administration
The 10 top-paying certifications to target in 2024 are:
- Certified Information Systems Security Professional® (CISSP)
- AWS Certified Solutions Architect
- Google Certified Professional Cloud Architect
- Big Data Certification
- Data Science Certification
- Certified In Risk And Information Systems Control (CRISC)
- Certified Information Security Manager(CISM)
- Project Management Professional (PMP)® Certification
- Certified Ethical Hacker (CEH)
- Certified Scrum Master (CSM)
Conclusion
In Conclusion, R remains a powerful tool for conducting time series analysis and forecasting. Its many packages and strong community make it a top choice for data scientists. In 2024, time series forecasting will use ML, DL, and big data more. As tools and packages improve, R will lead in time series analysis. It will help businesses and researchers find insights and predict trends. We must embrace these advancements to stay ahead in data science. It is a rapidly evolving field.
Contact Us :
Contact Us For More Information:
Visit :www.icertglobal.com Email : info@icertglobal.com
Read More
Time series analysis is key for understanding data that depends on time. This includes stock prices, economic indicators, and weather patterns. In 2024, R, a top programming language, will be used for time series analysis by businesses, researchers, and data scientists. R's flexibility, library support, and visualization tools make it a great choice for exploring trends, seasonality, and for forecasting. This article will explore using R for time series analysis, forecasting, and 2024 trends.
Table Of Contents
- Overview of Time Series Analysis
- R Packages for Time Series Analysis
- Common Forecasting Techniques in R
- Visualization and Interpretation of Time Series Data in R
- Future Trends in Time Series Analysis Using R in 2024
- Conclusion
Overview of Time Series Analysis
A time series consists of a series of data points collected or recorded at successive points in time. They are collected at successive points in time, usually at regular intervals. The main goal of time series analysis is to find patterns. These include trends, seasonality, and noise. It helps identify the factors influencing these patterns and predicts future values.
- Key components of time series analysis:
- Trend: The long-term increase or decrease in data values.
- Seasonality: Cyclical patterns that repeat over a specific period (daily, monthly, yearly).
- Noise: Random variations in data that don't follow any identifiable pattern.
R has a rich ecosystem for time series analysis. Its packages, like forecast, TSA, xts, and tsibble, have tools for decomposition, visualization, and forecasting.
R Packages for Time Series Analysis
One of the main reasons R is favored for time series analysis is the variety of dedicated packages. Here are some crucial R packages used in time series analysis:
- forecast: This package is widely used for automatic time series forecasting. It simplifies creating time series models like ARIMA and Exponential Smoothing and generates forecasts. Functions like auto.arima() automatically determine the best-fitting model for a given dataset.
- The TSA package (Time Series Analysis) includes tools to analyze time series data. It uses techniques like autocorrelation and spectral analysis.
- xts and zoo: Both packages handle irregularly spaced time series data. They work well for large datasets.
- tsibble: A modern package for tidy time series data. It simplifies modeling, visualizing, and analyzing it with other tidyverse packages.
These packages offer great flexibility for data scientists. They can now forecast time-based data more efficiently.
Common Forecasting Techniques in R
R has several forecasting methods. They range from simple linear models to complex machine learning algorithms. Some of the most commonly used techniques include:
- ARIMA (AutoRegressive Integrated Moving Average) is a widely used technique for time series forecasting. It combines three components—autoregression (AR), differencing (I), and moving averages (MA). The forecast package's auto.arima() function can fit the best ARIMA model for your data.
- Exponential Smoothing (ETS): ETS is a time series forecasting method. It smooths data over time to find trends and seasonality. The ets() function from the forecast package is used to fit an exponential smoothing model.
- STL decomposition breaks down a time series into its trend, seasonal, and residual components. It helps to understand the data's structure before using forecasting models.
- Prophet: It was developed by Facebook. It handles time series data with strong seasonality and missing data. It is particularly useful when there are multiple seasonality factors (daily, weekly, yearly).
- Neural Networks: LSTM models are popular for time series forecasting. They belong to a category of machine learning algorithms. They can handle complex, non-linear relationships.
Visualization and Interpretation of Time Series Data in R
Visualization is key to understanding time series data. It helps to spot patterns, like trends and seasonality. R has tools for visualizing time series data. They can improve interpretation.
- Base R Plotting: The basic plotting functions in R, such as plot(), can be used to generate simple time series plots. They are useful for quickly visualizing data and inspecting trends.
- ggplot2: A powerful data visualization package. It lets you create complex plots by layering components. With scale_x_date() and facet_wrap(), ggplot2 can visualize time series data with different periods and groupings.
- Interactive Plots: R has libraries like dygraphs and plotly. They let users zoom into specific time windows. This makes it easier to explore large datasets.
Visualizations help find key insights. They show outliers, seasonal changes, and sudden trend shifts.
Future Trends in Time Series Analysis Using R in 2024
As we look forward to 2024, several trends are likely to shape the landscape of time series analysis in R:
- Automated Machine Learning (AutoML): More time series forecasting tools will adopt AutoML. It automates the selection, tuning, and optimization of models.
- We must handle large datasets from time-stamped IoT data and sensors. Integration with big data tools such as Spark and Hadoop through R will continue to grow.
- Deep Learning: Neural networks, like LSTM, are gaining traction. They suit sequential data. R packages like keras and tensorflow are making deep learning easy for time series analysis.
- Real-time Forecasting: There will be more focus on real-time analysis and forecasting. This is due to the need for quick decisions in finance, supply chain, and healthcare.
- As machine learning models grow more complex, we need explainable, interpretable ones. Tools that provide insights into how predictions are made will become crucial.
How to obtain Data science with R certification?
We are an Education Technology company providing certification training courses to accelerate careers of working professionals worldwide. We impart training through instructor-led classroom workshops, instructor-led live virtual training sessions, and self-paced e-learning courses.
We have successfully conducted training sessions in 108 countries across the globe and enabled thousands of working professionals to enhance the scope of their careers.
Our enterprise training portfolio includes in-demand and globally recognized certification training courses in Project Management, Quality Management, Business Analysis, IT Service Management, Agile and Scrum, Cyber Security, Data Science, and Emerging Technologies. Download our Enterprise Training Catalog from https://www.icertglobal.com/corporate-training-for-enterprises.php and https://www.icertglobal.com/index.php
Popular Courses include:
- Project Management: PMP, CAPM ,PMI RMP
- Quality Management: Six Sigma Black Belt ,Lean Six Sigma Green Belt, Lean Management, Minitab,CMMI
- Business Analysis: CBAP, CCBA, ECBA
- Agile Training: PMI-ACP , CSM , CSPO
- Scrum Training: CSM
- DevOps
- Program Management: PgMP
- Cloud Technology: Exin Cloud Computing
- Citrix Client Adminisration: Citrix Cloud Administration
The 10 top-paying certifications to target in 2024 are:
- Certified Information Systems Security Professional® (CISSP)
- AWS Certified Solutions Architect
- Google Certified Professional Cloud Architect
- Big Data Certification
- Data Science Certification
- Certified In Risk And Information Systems Control (CRISC)
- Certified Information Security Manager(CISM)
- Project Management Professional (PMP)® Certification
- Certified Ethical Hacker (CEH)
- Certified Scrum Master (CSM)
Conclusion
In Conclusion, R remains a powerful tool for conducting time series analysis and forecasting. Its many packages and strong community make it a top choice for data scientists. In 2024, time series forecasting will use ML, DL, and big data more. As tools and packages improve, R will lead in time series analysis. It will help businesses and researchers find insights and predict trends. We must embrace these advancements to stay ahead in data science. It is a rapidly evolving field.
Contact Us :
Contact Us For More Information:
Visit :www.icertglobal.com Email : info@icertglobal.com
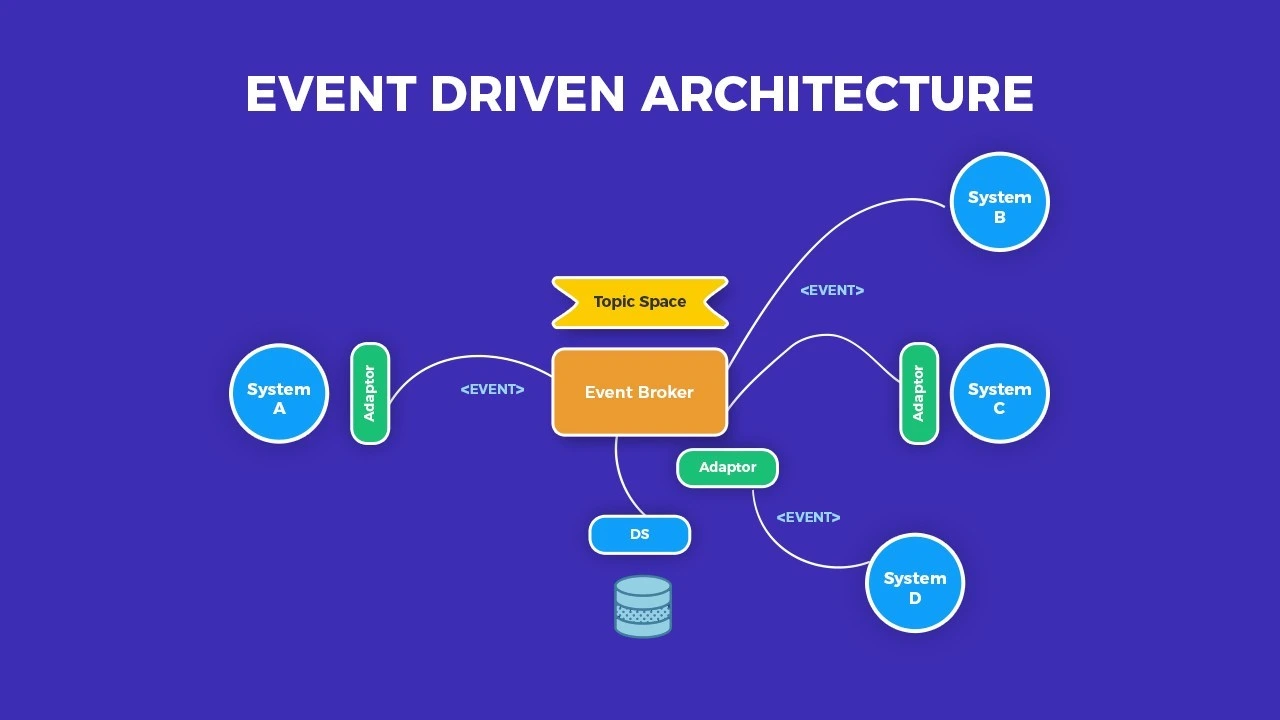
Kafka and Microservices: Building Event-Driven Architecture
In the fast-evolving tech world, businesses seek to optimize their systems to meet today's digital demands. A popular approach is to use Kafka and microservices. It creates efficient, event-driven architectures. Using Kafka, a distributed messaging system, with microservices can help businesses. They can gain scalability, real-time streaming, and data integration. They can gain many other benefits, too. Let's explore how Kafka and microservices work together. They form an efficient, event-driven architecture.
Understanding Kafka and Microservices
Kafka:
Apache Kafka is a distributed streaming platform. It handles high-throughput, fault-tolerant, and scalable real-time data feeds. It allows for creating topics. They act as message brokers for communication between system components. Kafka lets businesses process data streams in real-time. It also reliably stores and transfers data.
Microservices:
Microservices architecture splits apps into smaller, deployable services. These services communicate via defined APIs. It allows for easier maintenance, scalability, and quicker development cycles. Microservices also enable organizations to adopt a more agile approach to software development.
Benefits of Using Kafka and Microservices Together
Efficient Communication:
By combining Kafka with microservices, businesses can improve their architecture. It will enable efficient communication between its different components. Kafka topics act as message queues, allowing for asynchronous communication and decoupling services. This enables faster processing of events and prevents bottlenecks in the system.
Partitioning and Fault Tolerance:
Kafka partitions topics. This spreads data across multiple nodes. It improves scalability and fault tolerance. In the event of a node failure, Kafka ensures that data is not lost and can be recovered from other nodes in the cluster. This ensures high availability and reliability of the system.
"Partitioning and Fault Tolerance" examines data distribution across multiple partitions in systems. It aims to improve performance and scalability. Systems like Apache Kafka use partitioning to balance workloads. This leads to faster data processing. Also, fault tolerance mechanisms ensure resilience. They prevent failures in one part of the system from disrupting the entire operation.
Scalability:
Both Kafka and microservices are scalable. They let businesses handle increased loads and data volumes. Kafka is distributed. Microservices can be deployed independently. This makes it easy to scale different system components as needed. This ensures that the architecture can grow with the business requirements.
Stream Processing and Data Integration:
Kafka's streaming capabilities let businesses process data as it's generated. Integrating Kafka with microservices lets organizations build complex data pipelines. These can analyze, transform, and store data in real-time. This enables businesses to make informed decisions based on up-to-date information.
"Stream Processing and Data Integration" examines real-time data and system integration. Learn how stream processing platforms like Apache Kafka help businesses. They process large data flows and integrate them with various systems. This video shows you how to use continuous data streams. They can provide faster insights and make apps more responsive.
Event-Driven Design:
Kafka and microservices fit well with event-driven architectures. In these, events, not workflows, trigger actions. This design paradigm helps businesses build systems that are reactive, scalable, and resilient. They can adapt easily to changing requirements. Event-driven architectures are particularly valuable in scenarios where real-time responsiveness is crucial.
"Event-Driven Design" changes how apps handle data. It focuses on events as the main way to communicate. This approach boosts scalability and responsiveness. It lets systems process events asynchronously and independently. Adopting event-driven design can streamline workflows and boost performance. It can also enable real-time data processing.
How to obtain Apache Kafka certification?
We are an Education Technology company providing certification training courses to accelerate careers of working professionals worldwide. We impart training through instructor-led classroom workshops, instructor-led live virtual training sessions, and self-paced e-learning courses.
We have successfully conducted training sessions in 108 countries across the globe and enabled thousands of working professionals to enhance the scope of their careers.
Our enterprise training portfolio includes in-demand and globally recognized certification training courses in Project Management, Quality Management, Business Analysis, IT Service Management, Agile and Scrum, Cyber Security, Data Science, and Emerging Technologies. Download our Enterprise Training Catalog from https://www.icertglobal.com/corporate-training-for-enterprises.php and https://www.icertglobal.com/index.php
Popular Courses include:
-
Project Management: PMP, CAPM ,PMI RMP
-
Quality Management: Six Sigma Black Belt ,Lean Six Sigma Green Belt, Lean Management, Minitab,CMMI
-
Business Analysis: CBAP, CCBA, ECBA
-
Agile Training: PMI-ACP , CSM , CSPO
-
Scrum Training: CSM
-
DevOps
-
Program Management: PgMP
-
Cloud Technology: Exin Cloud Computing
-
Citrix Client Adminisration: Citrix Cloud Administration
The 10 top-paying certifications to target in 2024 are:
Conclusion
In conclusion, Kafka and microservices give businesses a strong toolset. It lets them build efficient, event-driven architectures. By using Kafka's messaging system and microservices' modular design, organizations can gain scalability, real-time data processing, and seamless communication between components. This approach helps businesses build systems that are resilient, agile, and future-proof. They can adapt to a fast-changing digital landscape. By adopting Kafka and microservices, businesses can innovate and grow. They can stay ahead of the curve and find new opportunities.
Contact Us For More Information:
Visit : www.icertglobal.com Email : info@icertglobal.com
Read More
In the fast-evolving tech world, businesses seek to optimize their systems to meet today's digital demands. A popular approach is to use Kafka and microservices. It creates efficient, event-driven architectures. Using Kafka, a distributed messaging system, with microservices can help businesses. They can gain scalability, real-time streaming, and data integration. They can gain many other benefits, too. Let's explore how Kafka and microservices work together. They form an efficient, event-driven architecture.
Understanding Kafka and Microservices
Kafka:
Apache Kafka is a distributed streaming platform. It handles high-throughput, fault-tolerant, and scalable real-time data feeds. It allows for creating topics. They act as message brokers for communication between system components. Kafka lets businesses process data streams in real-time. It also reliably stores and transfers data.
Microservices:
Microservices architecture splits apps into smaller, deployable services. These services communicate via defined APIs. It allows for easier maintenance, scalability, and quicker development cycles. Microservices also enable organizations to adopt a more agile approach to software development.
Benefits of Using Kafka and Microservices Together
Efficient Communication:
By combining Kafka with microservices, businesses can improve their architecture. It will enable efficient communication between its different components. Kafka topics act as message queues, allowing for asynchronous communication and decoupling services. This enables faster processing of events and prevents bottlenecks in the system.
Partitioning and Fault Tolerance:
Kafka partitions topics. This spreads data across multiple nodes. It improves scalability and fault tolerance. In the event of a node failure, Kafka ensures that data is not lost and can be recovered from other nodes in the cluster. This ensures high availability and reliability of the system.
"Partitioning and Fault Tolerance" examines data distribution across multiple partitions in systems. It aims to improve performance and scalability. Systems like Apache Kafka use partitioning to balance workloads. This leads to faster data processing. Also, fault tolerance mechanisms ensure resilience. They prevent failures in one part of the system from disrupting the entire operation.
Scalability:
Both Kafka and microservices are scalable. They let businesses handle increased loads and data volumes. Kafka is distributed. Microservices can be deployed independently. This makes it easy to scale different system components as needed. This ensures that the architecture can grow with the business requirements.
Stream Processing and Data Integration:
Kafka's streaming capabilities let businesses process data as it's generated. Integrating Kafka with microservices lets organizations build complex data pipelines. These can analyze, transform, and store data in real-time. This enables businesses to make informed decisions based on up-to-date information.
"Stream Processing and Data Integration" examines real-time data and system integration. Learn how stream processing platforms like Apache Kafka help businesses. They process large data flows and integrate them with various systems. This video shows you how to use continuous data streams. They can provide faster insights and make apps more responsive.
Event-Driven Design:
Kafka and microservices fit well with event-driven architectures. In these, events, not workflows, trigger actions. This design paradigm helps businesses build systems that are reactive, scalable, and resilient. They can adapt easily to changing requirements. Event-driven architectures are particularly valuable in scenarios where real-time responsiveness is crucial.
"Event-Driven Design" changes how apps handle data. It focuses on events as the main way to communicate. This approach boosts scalability and responsiveness. It lets systems process events asynchronously and independently. Adopting event-driven design can streamline workflows and boost performance. It can also enable real-time data processing.
How to obtain Apache Kafka certification?
We are an Education Technology company providing certification training courses to accelerate careers of working professionals worldwide. We impart training through instructor-led classroom workshops, instructor-led live virtual training sessions, and self-paced e-learning courses.
We have successfully conducted training sessions in 108 countries across the globe and enabled thousands of working professionals to enhance the scope of their careers.
Our enterprise training portfolio includes in-demand and globally recognized certification training courses in Project Management, Quality Management, Business Analysis, IT Service Management, Agile and Scrum, Cyber Security, Data Science, and Emerging Technologies. Download our Enterprise Training Catalog from https://www.icertglobal.com/corporate-training-for-enterprises.php and https://www.icertglobal.com/index.php
Popular Courses include:
-
Project Management: PMP, CAPM ,PMI RMP
-
Quality Management: Six Sigma Black Belt ,Lean Six Sigma Green Belt, Lean Management, Minitab,CMMI
-
Business Analysis: CBAP, CCBA, ECBA
-
Agile Training: PMI-ACP , CSM , CSPO
-
Scrum Training: CSM
-
DevOps
-
Program Management: PgMP
-
Cloud Technology: Exin Cloud Computing
-
Citrix Client Adminisration: Citrix Cloud Administration
The 10 top-paying certifications to target in 2024 are:
Conclusion
In conclusion, Kafka and microservices give businesses a strong toolset. It lets them build efficient, event-driven architectures. By using Kafka's messaging system and microservices' modular design, organizations can gain scalability, real-time data processing, and seamless communication between components. This approach helps businesses build systems that are resilient, agile, and future-proof. They can adapt to a fast-changing digital landscape. By adopting Kafka and microservices, businesses can innovate and grow. They can stay ahead of the curve and find new opportunities.
Contact Us For More Information:
Visit : www.icertglobal.com Email : info@icertglobal.com

The Future of Self Service BI Empowering Non Technical Users
In today's rapidly evolving business landscape, data is king. Organizations that can use data have a competitive edge. They can make informed decisions, drive innovation, and stay ahead of the curve. One technology that has changed business data use is Self-Service BI. But what does the future hold for Self-Service BI? How will it empower non-technical users to leverage data?
Self-Service BI: Transforming the Business Intelligence Landscape
Self-Service BI lets users access and analyze data without tech skills. Non-technical users can easily explore and visualize data. They can use user-friendly tools and interactive dashboards. This helps them find insights and make data-driven decisions. This democratization of data empowers users to control their data. It will drive business success.
Self-service Business Intelligence (BI) is changing how organizations use their data. It lets users create reports and insights without relying much on IT. Giving everyone access to data lets them make better decisions and drive growth. Self-service BI tools are evolving. They are now more user-friendly. They offer advanced analytics and visualizations. These features make businesses more agile.
Empowering Non-Technical Users
The future of Self-Service BI lies in its ability to empower non-technical users. Self-Service BI tools let users easily explore and analyze data. They have intuitive interfaces, drag-and-drop features, and natural language processing. Users don't need IT support. This design helps all users, no matter their tech skills. It lets them access data to drive business growth.
Empowering non-technical users with business intelligence (BI) tools transforms how organizations harness data. These tools have easy, intuitive interfaces and self-service features. They let non-technical users generate insights and make data-driven decisions. This democratization of data boosts decision-making at all levels. It also fosters a more data-centric culture.
The Role of Technology in Self-Service BI
As technology continues to advance, so too do the capabilities of Self-Service BI. BI tools are now adding AI and machine learning. This enables predictive analytics and personalized insights. Cloud-based solutions offer scalable, accessible platforms for data analysis. Big data integration provides a complete view of organizational data. New tech is evolving Self-Service BI. It's now more powerful and efficient than ever.
Technology is revolutionizing self-service business intelligence (BI). It empowers users with intuitive, easy-to-use tools to analyze data on their own. Advanced analytics platforms now have great features. They include drag-and-drop interfaces, automated insights, and natural language queries. These make complex data analysis easy for non-experts. As these technologies evolve, they improve decision-making. They also foster data-driven cultures in organizations.
The Benefits of Self-Service BI for Non-Technical Users
The benefits of Self-Service BI for non-technical users are vast. Self-reliance in data analysis lets users decide faster and better. Custom reporting and trend analysis tools help users find hidden insights. Interactive dashboards show real-time visualizations of key metrics. Self-Service BI lets non-tech users become knowledge workers. It drives innovation and creativity in the organization.
Self-service BI empowers non-technical users. It gives them easy access to data and analytics, without needing much IT support. It enables quicker decision-making. Users can generate their own reports and insights. This fosters a more agile business environment. Self-service BI tools boost data literacy. They simplify complex data processes. This leads to better data-driven strategies across teams.
The Future of Self-Service BI: Innovation and Collaboration
As Self-Service BI evolves, we can expect more user-friendly tools and advanced analytics. The focus will shift to seamless integration and decentralized analytics. This will let users analyze data across multiple sources. Collaboration will be key. Self-Service BI tools will let teams collaborate on data analysis and decisions. This teamwork will boost efficiency in data-driven processes. It will lead to greater success and optimization for the organization.
The future of self-service BI will see major innovation. Advanced technologies will make data analysis more intuitive and accessible. New tools are boosting collaboration. They let teams share insights and interact with data in real time, breaking down silos. As these solutions improve, businesses will benefit. They will make faster decisions and develop a stronger, data-driven culture.
How to obtain Data Science and Business Intelligence certification?
We are an Education Technology company providing certification training courses to accelerate careers of working professionals worldwide. We impart training through instructor-led classroom workshops, instructor-led live virtual training sessions, and self-paced e-learning courses.
We have successfully conducted training sessions in 108 countries across the globe and enabled thousands of working professionals to enhance the scope of their careers.
Our enterprise training portfolio includes in-demand and globally recognized certification training courses in Project Management, Quality Management, Business Analysis, IT Service Management, Agile and Scrum, Cyber Security, Data Science, and Emerging Technologies. Download our Enterprise Training Catalog from https://www.icertglobal.com/corporate-training-for-enterprises.php and https://www.icertglobal.com/index.php
Popular Courses include:
-
Project Management: PMP, CAPM ,PMI RMP
-
Quality Management: Six Sigma Black Belt ,Lean Six Sigma Green Belt, Lean Management, Minitab,CMMI
-
Business Analysis: CBAP, CCBA, ECBA
-
Agile Training: PMI-ACP , CSM , CSPO
-
Scrum Training: CSM
-
DevOps
-
Program Management: PgMP
-
Cloud Technology: Exin Cloud Computing
-
Citrix Client Adminisration: Citrix Cloud Administration
The 10 top-paying certifications to target in 2024 are:
Conclusion
In conclusion, Self-Service BI has a bright future. Technology is driving innovation and empowering non-technical users. Self-Service BI is changing how organizations access and analyze data. It democratizes data and provides user-friendly tools. As businesses adopt digital transformation, Self-Service BI will be key. It will boost agility, competitiveness, and success. With the right tools and training, non-technical users can use data. They can then make informed decisions and drive business growth in the digital age.
Contact Us For More Information:
Visit : www.icertglobal.com Email : info@icertglobal.com
Read More
In today's rapidly evolving business landscape, data is king. Organizations that can use data have a competitive edge. They can make informed decisions, drive innovation, and stay ahead of the curve. One technology that has changed business data use is Self-Service BI. But what does the future hold for Self-Service BI? How will it empower non-technical users to leverage data?
Self-Service BI: Transforming the Business Intelligence Landscape
Self-Service BI lets users access and analyze data without tech skills. Non-technical users can easily explore and visualize data. They can use user-friendly tools and interactive dashboards. This helps them find insights and make data-driven decisions. This democratization of data empowers users to control their data. It will drive business success.
Self-service Business Intelligence (BI) is changing how organizations use their data. It lets users create reports and insights without relying much on IT. Giving everyone access to data lets them make better decisions and drive growth. Self-service BI tools are evolving. They are now more user-friendly. They offer advanced analytics and visualizations. These features make businesses more agile.
Empowering Non-Technical Users
The future of Self-Service BI lies in its ability to empower non-technical users. Self-Service BI tools let users easily explore and analyze data. They have intuitive interfaces, drag-and-drop features, and natural language processing. Users don't need IT support. This design helps all users, no matter their tech skills. It lets them access data to drive business growth.
Empowering non-technical users with business intelligence (BI) tools transforms how organizations harness data. These tools have easy, intuitive interfaces and self-service features. They let non-technical users generate insights and make data-driven decisions. This democratization of data boosts decision-making at all levels. It also fosters a more data-centric culture.
The Role of Technology in Self-Service BI
As technology continues to advance, so too do the capabilities of Self-Service BI. BI tools are now adding AI and machine learning. This enables predictive analytics and personalized insights. Cloud-based solutions offer scalable, accessible platforms for data analysis. Big data integration provides a complete view of organizational data. New tech is evolving Self-Service BI. It's now more powerful and efficient than ever.
Technology is revolutionizing self-service business intelligence (BI). It empowers users with intuitive, easy-to-use tools to analyze data on their own. Advanced analytics platforms now have great features. They include drag-and-drop interfaces, automated insights, and natural language queries. These make complex data analysis easy for non-experts. As these technologies evolve, they improve decision-making. They also foster data-driven cultures in organizations.
The Benefits of Self-Service BI for Non-Technical Users
The benefits of Self-Service BI for non-technical users are vast. Self-reliance in data analysis lets users decide faster and better. Custom reporting and trend analysis tools help users find hidden insights. Interactive dashboards show real-time visualizations of key metrics. Self-Service BI lets non-tech users become knowledge workers. It drives innovation and creativity in the organization.
Self-service BI empowers non-technical users. It gives them easy access to data and analytics, without needing much IT support. It enables quicker decision-making. Users can generate their own reports and insights. This fosters a more agile business environment. Self-service BI tools boost data literacy. They simplify complex data processes. This leads to better data-driven strategies across teams.
The Future of Self-Service BI: Innovation and Collaboration
As Self-Service BI evolves, we can expect more user-friendly tools and advanced analytics. The focus will shift to seamless integration and decentralized analytics. This will let users analyze data across multiple sources. Collaboration will be key. Self-Service BI tools will let teams collaborate on data analysis and decisions. This teamwork will boost efficiency in data-driven processes. It will lead to greater success and optimization for the organization.
The future of self-service BI will see major innovation. Advanced technologies will make data analysis more intuitive and accessible. New tools are boosting collaboration. They let teams share insights and interact with data in real time, breaking down silos. As these solutions improve, businesses will benefit. They will make faster decisions and develop a stronger, data-driven culture.
How to obtain Data Science and Business Intelligence certification?
We are an Education Technology company providing certification training courses to accelerate careers of working professionals worldwide. We impart training through instructor-led classroom workshops, instructor-led live virtual training sessions, and self-paced e-learning courses.
We have successfully conducted training sessions in 108 countries across the globe and enabled thousands of working professionals to enhance the scope of their careers.
Our enterprise training portfolio includes in-demand and globally recognized certification training courses in Project Management, Quality Management, Business Analysis, IT Service Management, Agile and Scrum, Cyber Security, Data Science, and Emerging Technologies. Download our Enterprise Training Catalog from https://www.icertglobal.com/corporate-training-for-enterprises.php and https://www.icertglobal.com/index.php
Popular Courses include:
-
Project Management: PMP, CAPM ,PMI RMP
-
Quality Management: Six Sigma Black Belt ,Lean Six Sigma Green Belt, Lean Management, Minitab,CMMI
-
Business Analysis: CBAP, CCBA, ECBA
-
Agile Training: PMI-ACP , CSM , CSPO
-
Scrum Training: CSM
-
DevOps
-
Program Management: PgMP
-
Cloud Technology: Exin Cloud Computing
-
Citrix Client Adminisration: Citrix Cloud Administration
The 10 top-paying certifications to target in 2024 are:
Conclusion
In conclusion, Self-Service BI has a bright future. Technology is driving innovation and empowering non-technical users. Self-Service BI is changing how organizations access and analyze data. It democratizes data and provides user-friendly tools. As businesses adopt digital transformation, Self-Service BI will be key. It will boost agility, competitiveness, and success. With the right tools and training, non-technical users can use data. They can then make informed decisions and drive business growth in the digital age.
Contact Us For More Information:
Visit : www.icertglobal.com Email : info@icertglobal.com
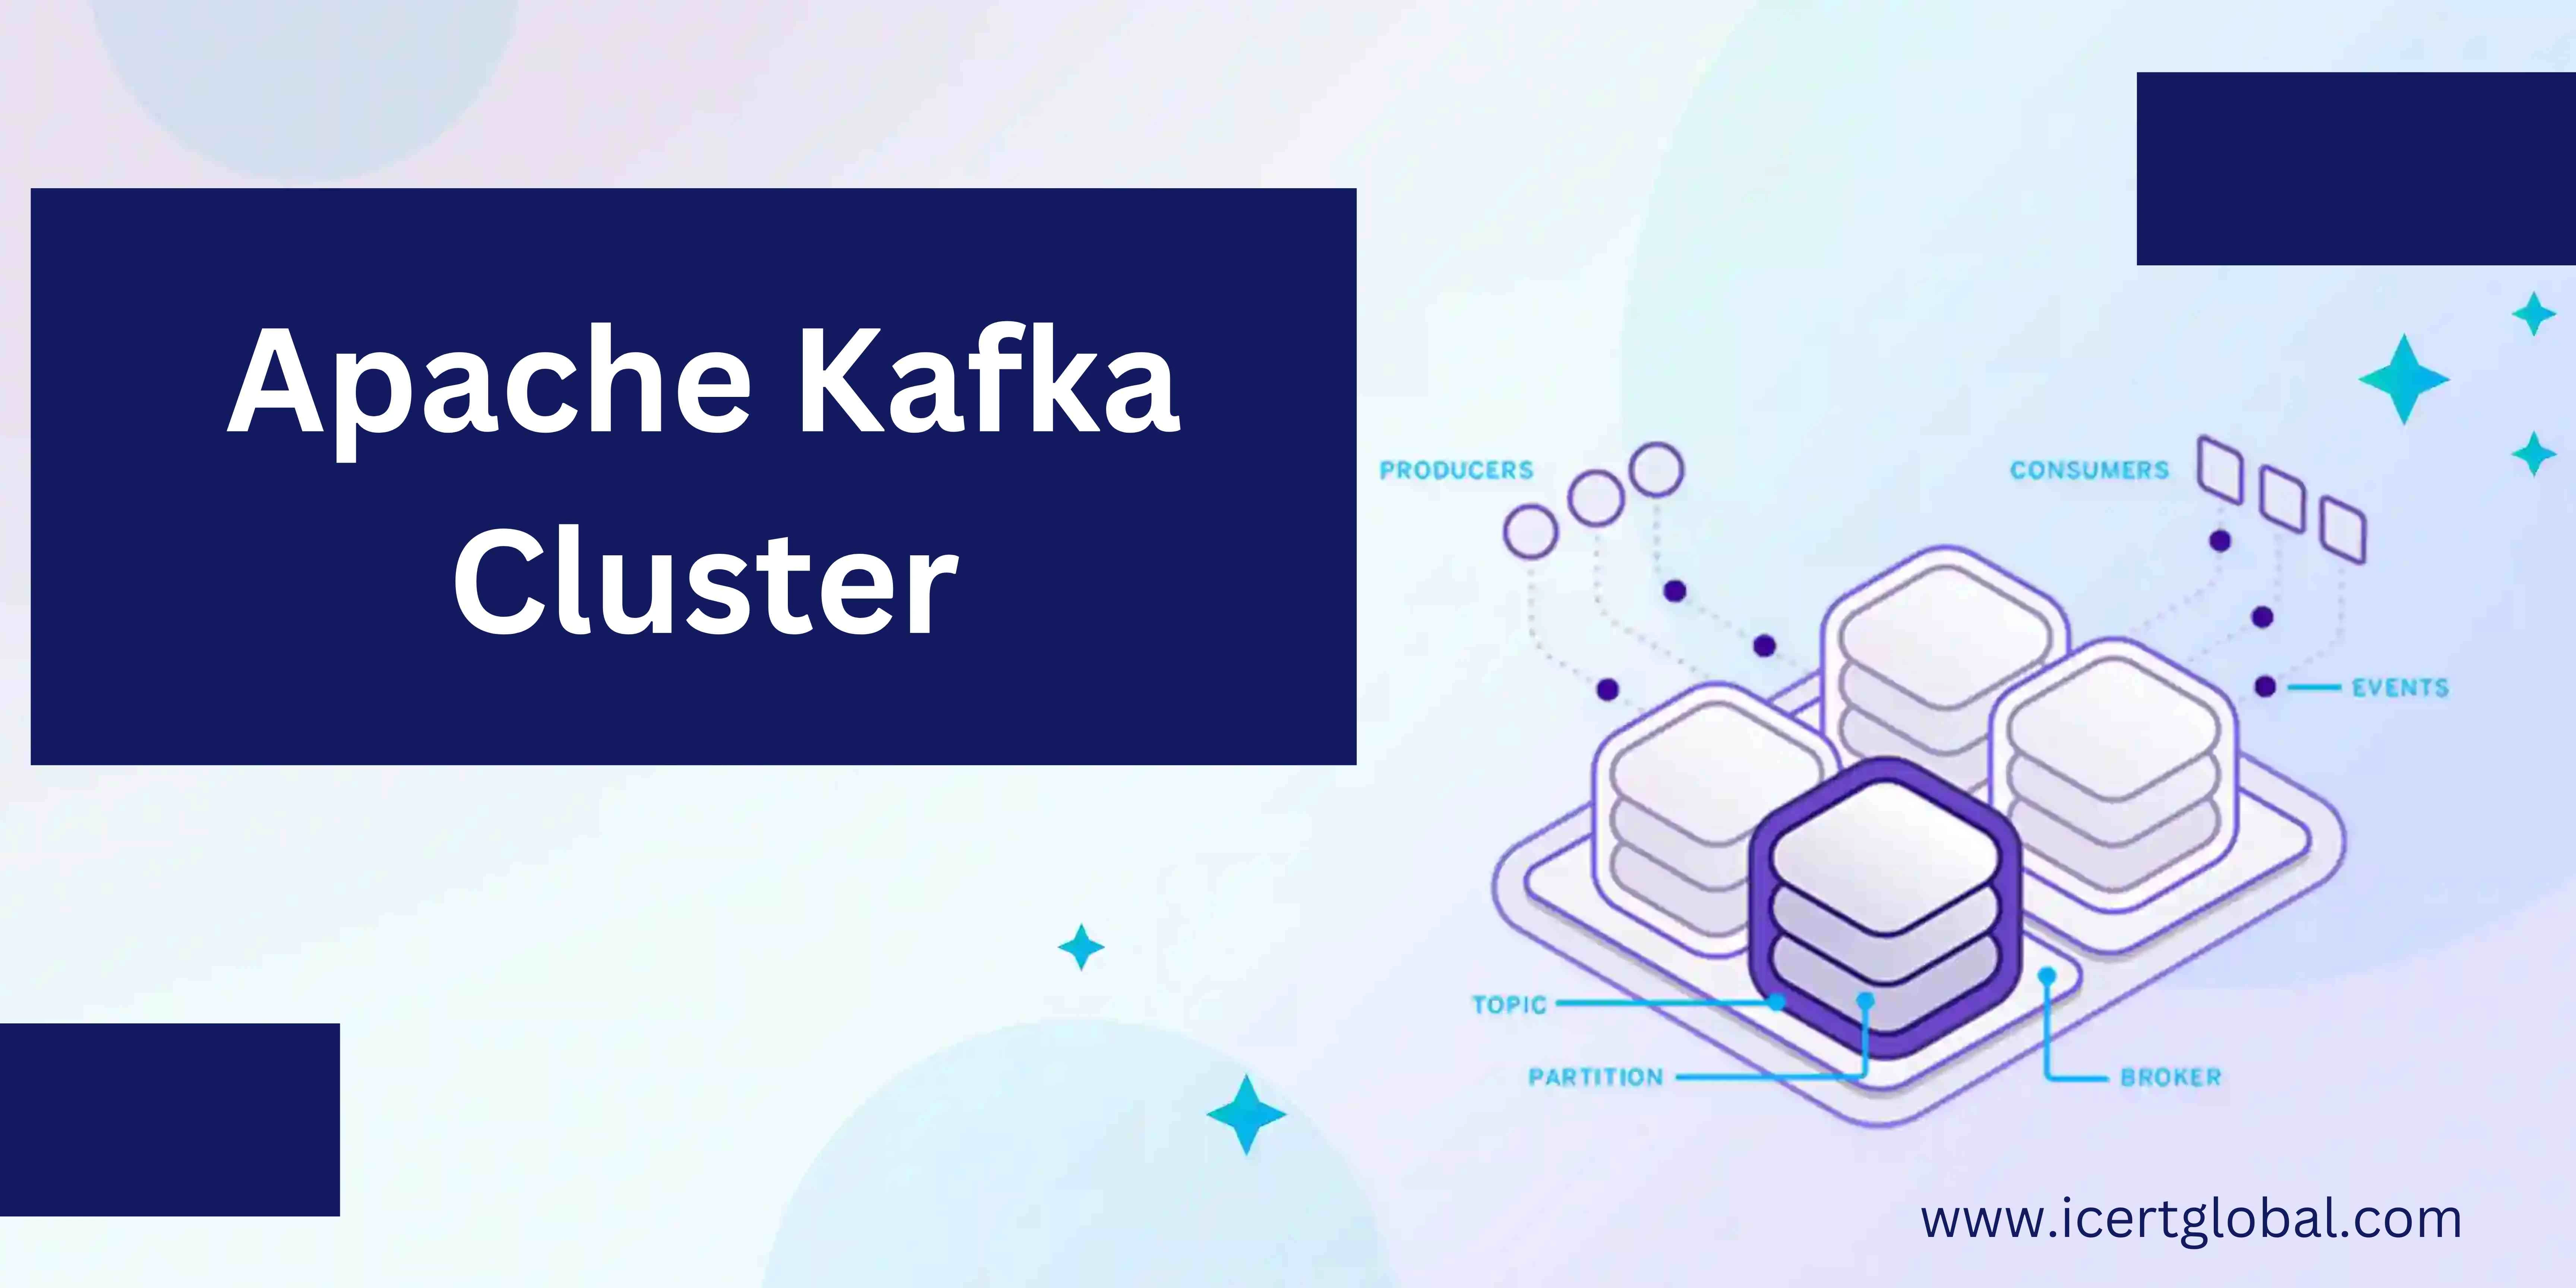
How to Set Up a Fault-Tolerant Apache Kafka Cluster!!!!
It's vital to set up a fault-tolerant Apache Kafka cluster. It ensures high availability, data integrity, and reliable message streaming. Kafka's distributed architecture supports fault tolerance. However, some configurations are needed to maximize the cluster's resilience. This guide will show you how to set up a fault-tolerant Kafka cluster. It will cover essential components and best practices for a robust streaming platform.
Apache Kafka is a distributed streaming platform. It has high throughput and is highly scalable. However, building a truly fault-tolerant Kafka cluster requires careful planning and implementation. Kafka achieves fault tolerance mainly through replication. Data is copied across many nodes (brokers) in the cluster. When a broker fails, Kafka shifts traffic to other nodes. This keeps message streaming going without data loss.
This guide gives a thorough overview of setting up a fault-tolerant Kafka cluster. It covers cluster design, broker configuration, data replication, monitoring, and maintenance.
Table Of Contents
- Cluster Planning and Design
- Installing and Configuring Kafka Brokers
- Configuring Fault Tolerance Parameters
- Implementing Monitoring and Alerts
- Regular Maintenance and Testing
- Conclusion
Cluster Planning and Design
- Before diving into the setup, proper planning and design of the Kafka cluster is crucial. This step is to decide on three things: the number of brokers, the data replication factors, and the partitioning strategies.
- Check the number of brokers. It affects a Kafka cluster's fault tolerance and data distribution. For fault tolerance, use at least three brokers. This allows for leader election and data replication. More brokers improve fault tolerance. But larger clusters are harder to manage.
- Set Up Zookeeper: Apache Kafka uses Zookeeper to manage its cluster and brokers. A Zookeeper ensemble needs at least three nodes to maintain quorum if any fail. Make sure Zookeeper nodes are installed on separate servers for improved reliability.
- Decide on Partitioning: In Kafka, topics are split into partitions. These are distributed across brokers. Proper partitioning improves fault tolerance and parallelism. Plan the number of partitions. Do it based on the expected message throughput and the need for parallel processing.
Installing and Configuring Kafka Brokers
After the cluster design is done, install and configure the Kafka brokers on the servers. Proper configuration lets each broker handle traffic efficiently. It also helps with fault tolerance.
- Install Kafka: Download and install Apache Kafka on each broker server. Extract the package. Then, configure the server.properties file to set up broker-specific parameters.
- Set Broker IDs and Log Directories: Each Kafka broker must have a unique ID in the server.properties file. Set up the log directory path (log.dirs) for storing data. The log directory must be on a reliable, preferably RAID disk. This is to prevent data loss from hardware failure.
- Enable Broker Intercommunication: Configure listeners and advertised listeners for broker communication. This step is critical for multi-broker clusters. It ensures that brokers and clients can communicate properly.
- Set up Data Replication: In Kafka, the replication factor is how many copies of data are in the cluster. Set a replication factor of at least 3 for fault tolerance. For example, in the server.properties file, set default.replication.factor=3. It replicates topic partitions across three brokers.
Configuring Fault Tolerance Parameters
Kafka provides several configuration parameters to fine-tune fault tolerance and data consistency. Adjusting these parameters helps achieve an optimal balance between performance and reliability.
- Replication Factor: Ensure that each topic has an appropriate replication factor. A higher replication factor improves fault tolerance. It keeps more copies of data across the cluster. The recommended minimum is 3 to withstand multiple broker failures.
- Min In-Sync Replicas: The min.insync.replicas setting is the minimum number of replicas that must confirm a write for it to be successful. Set this to a value less than the replication factor but at least 2. It ensures that data is written to more than one replica for redundancy.
- Unclean Leader Election: In the server.properties file, set unclean.leader.election.enable to false. This will prevent a replica that hasn't caught up with the leader from becoming the new leader. This setting allows only fully synchronized replicas to be elected. It protects data integrity if brokers fail.
Implementing Monitoring and Alerts
Continuous monitoring of the Kafka cluster is essential to maintain fault tolerance. Monitoring tools help detect potential failures early and ensure smooth cluster operation.
- Set up Kafka monitoring tools. Use Kafka Manager, Confluent Control Center, or open-source tools like Prometheus and Grafana. These can check broker health, partition status, and consumer lag.
- Enable JMX Metrics: Kafka brokers expose JMX (Java Management Extensions) metrics. They show detailed information on broker performance, replication status, and consumer group health. Configure a JMX exporter to collect these metrics for real-time monitoring.
- Configure Alerts: Set up alerts for critical events, like broker failures and high consumer lag. Also, check for under-replicated partitions. Alerts help the operations team respond quickly to issues. This minimizes downtime and prevents data loss.
Regular Maintenance and Testing
Fault tolerance is not a one-time setup. It needs ongoing maintenance and testing. This will ensure the cluster is robust in various conditions.
- Back up the Kafka config files, Zookeeper data, and metadata. Do this regularly. This will help you recover quickly from failures. Consider using tools like Kafka MirrorMaker. It can replicate data to another cluster for disaster recovery.
- Test Failover Scenarios: Periodically test the cluster's fault tolerance. Simulate broker failures and watch the system's response. Ensure leader elections occur correctly, and data replication resumes seamlessly without data loss.
- Upgrade and Patch Management: Keep Kafka and Zookeeper updated with the latest patches. Use the latest versions. New releases often include critical security fixes and performance boosts. They make the cluster more resilient.
How to obtain Apache Kafka Certification?
We are an Education Technology company providing certification training courses to accelerate careers of working professionals worldwide. We impart training through instructor-led classroom workshops, instructor-led live virtual training sessions, and self-paced e-learning courses.
We have successfully conducted training sessions in 108 countries across the globe and enabled thousands of working professionals to enhance the scope of their careers.
Our enterprise training portfolio includes in-demand and globally recognized certification training courses in Project Management, Quality Management, Business Analysis, IT Service Management, Agile and Scrum, Cyber Security, Data Science, and Emerging Technologies. Download our Enterprise Training Catalog from https://www.icertglobal.com/corporate-training-for-enterprises.php and https://www.icertglobal.com/index.php
Popular Courses include:
- Project Management: PMP, CAPM ,PMI RMP
- Quality Management: Six Sigma Black Belt ,Lean Six Sigma Green Belt, Lean Management, Minitab,CMMI
- Business Analysis: CBAP, CCBA, ECBA
- Agile Training: PMI-ACP , CSM , CSPO
- Scrum Training: CSM
- DevOps
- Program Management: PgMP
- Cloud Technology: Exin Cloud Computing
- Citrix Client Adminisration: Citrix Cloud Administration
The 10 top-paying certifications to target in 2024 are:
- Certified Information Systems Security Professional® (CISSP)
- AWS Certified Solutions Architect
- Google Certified Professional Cloud Architect
- Big Data Certification
- Data Science Certification
- Certified In Risk And Information Systems Control (CRISC)
- Certified Information Security Manager(CISM)
- Project Management Professional (PMP)® Certification
- Certified Ethical Hacker (CEH)
- Certified Scrum Master (CSM)
Conclusion
In Conclusion, Setting up a fault-tolerant Apache Kafka cluster needs careful planning, configuration, and maintenance. This guide's steps will prepare your Kafka cluster for broker failures. It will ensure data integrity and high availability for your streaming apps.
The setup, from cluster design to testing, must be robust. It must be reliable. Every aspect of it contributes to a strong Kafka environment. You can build a fault-tolerant Kafka system for real-time data. Do this by implementing replication, configuring key parameters, and monitoring the cluster.
Contact Us :
Contact Us For More Information:
Visit :www.icertglobal.com Email : info@icertglobal.com
Read More
It's vital to set up a fault-tolerant Apache Kafka cluster. It ensures high availability, data integrity, and reliable message streaming. Kafka's distributed architecture supports fault tolerance. However, some configurations are needed to maximize the cluster's resilience. This guide will show you how to set up a fault-tolerant Kafka cluster. It will cover essential components and best practices for a robust streaming platform.
Apache Kafka is a distributed streaming platform. It has high throughput and is highly scalable. However, building a truly fault-tolerant Kafka cluster requires careful planning and implementation. Kafka achieves fault tolerance mainly through replication. Data is copied across many nodes (brokers) in the cluster. When a broker fails, Kafka shifts traffic to other nodes. This keeps message streaming going without data loss.
This guide gives a thorough overview of setting up a fault-tolerant Kafka cluster. It covers cluster design, broker configuration, data replication, monitoring, and maintenance.
Table Of Contents
- Cluster Planning and Design
- Installing and Configuring Kafka Brokers
- Configuring Fault Tolerance Parameters
- Implementing Monitoring and Alerts
- Regular Maintenance and Testing
- Conclusion
Cluster Planning and Design
- Before diving into the setup, proper planning and design of the Kafka cluster is crucial. This step is to decide on three things: the number of brokers, the data replication factors, and the partitioning strategies.
- Check the number of brokers. It affects a Kafka cluster's fault tolerance and data distribution. For fault tolerance, use at least three brokers. This allows for leader election and data replication. More brokers improve fault tolerance. But larger clusters are harder to manage.
- Set Up Zookeeper: Apache Kafka uses Zookeeper to manage its cluster and brokers. A Zookeeper ensemble needs at least three nodes to maintain quorum if any fail. Make sure Zookeeper nodes are installed on separate servers for improved reliability.
- Decide on Partitioning: In Kafka, topics are split into partitions. These are distributed across brokers. Proper partitioning improves fault tolerance and parallelism. Plan the number of partitions. Do it based on the expected message throughput and the need for parallel processing.
Installing and Configuring Kafka Brokers
After the cluster design is done, install and configure the Kafka brokers on the servers. Proper configuration lets each broker handle traffic efficiently. It also helps with fault tolerance.
- Install Kafka: Download and install Apache Kafka on each broker server. Extract the package. Then, configure the server.properties file to set up broker-specific parameters.
- Set Broker IDs and Log Directories: Each Kafka broker must have a unique ID in the server.properties file. Set up the log directory path (log.dirs) for storing data. The log directory must be on a reliable, preferably RAID disk. This is to prevent data loss from hardware failure.
- Enable Broker Intercommunication: Configure listeners and advertised listeners for broker communication. This step is critical for multi-broker clusters. It ensures that brokers and clients can communicate properly.
- Set up Data Replication: In Kafka, the replication factor is how many copies of data are in the cluster. Set a replication factor of at least 3 for fault tolerance. For example, in the server.properties file, set default.replication.factor=3. It replicates topic partitions across three brokers.
Configuring Fault Tolerance Parameters
Kafka provides several configuration parameters to fine-tune fault tolerance and data consistency. Adjusting these parameters helps achieve an optimal balance between performance and reliability.
- Replication Factor: Ensure that each topic has an appropriate replication factor. A higher replication factor improves fault tolerance. It keeps more copies of data across the cluster. The recommended minimum is 3 to withstand multiple broker failures.
- Min In-Sync Replicas: The min.insync.replicas setting is the minimum number of replicas that must confirm a write for it to be successful. Set this to a value less than the replication factor but at least 2. It ensures that data is written to more than one replica for redundancy.
- Unclean Leader Election: In the server.properties file, set unclean.leader.election.enable to false. This will prevent a replica that hasn't caught up with the leader from becoming the new leader. This setting allows only fully synchronized replicas to be elected. It protects data integrity if brokers fail.
Implementing Monitoring and Alerts
Continuous monitoring of the Kafka cluster is essential to maintain fault tolerance. Monitoring tools help detect potential failures early and ensure smooth cluster operation.
- Set up Kafka monitoring tools. Use Kafka Manager, Confluent Control Center, or open-source tools like Prometheus and Grafana. These can check broker health, partition status, and consumer lag.
- Enable JMX Metrics: Kafka brokers expose JMX (Java Management Extensions) metrics. They show detailed information on broker performance, replication status, and consumer group health. Configure a JMX exporter to collect these metrics for real-time monitoring.
- Configure Alerts: Set up alerts for critical events, like broker failures and high consumer lag. Also, check for under-replicated partitions. Alerts help the operations team respond quickly to issues. This minimizes downtime and prevents data loss.
Regular Maintenance and Testing
Fault tolerance is not a one-time setup. It needs ongoing maintenance and testing. This will ensure the cluster is robust in various conditions.
- Back up the Kafka config files, Zookeeper data, and metadata. Do this regularly. This will help you recover quickly from failures. Consider using tools like Kafka MirrorMaker. It can replicate data to another cluster for disaster recovery.
- Test Failover Scenarios: Periodically test the cluster's fault tolerance. Simulate broker failures and watch the system's response. Ensure leader elections occur correctly, and data replication resumes seamlessly without data loss.
- Upgrade and Patch Management: Keep Kafka and Zookeeper updated with the latest patches. Use the latest versions. New releases often include critical security fixes and performance boosts. They make the cluster more resilient.
How to obtain Apache Kafka Certification?
We are an Education Technology company providing certification training courses to accelerate careers of working professionals worldwide. We impart training through instructor-led classroom workshops, instructor-led live virtual training sessions, and self-paced e-learning courses.
We have successfully conducted training sessions in 108 countries across the globe and enabled thousands of working professionals to enhance the scope of their careers.
Our enterprise training portfolio includes in-demand and globally recognized certification training courses in Project Management, Quality Management, Business Analysis, IT Service Management, Agile and Scrum, Cyber Security, Data Science, and Emerging Technologies. Download our Enterprise Training Catalog from https://www.icertglobal.com/corporate-training-for-enterprises.php and https://www.icertglobal.com/index.php
Popular Courses include:
- Project Management: PMP, CAPM ,PMI RMP
- Quality Management: Six Sigma Black Belt ,Lean Six Sigma Green Belt, Lean Management, Minitab,CMMI
- Business Analysis: CBAP, CCBA, ECBA
- Agile Training: PMI-ACP , CSM , CSPO
- Scrum Training: CSM
- DevOps
- Program Management: PgMP
- Cloud Technology: Exin Cloud Computing
- Citrix Client Adminisration: Citrix Cloud Administration
The 10 top-paying certifications to target in 2024 are:
- Certified Information Systems Security Professional® (CISSP)
- AWS Certified Solutions Architect
- Google Certified Professional Cloud Architect
- Big Data Certification
- Data Science Certification
- Certified In Risk And Information Systems Control (CRISC)
- Certified Information Security Manager(CISM)
- Project Management Professional (PMP)® Certification
- Certified Ethical Hacker (CEH)
- Certified Scrum Master (CSM)
Conclusion
In Conclusion, Setting up a fault-tolerant Apache Kafka cluster needs careful planning, configuration, and maintenance. This guide's steps will prepare your Kafka cluster for broker failures. It will ensure data integrity and high availability for your streaming apps.
The setup, from cluster design to testing, must be robust. It must be reliable. Every aspect of it contributes to a strong Kafka environment. You can build a fault-tolerant Kafka system for real-time data. Do this by implementing replication, configuring key parameters, and monitoring the cluster.
Contact Us :
Contact Us For More Information:
Visit :www.icertglobal.com Email : info@icertglobal.com
Data Science with R: Real-World Applications & Trends (2024)
In 2024, data science continues to evolve. R is still a top data science tool. R is known for its stats skills and open-source nature. It is now popular for data analysis, visualization, and machine learning. R is widely used across industries to drive innovation. It handles huge datasets and builds predictive models to solve tough problems. This article explores R's real-world applications in data science in 2024. It examines its impact across various sectors.
Table Of Contents
- R in Healthcare: Predictive Analytics and Disease Prevention
- R in Finance: Risk Management and Fraud Detection
- R in Marketing: Customer Segmentation and Sentiment Analysis
- R in Environmental Science: Climate Modeling and Resource Management
- R in Retail: Demand Forecasting and Inventory Management
- Conclusion
R in Healthcare: Predictive Analytics and Disease Prevention
Healthcare is a data-rich industry. R is key to turning that data into insights. Predictive analytics using R is helping healthcare providers. It improves patient outcomes, reduces costs, and boosts efficiency.
- R is used to create models that predict diseases like diabetes, heart disease, and cancer. By analyzing patient histories and genetic data, these models enable early interventions.
- Personalized Medicine: R lets healthcare pros analyze large genetic and medical datasets. They can then create personalized treatment plans for patients.
- Drug Development: In pharma research, R helps with clinical trials. It analyzes data, optimizes dosages, and predicts patient responses. This speeds up and improves drug development.
R in Finance: Risk Management and Fraud Detection
The finance industry is using R to improve risk management and find fraud. In 2024, R is well-known for financial modeling, algorithmic trading, and credit scoring.
- Risk Management: R helps financial firms manage risks. It is used for portfolio optimization, VaR calculations, and stress tests. R's statistical models help firms forecast market risks. They can then use strong strategies to reduce those risks.
- Fraud Detection: Financial institutions employ R for anomaly detection to identify fraudulent transactions. R uses machine learning on large transaction datasets. It helps flag suspicious activities in real-time.
- Algorithmic Trading: In algorithmic trading, R is used for three tasks. They are: back-testing trading strategies, analyzing trends, and predicting asset prices.
R in Marketing: Customer Segmentation and Sentiment Analysis
Data-driven marketing is now vital for businesses. R is key to gaining insights from customer data. In 2024, marketing teams use R for advanced customer segmentation and sentiment analysis. They also use it for predictive modeling.
- Customer Segmentation: R helps marketers segment customers by demographics, behavior, and purchase history. It lets businesses make targeted marketing campaigns. These boost customer engagement and retention.
- Sentiment Analysis: R's NLP can analyze customer feedback, reviews, and social media posts. By identifying sentiments, businesses can refine their products. They can find positive, negative, and neutral feelings.
- Churn Prediction: R helps businesses predict customer churn. It lets them take steps to retain valuable customers.
R in Environmental Science: Climate Modeling and Resource Management
As concerns about the environment grow in 2024, R is key. It analyzes data for climate change, resource management, and biodiversity efforts.
- Climate Change Projections: Scientists use R to analyze data on global temperatures, greenhouse gas emissions, and rising seas. These models help in forecasting climate change impacts and informing policy decisions.
- Resource Management: R optimizes the management of natural resources, like water and energy. Data from sensors and satellite images are analyzed in R to develop sustainable resource allocation strategies.
- Wildlife Conservation: In wildlife conservation, R is used to analyze population data, migration patterns, and habitat changes, enabling conservationists to make data-driven decisions for protecting endangered species.
R in Retail: Demand Forecasting and Inventory Management
Retailers are using R to improve efficiency, optimize inventory, and understand demand. In 2024, R is used in retail. It's for demand forecasting, price optimization, and supply chain management.
- Demand Forecasting: Retailers use R to analyze past sales data and external factors. These include seasonality, the economy, and promotions. They do this to forecast future demand. It ensures products are available when customers need them. This reduces stockouts and overstock.
- Price Optimization: R is used to build pricing models. They consider competitors' prices, demand elasticity, and market trends. This helps retailers set optimal prices that maximize profits while maintaining customer satisfaction.
- Inventory Management: R helps businesses predict inventory needs from sales trends. This lowers costs and cuts the risk of obsolete products.
How to obtain Data Science with R certification?
We are an Education Technology company providing certification training courses to accelerate careers of working professionals worldwide. We impart training through instructor-led classroom workshops, instructor-led live virtual training sessions, and self-paced e-learning courses.
We have successfully conducted training sessions in 108 countries across the globe and enabled thousands of working professionals to enhance the scope of their careers.
Our enterprise training portfolio includes in-demand and globally recognized certification training courses in Project Management, Quality Management, Business Analysis, IT Service Management, Agile and Scrum, Cyber Security, Data Science, and Emerging Technologies. Download our Enterprise Training Catalog from https://www.icertglobal.com/corporate-training-for-enterprises.php and https://www.icertglobal.com/index.php
Popular Courses include:
- Project Management: PMP, CAPM ,PMI RMP
- Quality Management: Six Sigma Black Belt ,Lean Six Sigma Green Belt, Lean Management, Minitab,CMMI
- Business Analysis: CBAP, CCBA, ECBA
- Agile Training: PMI-ACP , CSM , CSPO
- Scrum Training: CSM
- DevOps
- Program Management: PgMP
- Cloud Technology: Exin Cloud Computing
- Citrix Client Adminisration: Citrix Cloud Administration
The 10 top-paying certifications to target in 2024 are:
- Certified Information Systems Security Professional® (CISSP)
- AWS Certified Solutions Architect
- Google Certified Professional Cloud Architect
- Big Data Certification
- Data Science Certification
- Certified In Risk And Information Systems Control (CRISC)
- Certified Information Security Manager(CISM)
- Project Management Professional (PMP)® Certification
- Certified Ethical Hacker (CEH)
- Certified Scrum Master (CSM)
Conclusion
In 2024, R's use in data science is broad and impactful across many industries. R is a versatile tool for solving real-world problems. It is used in many fields. These include healthcare, finance, marketing, and environmental science. Its strong statistical skills and machine learning libraries are vital. So are its visualization tools. They are key for data-driven decision-making. As industries embrace data science, R's relevance will grow. It will be a crucial skill for data scientists and analysts. R is key to success in today's data-driven world. It can unlock many opportunities for both new and seasoned data scientists.
Read More
In 2024, data science continues to evolve. R is still a top data science tool. R is known for its stats skills and open-source nature. It is now popular for data analysis, visualization, and machine learning. R is widely used across industries to drive innovation. It handles huge datasets and builds predictive models to solve tough problems. This article explores R's real-world applications in data science in 2024. It examines its impact across various sectors.
Table Of Contents
- R in Healthcare: Predictive Analytics and Disease Prevention
- R in Finance: Risk Management and Fraud Detection
- R in Marketing: Customer Segmentation and Sentiment Analysis
- R in Environmental Science: Climate Modeling and Resource Management
- R in Retail: Demand Forecasting and Inventory Management
- Conclusion
R in Healthcare: Predictive Analytics and Disease Prevention
Healthcare is a data-rich industry. R is key to turning that data into insights. Predictive analytics using R is helping healthcare providers. It improves patient outcomes, reduces costs, and boosts efficiency.
- R is used to create models that predict diseases like diabetes, heart disease, and cancer. By analyzing patient histories and genetic data, these models enable early interventions.
- Personalized Medicine: R lets healthcare pros analyze large genetic and medical datasets. They can then create personalized treatment plans for patients.
- Drug Development: In pharma research, R helps with clinical trials. It analyzes data, optimizes dosages, and predicts patient responses. This speeds up and improves drug development.
R in Finance: Risk Management and Fraud Detection
The finance industry is using R to improve risk management and find fraud. In 2024, R is well-known for financial modeling, algorithmic trading, and credit scoring.
- Risk Management: R helps financial firms manage risks. It is used for portfolio optimization, VaR calculations, and stress tests. R's statistical models help firms forecast market risks. They can then use strong strategies to reduce those risks.
- Fraud Detection: Financial institutions employ R for anomaly detection to identify fraudulent transactions. R uses machine learning on large transaction datasets. It helps flag suspicious activities in real-time.
- Algorithmic Trading: In algorithmic trading, R is used for three tasks. They are: back-testing trading strategies, analyzing trends, and predicting asset prices.
R in Marketing: Customer Segmentation and Sentiment Analysis
Data-driven marketing is now vital for businesses. R is key to gaining insights from customer data. In 2024, marketing teams use R for advanced customer segmentation and sentiment analysis. They also use it for predictive modeling.
- Customer Segmentation: R helps marketers segment customers by demographics, behavior, and purchase history. It lets businesses make targeted marketing campaigns. These boost customer engagement and retention.
- Sentiment Analysis: R's NLP can analyze customer feedback, reviews, and social media posts. By identifying sentiments, businesses can refine their products. They can find positive, negative, and neutral feelings.
- Churn Prediction: R helps businesses predict customer churn. It lets them take steps to retain valuable customers.
R in Environmental Science: Climate Modeling and Resource Management
As concerns about the environment grow in 2024, R is key. It analyzes data for climate change, resource management, and biodiversity efforts.
- Climate Change Projections: Scientists use R to analyze data on global temperatures, greenhouse gas emissions, and rising seas. These models help in forecasting climate change impacts and informing policy decisions.
- Resource Management: R optimizes the management of natural resources, like water and energy. Data from sensors and satellite images are analyzed in R to develop sustainable resource allocation strategies.
- Wildlife Conservation: In wildlife conservation, R is used to analyze population data, migration patterns, and habitat changes, enabling conservationists to make data-driven decisions for protecting endangered species.
R in Retail: Demand Forecasting and Inventory Management
Retailers are using R to improve efficiency, optimize inventory, and understand demand. In 2024, R is used in retail. It's for demand forecasting, price optimization, and supply chain management.
- Demand Forecasting: Retailers use R to analyze past sales data and external factors. These include seasonality, the economy, and promotions. They do this to forecast future demand. It ensures products are available when customers need them. This reduces stockouts and overstock.
- Price Optimization: R is used to build pricing models. They consider competitors' prices, demand elasticity, and market trends. This helps retailers set optimal prices that maximize profits while maintaining customer satisfaction.
- Inventory Management: R helps businesses predict inventory needs from sales trends. This lowers costs and cuts the risk of obsolete products.
How to obtain Data Science with R certification?
We are an Education Technology company providing certification training courses to accelerate careers of working professionals worldwide. We impart training through instructor-led classroom workshops, instructor-led live virtual training sessions, and self-paced e-learning courses.
We have successfully conducted training sessions in 108 countries across the globe and enabled thousands of working professionals to enhance the scope of their careers.
Our enterprise training portfolio includes in-demand and globally recognized certification training courses in Project Management, Quality Management, Business Analysis, IT Service Management, Agile and Scrum, Cyber Security, Data Science, and Emerging Technologies. Download our Enterprise Training Catalog from https://www.icertglobal.com/corporate-training-for-enterprises.php and https://www.icertglobal.com/index.php
Popular Courses include:
- Project Management: PMP, CAPM ,PMI RMP
- Quality Management: Six Sigma Black Belt ,Lean Six Sigma Green Belt, Lean Management, Minitab,CMMI
- Business Analysis: CBAP, CCBA, ECBA
- Agile Training: PMI-ACP , CSM , CSPO
- Scrum Training: CSM
- DevOps
- Program Management: PgMP
- Cloud Technology: Exin Cloud Computing
- Citrix Client Adminisration: Citrix Cloud Administration
The 10 top-paying certifications to target in 2024 are:
- Certified Information Systems Security Professional® (CISSP)
- AWS Certified Solutions Architect
- Google Certified Professional Cloud Architect
- Big Data Certification
- Data Science Certification
- Certified In Risk And Information Systems Control (CRISC)
- Certified Information Security Manager(CISM)
- Project Management Professional (PMP)® Certification
- Certified Ethical Hacker (CEH)
- Certified Scrum Master (CSM)
Conclusion
In 2024, R's use in data science is broad and impactful across many industries. R is a versatile tool for solving real-world problems. It is used in many fields. These include healthcare, finance, marketing, and environmental science. Its strong statistical skills and machine learning libraries are vital. So are its visualization tools. They are key for data-driven decision-making. As industries embrace data science, R's relevance will grow. It will be a crucial skill for data scientists and analysts. R is key to success in today's data-driven world. It can unlock many opportunities for both new and seasoned data scientists.

Quantum Computings Impact on Data Science and Business!
Quantum computing has emerged as a revolutionary technology. It could transform fields like data science and business intelligence. Quantum computing can process huge amounts of data at amazing speed. It will change how we analyze and use data for decision-making. This article explores quantum computing's impact on data science and business intelligence. It highlights the pros and cons of using this tech in current data analytics systems.
Quantum Computing: A Game-Changer for Data Science
What is Quantum Computing?
Quantum computing uses quantum mechanics to do complex calculations. It is much faster than traditional computers. Quantum computing relies on quantum bits, or qubits. They can exist in a state of superposition and entanglement. This enables a huge boost in computing power.
How Does Quantum Computing Impact Data Science?
Quantum computing could greatly improve data processing and machine learning. Quantum algorithms and information theory can help data scientists. They can find deep insights in massive datasets. These insights were previously unimaginable. Quantum superposition and interference enable parallel processing. This leads to faster, more accurate results.
Quantum computing will revolutionize data science. It will allow analysis of vast datasets at unmatched speeds. It will do this by greatly increasing computing power. This advanced technology will solve complex problems. These include optimization and simulation tasks that classical computers can't tackle. As quantum computing evolves, it will unlock new possibilities. It will change how data scientists solve tough problems.
Business Intelligence: Leveraging Quantum Computing for Strategic Insights
Enhancing Data Analytics with Quantum Computing. Business intelligence uses data insights to drive decisions and success. Quantum computing could enable new levels of analysis and prediction. It could do this with advanced analytics and probabilistic modeling. Quantum annealing and quantum machine learning can help businesses. They can improve forecasting and give a competitive edge in the market.
Quantum computing will revolutionize data analytics. It will do this by providing unmatched processing power and speed. Quantum computing can do complex calculations much faster than classical computers. It can quickly analyze large datasets. It can find insights that were once impossible to reach. As this technology advances, it could transform industries. It can improve predictions, optimize algorithms, and spark innovation in data-driven decisions. Quantum Computing Applications in Business Quantum computing has vast uses in business intelligence. It can help with data visualization and statistical analysis. Quantum algorithms can analyze data. They can find hidden patterns and trends. This helps organizations make decisions based on real-time insights. Quantum computing boosts data processing. It enables better data mining and integration with BI tools.
Quantum computing will revolutionize business. It will solve complex problems that classical computers can't. Quantum computing can transform many fields. Its applications are vast. It can optimize supply chains, enhance financial models, and accelerate drug discovery. It can also improve cybersecurity. As businesses explore these options, quantum computing could give a big edge in a data-driven world.
Future Development of Quantum Computing in Data Science and BI
The Quantum Computing Revolution. As quantum computing evolves, it holds promise for data science and business intelligence. Quantum technology will revolutionize data analysis. It will improve data processing speed, computational complexity, and quantum error correction. Researchers are exploring quantum cryptography and networks. They aim to boost data security and privacy in the digital age. Challenges and Opportunities Quantum computing has great potential. But, it poses challenges for data scientists and BI professionals. Quantum algorithms are complex. Quantum processors are scarce. These factors hinder widespread adoption.
However, research and investment in quantum computing are driving rapid advancements. They are opening up new possibilities for data-driven insights and innovation.
How to obtain Data Science and Business Intelligence certification?
We are an Education Technology company providing certification training courses to accelerate careers of working professionals worldwide. We impart training through instructor-led classroom workshops, instructor-led live virtual training sessions, and self-paced e-learning courses.
We have successfully conducted training sessions in 108 countries across the globe and enabled thousands of working professionals to enhance the scope of their careers.
Our enterprise training portfolio includes in-demand and globally recognized certification training courses in Project Management, Quality Management, Business Analysis, IT Service Management, Agile and Scrum, Cyber Security, Data Science, and Emerging Technologies. Download our Enterprise Training Catalog from https://www.icertglobal.com/corporate-training-for-enterprises.php and https://www.icertglobal.com/index.php
Popular Courses include:
-
Project Management: PMP, CAPM ,PMI RMP
-
Quality Management: Six Sigma Black Belt ,Lean Six Sigma Green Belt, Lean Management, Minitab,CMMI
-
Business Analysis: CBAP, CCBA, ECBA
-
Agile Training: PMI-ACP , CSM , CSPO
-
Scrum Training: CSM
-
DevOps
-
Program Management: PgMP
-
Cloud Technology: Exin Cloud Computing
-
Citrix Client Adminisration: Citrix Cloud Administration
The 10 top-paying certifications to target in 2024 are:
Conclusion
Quantum computing will have a huge impact on data science and business intelligence. Organizations can greatly improve data analysis and predictions. They can do this by using quantum mechanics and quantum algorithms. This will improve their decision-making. As quantum computing advances, data scientists and BI pros must explore its potential.
Contact Us For More Information:
Visit : www.icertglobal.com Email : info@icertglobal.com
Read More
Quantum computing has emerged as a revolutionary technology. It could transform fields like data science and business intelligence. Quantum computing can process huge amounts of data at amazing speed. It will change how we analyze and use data for decision-making. This article explores quantum computing's impact on data science and business intelligence. It highlights the pros and cons of using this tech in current data analytics systems.
Quantum Computing: A Game-Changer for Data Science
What is Quantum Computing?
Quantum computing uses quantum mechanics to do complex calculations. It is much faster than traditional computers. Quantum computing relies on quantum bits, or qubits. They can exist in a state of superposition and entanglement. This enables a huge boost in computing power.
How Does Quantum Computing Impact Data Science?
Quantum computing could greatly improve data processing and machine learning. Quantum algorithms and information theory can help data scientists. They can find deep insights in massive datasets. These insights were previously unimaginable. Quantum superposition and interference enable parallel processing. This leads to faster, more accurate results.
Quantum computing will revolutionize data science. It will allow analysis of vast datasets at unmatched speeds. It will do this by greatly increasing computing power. This advanced technology will solve complex problems. These include optimization and simulation tasks that classical computers can't tackle. As quantum computing evolves, it will unlock new possibilities. It will change how data scientists solve tough problems.
Business Intelligence: Leveraging Quantum Computing for Strategic Insights
Enhancing Data Analytics with Quantum Computing. Business intelligence uses data insights to drive decisions and success. Quantum computing could enable new levels of analysis and prediction. It could do this with advanced analytics and probabilistic modeling. Quantum annealing and quantum machine learning can help businesses. They can improve forecasting and give a competitive edge in the market.
Quantum computing will revolutionize data analytics. It will do this by providing unmatched processing power and speed. Quantum computing can do complex calculations much faster than classical computers. It can quickly analyze large datasets. It can find insights that were once impossible to reach. As this technology advances, it could transform industries. It can improve predictions, optimize algorithms, and spark innovation in data-driven decisions. Quantum Computing Applications in Business Quantum computing has vast uses in business intelligence. It can help with data visualization and statistical analysis. Quantum algorithms can analyze data. They can find hidden patterns and trends. This helps organizations make decisions based on real-time insights. Quantum computing boosts data processing. It enables better data mining and integration with BI tools.
Quantum computing will revolutionize business. It will solve complex problems that classical computers can't. Quantum computing can transform many fields. Its applications are vast. It can optimize supply chains, enhance financial models, and accelerate drug discovery. It can also improve cybersecurity. As businesses explore these options, quantum computing could give a big edge in a data-driven world.
Future Development of Quantum Computing in Data Science and BI
The Quantum Computing Revolution. As quantum computing evolves, it holds promise for data science and business intelligence. Quantum technology will revolutionize data analysis. It will improve data processing speed, computational complexity, and quantum error correction. Researchers are exploring quantum cryptography and networks. They aim to boost data security and privacy in the digital age. Challenges and Opportunities Quantum computing has great potential. But, it poses challenges for data scientists and BI professionals. Quantum algorithms are complex. Quantum processors are scarce. These factors hinder widespread adoption.
However, research and investment in quantum computing are driving rapid advancements. They are opening up new possibilities for data-driven insights and innovation.
How to obtain Data Science and Business Intelligence certification?
We are an Education Technology company providing certification training courses to accelerate careers of working professionals worldwide. We impart training through instructor-led classroom workshops, instructor-led live virtual training sessions, and self-paced e-learning courses.
We have successfully conducted training sessions in 108 countries across the globe and enabled thousands of working professionals to enhance the scope of their careers.
Our enterprise training portfolio includes in-demand and globally recognized certification training courses in Project Management, Quality Management, Business Analysis, IT Service Management, Agile and Scrum, Cyber Security, Data Science, and Emerging Technologies. Download our Enterprise Training Catalog from https://www.icertglobal.com/corporate-training-for-enterprises.php and https://www.icertglobal.com/index.php
Popular Courses include:
-
Project Management: PMP, CAPM ,PMI RMP
-
Quality Management: Six Sigma Black Belt ,Lean Six Sigma Green Belt, Lean Management, Minitab,CMMI
-
Business Analysis: CBAP, CCBA, ECBA
-
Agile Training: PMI-ACP , CSM , CSPO
-
Scrum Training: CSM
-
DevOps
-
Program Management: PgMP
-
Cloud Technology: Exin Cloud Computing
-
Citrix Client Adminisration: Citrix Cloud Administration
The 10 top-paying certifications to target in 2024 are:
Conclusion
Quantum computing will have a huge impact on data science and business intelligence. Organizations can greatly improve data analysis and predictions. They can do this by using quantum mechanics and quantum algorithms. This will improve their decision-making. As quantum computing advances, data scientists and BI pros must explore its potential.
Contact Us For More Information:
Visit : www.icertglobal.com Email : info@icertglobal.com

Leveraging R for Reproducible Research in Data Science!
Are you looking to enhance the reproducibility of your research in the field of data science? Look no further than R. It's a powerful programming language. It's widely used for statistical computing and graphics. In this article, we will explore how you can leverage R for reproducible research in data science, covering topics such as data manipulation, visualization, statistical analysis, machine learning, and more
Why Choose R for Research?
R is a popular choice among data scientists and researchers for its versatility and robust capabilities. With a vast collection of packages and libraries, R provides a comprehensive set of tools for data analysis, visualization, and modeling. Its syntax is intuitive and easy to learn, making it suitable for both beginners and experienced programmers. R is open-source. So, you can access a vibrant community of users. They contribute to its development and improve its functionality.
R Programming for Data Manipulation and Analysis
One of the key strengths of R is its ability to handle data manipulation tasks efficiently. With packages like dplyr and tidyr, you can clean, transform, and reshape your data with ease. R has many functions to streamline data processing. Use them to filter out missing values, merge datasets, or create new variables. By using the tidyverse approach, you can ensure that your data is structured in a consistent and tidy format, making it easier to analyze and visualize.
R programming excels at data manipulation and analysis. It has a powerful toolkit for complex data tasks. Packages like `dplyr` and `tidyr` let users easily clean, transform, and analyze datasets. This ensures data integrity and accuracy. R's rich libraries simplify reshaping, aggregating, and filtering data. They boost productivity.
Also, R's integration with statistical methods allows for in-depth analysis. It is invaluable to data scientists and analysts seeking insights from their data.
Data Visualization in R
Visualization is key in data science. It helps you share insights and find hidden patterns in your data. R has many plotting libraries, like ggplot2 and plotly. They let you create a wide range of static and interactive visualizations. R has the tools to create bar charts, scatter plots, heatmaps, and interactive dashboards. Use them to showcase your findings in a visually compelling way. By leveraging the power of ggplot2, you can customize every aspect of your plots, from colors and themes to annotations and legends.
R has powerful tools for data visualization. They can turn complex datasets into interactive, insightful visuals. R empowers data scientists to create visual stories. Its packages, like ggplot2, provide a framework for making charts. These can be simple scatter plots or complex, multi-layered ones. Also, tools like Plotly and Shiny create interactive dashboards. They boost user engagement and data exploration.
These visualization techniques will help you. They will let you communicate your findings, reveal trends, and drive data-driven decisions. R has great tools for visualizing data. They help you present it well, whether you're exploring big data or visualizing time series data.
Statistical Analysis and Modeling with R
In addition to data manipulation and visualization, R excels in the realm of statistical analysis and modeling. Packages like stats and caret let you run many tests. You can do statistical tests, regression analyses, and machine learning. R has the tools to support your statistical workflows. Use it to conduct hypothesis tests, fit a linear regression model, or build a random forest classifier. By harnessing caret, you can easily train and test machine learning models. It uses cross-validation and grid search to optimize their performance.
Reproducible Reporting with RMarkdown
One of the key advantages of R is its support for reproducible research practices. With RMarkdown, you can create dynamic documents that combine code, text, and output in a single file. This enables you to generate reports, presentations, and manuscripts that are fully reproducible, ensuring that your research can be shared, reviewed, and reproduced by others. By using R code chunks and markdown, you can combine your analysis, results, and interpretations into a clear and reproducible narrative.
How to obtain Data Science with R Programming certification?
We are an Education Technology company providing certification training courses to accelerate careers of working professionals worldwide. We impart training through instructor-led classroom workshops, instructor-led live virtual training sessions, and self-paced e-learning courses.
We have successfully conducted training sessions in 108 countries across the globe and enabled thousands of working professionals to enhance the scope of their careers.
Our enterprise training portfolio includes in-demand and globally recognized certification training courses in Project Management, Quality Management, Business Analysis, IT Service Management, Agile and Scrum, Cyber Security, Data Science, and Emerging Technologies. Download our Enterprise Training Catalog from https://www.icertglobal.com/corporate-training-for-enterprises.php and https://www.icertglobal.com/index.php
Popular Courses include:
-
Project Management: PMP, CAPM ,PMI RMP
-
Quality Management: Six Sigma Black Belt ,Lean Six Sigma Green Belt, Lean Management, Minitab,CMMI
-
Business Analysis: CBAP, CCBA, ECBA
-
Agile Training: PMI-ACP , CSM , CSPO
-
Scrum Training: CSM
-
DevOps
-
Program Management: PgMP
-
Cloud Technology: Exin Cloud Computing
-
Citrix Client Adminisration: Citrix Cloud Administration
The 10 top-paying certifications to target in 2024 are:
Conclusion
In conclusion, R is a powerful tool for reproducible research in data science. It has many features to support your analytical workflows. Using R for data work can help your research. It can improve reproducibility and help communicate your findings. R can manipulate, visualize, analyze, and report data. R has the tools to boost your data science work, whether you're a beginner or an expert.
Contact Us For More Information:
Visit : www.icertglobal.com Email : info@icertglobal.com
Read More
Are you looking to enhance the reproducibility of your research in the field of data science? Look no further than R. It's a powerful programming language. It's widely used for statistical computing and graphics. In this article, we will explore how you can leverage R for reproducible research in data science, covering topics such as data manipulation, visualization, statistical analysis, machine learning, and more
Why Choose R for Research?
R is a popular choice among data scientists and researchers for its versatility and robust capabilities. With a vast collection of packages and libraries, R provides a comprehensive set of tools for data analysis, visualization, and modeling. Its syntax is intuitive and easy to learn, making it suitable for both beginners and experienced programmers. R is open-source. So, you can access a vibrant community of users. They contribute to its development and improve its functionality.
R Programming for Data Manipulation and Analysis
One of the key strengths of R is its ability to handle data manipulation tasks efficiently. With packages like dplyr and tidyr, you can clean, transform, and reshape your data with ease. R has many functions to streamline data processing. Use them to filter out missing values, merge datasets, or create new variables. By using the tidyverse approach, you can ensure that your data is structured in a consistent and tidy format, making it easier to analyze and visualize.
R programming excels at data manipulation and analysis. It has a powerful toolkit for complex data tasks. Packages like `dplyr` and `tidyr` let users easily clean, transform, and analyze datasets. This ensures data integrity and accuracy. R's rich libraries simplify reshaping, aggregating, and filtering data. They boost productivity.
Also, R's integration with statistical methods allows for in-depth analysis. It is invaluable to data scientists and analysts seeking insights from their data.
Data Visualization in R
Visualization is key in data science. It helps you share insights and find hidden patterns in your data. R has many plotting libraries, like ggplot2 and plotly. They let you create a wide range of static and interactive visualizations. R has the tools to create bar charts, scatter plots, heatmaps, and interactive dashboards. Use them to showcase your findings in a visually compelling way. By leveraging the power of ggplot2, you can customize every aspect of your plots, from colors and themes to annotations and legends.
R has powerful tools for data visualization. They can turn complex datasets into interactive, insightful visuals. R empowers data scientists to create visual stories. Its packages, like ggplot2, provide a framework for making charts. These can be simple scatter plots or complex, multi-layered ones. Also, tools like Plotly and Shiny create interactive dashboards. They boost user engagement and data exploration.
These visualization techniques will help you. They will let you communicate your findings, reveal trends, and drive data-driven decisions. R has great tools for visualizing data. They help you present it well, whether you're exploring big data or visualizing time series data.
Statistical Analysis and Modeling with R
In addition to data manipulation and visualization, R excels in the realm of statistical analysis and modeling. Packages like stats and caret let you run many tests. You can do statistical tests, regression analyses, and machine learning. R has the tools to support your statistical workflows. Use it to conduct hypothesis tests, fit a linear regression model, or build a random forest classifier. By harnessing caret, you can easily train and test machine learning models. It uses cross-validation and grid search to optimize their performance.
Reproducible Reporting with RMarkdown
One of the key advantages of R is its support for reproducible research practices. With RMarkdown, you can create dynamic documents that combine code, text, and output in a single file. This enables you to generate reports, presentations, and manuscripts that are fully reproducible, ensuring that your research can be shared, reviewed, and reproduced by others. By using R code chunks and markdown, you can combine your analysis, results, and interpretations into a clear and reproducible narrative.
How to obtain Data Science with R Programming certification?
We are an Education Technology company providing certification training courses to accelerate careers of working professionals worldwide. We impart training through instructor-led classroom workshops, instructor-led live virtual training sessions, and self-paced e-learning courses.
We have successfully conducted training sessions in 108 countries across the globe and enabled thousands of working professionals to enhance the scope of their careers.
Our enterprise training portfolio includes in-demand and globally recognized certification training courses in Project Management, Quality Management, Business Analysis, IT Service Management, Agile and Scrum, Cyber Security, Data Science, and Emerging Technologies. Download our Enterprise Training Catalog from https://www.icertglobal.com/corporate-training-for-enterprises.php and https://www.icertglobal.com/index.php
Popular Courses include:
-
Project Management: PMP, CAPM ,PMI RMP
-
Quality Management: Six Sigma Black Belt ,Lean Six Sigma Green Belt, Lean Management, Minitab,CMMI
-
Business Analysis: CBAP, CCBA, ECBA
-
Agile Training: PMI-ACP , CSM , CSPO
-
Scrum Training: CSM
-
DevOps
-
Program Management: PgMP
-
Cloud Technology: Exin Cloud Computing
-
Citrix Client Adminisration: Citrix Cloud Administration
The 10 top-paying certifications to target in 2024 are:
Conclusion
In conclusion, R is a powerful tool for reproducible research in data science. It has many features to support your analytical workflows. Using R for data work can help your research. It can improve reproducibility and help communicate your findings. R can manipulate, visualize, analyze, and report data. R has the tools to boost your data science work, whether you're a beginner or an expert.
Contact Us For More Information:
Visit : www.icertglobal.com Email : info@icertglobal.com
Best Practices for Securing Apache Kafka Streaming Data.
Apache Kafka is a distributed streaming platform. Its scalability, reliability, and real-time data processing are well known. As organizations rely on Kafka for their data pipelines, securing it is crucial. We must protect against data breaches, unauthorized access, and service disruptions. This article covers the best ways to secure Apache Kafka. It aims to make your Kafka deployment robust, resilient, and secure.
Table Of Contents
- Install authentication and authorization.
- Encrypt data in transit and at rest.
- A team regularly updates Kafka with new patches.
- Track and audit Kafka activities.
- Secure Kafka configuration and network.
- Conclusion
Install authentication and authorization.
Authentication and authorization are foundational elements of Kafka security. These practices ensure that only valid users and apps can access your Kafka cluster. They can only act based on their permissions.
- Authentication: Use Kerberos, SSL/TLS, or SASL to authenticate clients and brokers. Kerberos provides a strong security model but can be complex to configure. SSL/TLS is a simpler option. It encrypts communication between clients and brokers. SASL offers various mechanisms, including SCRAM and GSSAPI. SCRAM is the Salted Challenge Response Authentication Mechanism. GSSAPI is the Generic Security Services Application Programming Interface.
- Authorization: Kafka has a built-in ACL system for authorizing user actions. Define ACLs for topics, consumer groups, and cluster operations. They control which users or apps can produce, consume, or manage data. Conduct periodic checks and refresh access control lists. This ensures permissions follow the least privilege principle.
Encrypt data in transit and at rest.
Encryption is crucial for protecting sensitive data in Kafka. Encrypting data safeguards it from unauthorized access during transmission and on disk.
- Data In Transit: Use SSL/TLS to encrypt data sent between Kafka brokers and clients. This prevents eavesdropping and man-in-the-middle attacks. We update cryptographic codes regularly for secure data protection.
- Data At Rest: Encrypt Kafka log files. Use file system encryption or tools like HDFS. It adds security by protecting stored data from unauthorized access. This holds even if an attacker gets the disk.
A team regularly updates Kafka with new patches.
Keeping your Kafka installation up to date is essential for maintaining security. Regular updates and patches fix vulnerabilities and improve Kafka's security.
- Updates: Check Apache Kafka's release notes and security advisories for new versions. Test updates in a staging environment before deploying them to production. This will cut disruption.
- Patching: Apply security patches as soon as they are available. Track Kafka dependencies for updates and apply patches as needed. This includes Java libraries and OSs. It will fix known vulnerabilities.
Track and audit Kafka activities.
Kafka activity tracking and audits uncover security breaches for swift action. Use strong monitoring and auditing to see your Kafka cluster's operations.
- Monitoring: Use JMX metrics, Prometheus, or Grafana to check Kafka's health and performance. Also, check its security. Set up alerts for abnormal activities. Watch for unexpected spikes in traffic or failed authentication attempts.
- Auditing: Enable Kafka’s audit logging to record access and modification activities. Examine audit logs for unauthorized access attempts and misconfigurations monthly. Integrate Kafka's audit logs with a central logging system. This will make it easier to analyze and correlate them with other security data.
Secure Kafka configuration and network.
It's vital to secure Kafka's configuration and network settings. This prevents unauthorized access and reduces attack risks.
- Configuration: Secure Kafka config files. Limit access permissions and avoid hardcoded sensitive info. Use secure storage solutions for credentials and configuration settings. Keep configuration files private and separate from version control repositories.
- Network: Use firewalls and VPNs to secure access to Kafka brokers. Use network segmentation to isolate Kafka clusters from other parts of your infrastructure. Also, ensure that brokers are not accessible from the public internet unless necessary.
How to obtain Apache Kafka certification?
We are an Education Technology company providing certification training courses to accelerate careers of working professionals worldwide. We impart training through instructor-led classroom workshops, instructor-led live virtual training sessions, and self-paced e-learning courses.
We have successfully conducted training sessions in 108 countries across the globe and enabled thousands of working professionals to enhance the scope of their careers.
Our enterprise training portfolio includes in-demand and globally recognized certification training courses in Project Management, Quality Management, Business Analysis, IT Service Management, Agile and Scrum, Cyber Security, Data Science, and Emerging Technologies. Download our Enterprise Training Catalog from https://www.icertglobal.com/corporate-training-for-enterprises.php and https://www.icertglobal.com/index.php
Popular Courses include:
- Project Management: PMP, CAPM ,PMI RMP
- Quality Management: Six Sigma Black Belt ,Lean Six Sigma Green Belt, Lean Management, Minitab,CMMI
- Business Analysis: CBAP, CCBA, ECBA
- Agile Training: PMI-ACP , CSM , CSPO
- Scrum Training: CSM
- DevOps
- Program Management: PgMP
- Cloud Technology: Exin Cloud Computing
- Citrix Client Adminisration: Citrix Cloud Administration
The 10 top-paying certifications to target in 2024 are:
- Certified Information Systems Security Professional® (CISSP)
- AWS Certified Solutions Architect
- Google Certified Professional Cloud Architect
- Big Data Certification
- Data Science Certification
- Certified In Risk And Information Systems Control (CRISC)
- Certified Information Security Manager(CISM)
- Project Management Professional (PMP)® Certification
- Certified Ethical Hacker (CEH)
- Certified Scrum Master (CSM)
Conclusion
In conclusion, securing Apache Kafka is complex. It requires:
- Implementing authentication and authorization.
- Encrypting data.
- Maintain software through timely revisions and security fixes.
- Monitoring and auditing activities.
- Securing configuration and network settings.
These best practices will help organizations protect their Kafka deployments. They will guard against security threats, ensure data integrity, and meet industry standards. As the data landscape evolves, stay updated on the latest security trends. Doing so will help you protect your Kafka infrastructure and keep it running well.
Contact Us :
Contact Us For More Information:
Visit :www.icertglobal.com Email : info@icertglobal.com
Read More
Apache Kafka is a distributed streaming platform. Its scalability, reliability, and real-time data processing are well known. As organizations rely on Kafka for their data pipelines, securing it is crucial. We must protect against data breaches, unauthorized access, and service disruptions. This article covers the best ways to secure Apache Kafka. It aims to make your Kafka deployment robust, resilient, and secure.
Table Of Contents
- Install authentication and authorization.
- Encrypt data in transit and at rest.
- A team regularly updates Kafka with new patches.
- Track and audit Kafka activities.
- Secure Kafka configuration and network.
- Conclusion
Install authentication and authorization.
Authentication and authorization are foundational elements of Kafka security. These practices ensure that only valid users and apps can access your Kafka cluster. They can only act based on their permissions.
- Authentication: Use Kerberos, SSL/TLS, or SASL to authenticate clients and brokers. Kerberos provides a strong security model but can be complex to configure. SSL/TLS is a simpler option. It encrypts communication between clients and brokers. SASL offers various mechanisms, including SCRAM and GSSAPI. SCRAM is the Salted Challenge Response Authentication Mechanism. GSSAPI is the Generic Security Services Application Programming Interface.
- Authorization: Kafka has a built-in ACL system for authorizing user actions. Define ACLs for topics, consumer groups, and cluster operations. They control which users or apps can produce, consume, or manage data. Conduct periodic checks and refresh access control lists. This ensures permissions follow the least privilege principle.
Encrypt data in transit and at rest.
Encryption is crucial for protecting sensitive data in Kafka. Encrypting data safeguards it from unauthorized access during transmission and on disk.
- Data In Transit: Use SSL/TLS to encrypt data sent between Kafka brokers and clients. This prevents eavesdropping and man-in-the-middle attacks. We update cryptographic codes regularly for secure data protection.
- Data At Rest: Encrypt Kafka log files. Use file system encryption or tools like HDFS. It adds security by protecting stored data from unauthorized access. This holds even if an attacker gets the disk.
A team regularly updates Kafka with new patches.
Keeping your Kafka installation up to date is essential for maintaining security. Regular updates and patches fix vulnerabilities and improve Kafka's security.
- Updates: Check Apache Kafka's release notes and security advisories for new versions. Test updates in a staging environment before deploying them to production. This will cut disruption.
- Patching: Apply security patches as soon as they are available. Track Kafka dependencies for updates and apply patches as needed. This includes Java libraries and OSs. It will fix known vulnerabilities.
Track and audit Kafka activities.
Kafka activity tracking and audits uncover security breaches for swift action. Use strong monitoring and auditing to see your Kafka cluster's operations.
- Monitoring: Use JMX metrics, Prometheus, or Grafana to check Kafka's health and performance. Also, check its security. Set up alerts for abnormal activities. Watch for unexpected spikes in traffic or failed authentication attempts.
- Auditing: Enable Kafka’s audit logging to record access and modification activities. Examine audit logs for unauthorized access attempts and misconfigurations monthly. Integrate Kafka's audit logs with a central logging system. This will make it easier to analyze and correlate them with other security data.
Secure Kafka configuration and network.
It's vital to secure Kafka's configuration and network settings. This prevents unauthorized access and reduces attack risks.
- Configuration: Secure Kafka config files. Limit access permissions and avoid hardcoded sensitive info. Use secure storage solutions for credentials and configuration settings. Keep configuration files private and separate from version control repositories.
- Network: Use firewalls and VPNs to secure access to Kafka brokers. Use network segmentation to isolate Kafka clusters from other parts of your infrastructure. Also, ensure that brokers are not accessible from the public internet unless necessary.
How to obtain Apache Kafka certification?
We are an Education Technology company providing certification training courses to accelerate careers of working professionals worldwide. We impart training through instructor-led classroom workshops, instructor-led live virtual training sessions, and self-paced e-learning courses.
We have successfully conducted training sessions in 108 countries across the globe and enabled thousands of working professionals to enhance the scope of their careers.
Our enterprise training portfolio includes in-demand and globally recognized certification training courses in Project Management, Quality Management, Business Analysis, IT Service Management, Agile and Scrum, Cyber Security, Data Science, and Emerging Technologies. Download our Enterprise Training Catalog from https://www.icertglobal.com/corporate-training-for-enterprises.php and https://www.icertglobal.com/index.php
Popular Courses include:
- Project Management: PMP, CAPM ,PMI RMP
- Quality Management: Six Sigma Black Belt ,Lean Six Sigma Green Belt, Lean Management, Minitab,CMMI
- Business Analysis: CBAP, CCBA, ECBA
- Agile Training: PMI-ACP , CSM , CSPO
- Scrum Training: CSM
- DevOps
- Program Management: PgMP
- Cloud Technology: Exin Cloud Computing
- Citrix Client Adminisration: Citrix Cloud Administration
The 10 top-paying certifications to target in 2024 are:
- Certified Information Systems Security Professional® (CISSP)
- AWS Certified Solutions Architect
- Google Certified Professional Cloud Architect
- Big Data Certification
- Data Science Certification
- Certified In Risk And Information Systems Control (CRISC)
- Certified Information Security Manager(CISM)
- Project Management Professional (PMP)® Certification
- Certified Ethical Hacker (CEH)
- Certified Scrum Master (CSM)
Conclusion
In conclusion, securing Apache Kafka is complex. It requires:
- Implementing authentication and authorization.
- Encrypting data.
- Maintain software through timely revisions and security fixes.
- Monitoring and auditing activities.
- Securing configuration and network settings.
These best practices will help organizations protect their Kafka deployments. They will guard against security threats, ensure data integrity, and meet industry standards. As the data landscape evolves, stay updated on the latest security trends. Doing so will help you protect your Kafka infrastructure and keep it running well.
Contact Us :
Contact Us For More Information:
Visit :www.icertglobal.com Email : info@icertglobal.com

Apache Spark and Scala for Efficient Graph Data Processing
Are you looking to harness the power of big data for graph processing? Look no further than Apache Spark and Scala! This article will explore powerful tools for graph processing. We'll cover data processing, analytics, machine learning, and real-time insights.
Apache Spark, with Scala, is a powerful framework for graph processing. It is efficient and scalable. With Spark's GraphX library, developers can use distributed computing. They can analyze and process large-scale graph data. Scala's functional programming makes Spark faster. It allows for concise, expressive code that simplifies complex graph computations and optimizations. The synergy between Spark and Scala is changing our approach to graph analytics. This includes social network analysis and complex recommendation systems.
Introduction to Apache Spark and Scala
Apache Spark is a distributed computing framework that provides an efficient way to process large sets of data. It is designed for scalability and performance, making it ideal for big data applications. Scala is a programming language. It integrates perfectly with Spark. It provides a powerful, expressive way to write code for data processing tasks.
Apache Spark is a powerful, open-source framework. It is for large-scale data processing. It enables fast, in-memory computing across distributed systems. Scala is a language built on the Java Virtual Machine (JVM). It's often used with Spark to write concise, efficient code. It leverages functional programming. This mix lets developers build apps for data analysis, machine learning, and real-time processing. They must be scalable and high-performance.
The Role of Graph Processing in Big Data
Graph processing is crucial in data science, machine learning, and parallel computing. It lets us analyze and visualize complex data relationships. This makes it easier to find patterns and insights that traditional methods would miss.
Graph processing is key in big data. It analyzes complex links in large datasets. It represents data as nodes and edges. This allows for efficient querying of interconnected information. It's essential for apps like social networks, recommendation systems, and fraud detection. Using graph processing frameworks like Apache Spark's GraphX can find insights and patterns that traditional methods might miss.
Leveraging Spark and Scala for Graph Processing
When it comes to graph processing, Apache Spark and Scala offer a wide range of capabilities. These tools provide a strong ecosystem for developing scalable, efficient graph apps. They can run graph algorithms and do analytics and data engineering tasks.
Apache Spark and Scala can process graphs. They can handle complex, interconnected data at scale. Spark's GraphX library and Scala let developers analyze graphs. They can gain insights from large datasets. This combo helps build fast, scalable solutions for apps. They are for social network analysis, recommendation systems, and fraud detection.
Graph Processing Techniques with Spark and Scala
With Spark and Scala, you can use various graph techniques. These include graph traversal, algorithms, analytics, and visualization. These tools help you process large graphs. They work well and quickly. So, you can find useful insights in your data.
Apache Spark and Scala are great for graph processing. They can analyze complex relationships in large datasets. Spark's GraphX library and Scala let developers process large graphs efficiently. It enables advanced analytics, like community detection and shortest paths. This provides insights into interconnected data.
Real-World Applications of Graph Processing
Graph processing has many real-world uses. They include social network analysis, recommendation systems, fraud detection, and network optimization. Use Spark and Scala for graph processing. You can then unlock your data's full potential and gain insights for your business.
Graph processing is now vital in many industries. It reveals complex relationships and patterns in data. Graph algorithms can find insights that traditional methods may miss. They are used in social networks to analyze user connections and in banks to detect fraud. Also, in logistics and supply chain management, graph processing optimizes routes and inventory. This shows its wide use in solving real-world problems.
How to obtain Apache Spark and Scala certification?
We are an Education Technology company providing certification training courses to accelerate careers of working professionals worldwide. We impart training through instructor-led classroom workshops, instructor-led live virtual training sessions, and self-paced e-learning courses.
We have successfully conducted training sessions in 108 countries across the globe and enabled thousands of working professionals to enhance the scope of their careers.
Our enterprise training portfolio includes in-demand and globally recognized certification training courses in Project Management, Quality Management, Business Analysis, IT Service Management, Agile and Scrum, Cyber Security, Data Science, and Emerging Technologies. Download our Enterprise Training Catalog from https://www.icertglobal.com/corporate-training-for-enterprises.php and https://www.icertglobal.com/index.php
Popular Courses include:
-
Project Management: PMP, CAPM ,PMI RMP
-
Quality Management: Six Sigma Black Belt ,Lean Six Sigma Green Belt, Lean Management, Minitab,CMMI
-
Business Analysis: CBAP, CCBA, ECBA
-
Agile Training: PMI-ACP , CSM , CSPO
-
Scrum Training: CSM
-
DevOps
-
Program Management: PgMP
-
Cloud Technology: Exin Cloud Computing
-
Citrix Client Adminisration: Citrix Cloud Administration
The 10 top-paying certifications to target in 2024 are:
Conclusion
In conclusion, Apache Spark and Scala are powerful tools for graph processing in the world of big data. Use their skills to unlock your data's potential. You can gain insights that drive innovation and growth for your organization. So why wait? Start exploring the world of graph processing with Spark and Scala today!
Contact Us For More Information:
Visit :www.icertglobal.com Email : info@icertglobal.com
Read More
Are you looking to harness the power of big data for graph processing? Look no further than Apache Spark and Scala! This article will explore powerful tools for graph processing. We'll cover data processing, analytics, machine learning, and real-time insights.
Apache Spark, with Scala, is a powerful framework for graph processing. It is efficient and scalable. With Spark's GraphX library, developers can use distributed computing. They can analyze and process large-scale graph data. Scala's functional programming makes Spark faster. It allows for concise, expressive code that simplifies complex graph computations and optimizations. The synergy between Spark and Scala is changing our approach to graph analytics. This includes social network analysis and complex recommendation systems.
Introduction to Apache Spark and Scala
Apache Spark is a distributed computing framework that provides an efficient way to process large sets of data. It is designed for scalability and performance, making it ideal for big data applications. Scala is a programming language. It integrates perfectly with Spark. It provides a powerful, expressive way to write code for data processing tasks.
Apache Spark is a powerful, open-source framework. It is for large-scale data processing. It enables fast, in-memory computing across distributed systems. Scala is a language built on the Java Virtual Machine (JVM). It's often used with Spark to write concise, efficient code. It leverages functional programming. This mix lets developers build apps for data analysis, machine learning, and real-time processing. They must be scalable and high-performance.
The Role of Graph Processing in Big Data
Graph processing is crucial in data science, machine learning, and parallel computing. It lets us analyze and visualize complex data relationships. This makes it easier to find patterns and insights that traditional methods would miss.
Graph processing is key in big data. It analyzes complex links in large datasets. It represents data as nodes and edges. This allows for efficient querying of interconnected information. It's essential for apps like social networks, recommendation systems, and fraud detection. Using graph processing frameworks like Apache Spark's GraphX can find insights and patterns that traditional methods might miss.
Leveraging Spark and Scala for Graph Processing
When it comes to graph processing, Apache Spark and Scala offer a wide range of capabilities. These tools provide a strong ecosystem for developing scalable, efficient graph apps. They can run graph algorithms and do analytics and data engineering tasks.
Apache Spark and Scala can process graphs. They can handle complex, interconnected data at scale. Spark's GraphX library and Scala let developers analyze graphs. They can gain insights from large datasets. This combo helps build fast, scalable solutions for apps. They are for social network analysis, recommendation systems, and fraud detection.
Graph Processing Techniques with Spark and Scala
With Spark and Scala, you can use various graph techniques. These include graph traversal, algorithms, analytics, and visualization. These tools help you process large graphs. They work well and quickly. So, you can find useful insights in your data.
Apache Spark and Scala are great for graph processing. They can analyze complex relationships in large datasets. Spark's GraphX library and Scala let developers process large graphs efficiently. It enables advanced analytics, like community detection and shortest paths. This provides insights into interconnected data.
Real-World Applications of Graph Processing
Graph processing has many real-world uses. They include social network analysis, recommendation systems, fraud detection, and network optimization. Use Spark and Scala for graph processing. You can then unlock your data's full potential and gain insights for your business.
Graph processing is now vital in many industries. It reveals complex relationships and patterns in data. Graph algorithms can find insights that traditional methods may miss. They are used in social networks to analyze user connections and in banks to detect fraud. Also, in logistics and supply chain management, graph processing optimizes routes and inventory. This shows its wide use in solving real-world problems.
How to obtain Apache Spark and Scala certification?
We are an Education Technology company providing certification training courses to accelerate careers of working professionals worldwide. We impart training through instructor-led classroom workshops, instructor-led live virtual training sessions, and self-paced e-learning courses.
We have successfully conducted training sessions in 108 countries across the globe and enabled thousands of working professionals to enhance the scope of their careers.
Our enterprise training portfolio includes in-demand and globally recognized certification training courses in Project Management, Quality Management, Business Analysis, IT Service Management, Agile and Scrum, Cyber Security, Data Science, and Emerging Technologies. Download our Enterprise Training Catalog from https://www.icertglobal.com/corporate-training-for-enterprises.php and https://www.icertglobal.com/index.php
Popular Courses include:
-
Project Management: PMP, CAPM ,PMI RMP
-
Quality Management: Six Sigma Black Belt ,Lean Six Sigma Green Belt, Lean Management, Minitab,CMMI
-
Business Analysis: CBAP, CCBA, ECBA
-
Agile Training: PMI-ACP , CSM , CSPO
-
Scrum Training: CSM
-
DevOps
-
Program Management: PgMP
-
Cloud Technology: Exin Cloud Computing
-
Citrix Client Adminisration: Citrix Cloud Administration
The 10 top-paying certifications to target in 2024 are:
Conclusion
In conclusion, Apache Spark and Scala are powerful tools for graph processing in the world of big data. Use their skills to unlock your data's potential. You can gain insights that drive innovation and growth for your organization. So why wait? Start exploring the world of graph processing with Spark and Scala today!
Contact Us For More Information:
Visit :www.icertglobal.com Email : info@icertglobal.com
Power BI Custom Visuals to Elevate Your Data Storytelling
In today's data-driven world, storytelling through data visualization is more important than ever. Power BI is a top Microsoft analytics tool. It lets users create insightful, attractive reports. Power BI has a robust set of native visuals. But custom visuals enable new possibilities for data storytelling. Custom visuals let users share complex ideas in a clear, powerful way. They boost understanding and engagement. This article explores the best Power BI custom visuals. They can enhance your data storytelling. They help turn raw data into compelling narratives that resonate with your audience.
Table Of Contents
- Enhancing Clarity with Infographic Visuals
- Creating Interactive Narratives with Play Axis
- Enhancing Comparisons with Bullet Charts
- Deepening Insights with Sankey Diagrams
- Simplifying Complex Data with Hierarchy Slicer
- Conclusion
Enhancing Clarity with Infographic Visuals
Infographics are great for storytelling. They simplify complex data into easy-to-digest bits. These visuals use images, icons, and text to share data insights. They achieve rapid and successful results. One popular custom visual in this category is the Infographic Designer. This visual lets users add icons and images to represent data points. This adds context and meaning. For example, we can use shopping carts or dollar signs to show sales figures. This makes the data more relatable and memorable. Customizing the visuals ensures the story matches the brand's message and style.
Infographics work well in presentations. They highlight essential points immediately. Using these visuals in your Power BI reports can turn dry stats into engaging stories. They will capture your audience's attention and make your data more impactful.
Creating Interactive Narratives with Play Axis
Interactivity is a crucial component of effective data storytelling. The Play Axis custom visual adds interactivity to your Power BI reports. It animates data over time or across different dimensions. This visual is great for showing trends in data over time. It helps viewers understand how the data has changed.
For example, a Play Axis can animate sales data across regions. It will highlight how each region's performance has changed over the years. This type of visual engages the audience. It also aids in analyzing the data. Users can see the progress and find key moments that may have affected outcomes. The ability to control the speed and playback of the animation boosts interactivity. It makes the data storytelling more immersive.
Enhancing Comparisons with Bullet Charts
For comparing performance to targets, Bullet Charts are a great tool. This custom visual, inspired by Stephen Few's design, shows a clear way to compare a measure (like actual sales) to one or more benchmarks (like target sales). Bullet charts are great for dashboards where space is tight. They convey much information in a small form.
The visual has a single bar that shows the actual value. The background shows the target range. Markers highlight performance thresholds. Bullet charts show data's performance. They indicate if it meets, falls short, or exceeds expectations. They make it easy for viewers to grasp performance at a glance. This visual is ideal for KPIs and metrics needing precise comparison. The story being told relies heavily on it.
Deepening Insights with Sankey Diagrams
Sankey diagrams are a custom visual. They show flow and relationships in data. They are useful when you need to show how parts contribute to a whole, or how a whole breaks down into parts. The visual's unique design, with its flowing paths and varying widths, shows the data's key relationships.
In Power BI, use Sankey Diagrams to show complex data flows. They can depict customer journeys, financial transfers, or energy use. The visual shows the scale of flows between categories. So, it is great for highlighting the most important connections. It also tells how resources, information, or transactions move through a system. Sankey Diagrams are a top choice for data storytelling. Their beauty and clarity shine, especially with complex datasets.
Simplifying Complex Data with Hierarchy Slicer
Many datasets have data hierarchies. It's vital to know the relationships between their levels for effective analysis. The Hierarchy Slicer custom visual lets users drill down into data. It provides a clear, organized way to explore complex datasets. This visual is useful for multi-layered data. This includes geographical regions, org structures, and product categories.
The Hierarchy Slicer organizes data into tiers for user filtration and navigation. This helps them focus on specific data subsets while seeing the structure. A company might use the Hierarchy Slicer to view sales data. It would drill down from a global view to specific countries, regions, and cities. This would give a detailed understanding of performance at every level. This visual improves data exploration and supports storytelling. It lets users adjust the story's detail to suit the audience.
How to obtain Power BI Certification?
We are an Education Technology company providing certification training courses to accelerate careers of working professionals worldwide. We impart training through instructor-led classroom workshops, instructor-led live virtual training sessions, and self-paced e-learning courses.
We have successfully conducted training sessions in 108 countries across the globe and enabled thousands of working professionals to enhance the scope of their careers.
Our enterprise training portfolio includes in-demand and globally recognized certification training courses in Project Management, Quality Management, Business Analysis, IT Service Management, Agile and Scrum, Cyber Security, Data Science, and Emerging Technologies. Download our Enterprise Training Catalog from https://www.icertglobal.com/corporate-training-for-enterprises.php and https://www.icertglobal.com/index.php
Popular Courses include:
- Project Management: PMP, CAPM ,PMI RMP
- Quality Management: Six Sigma Black Belt ,Lean Six Sigma Green Belt, Lean Management, Minitab,CMMI
- Business Analysis: CBAP, CCBA, ECBA
- Agile Training: PMI-ACP , CSM , CSPO
- Scrum Training: CSM
- DevOps
- Program Management: PgMP
- Cloud Technology: Exin Cloud Computing
- Citrix Client Adminisration: Citrix Cloud Administration
The 10 top-paying certifications to target in 2024 are:
- Certified Information Systems Security Professional® (CISSP)
- AWS Certified Solutions Architect
- Google Certified Professional Cloud Architect
- Big Data Certification
- Data Science Certification
- Certified In Risk And Information Systems Control (CRISC)
- Certified Information Security Manager(CISM)
- Project Management Professional (PMP)® Certification
- Certified Ethical Hacker (CEH)
- Certified Scrum Master (CSM)
Conclusion
In Conclusion, Custom visuals in Power BI are a game changer for data storytelling. They let users go beyond standard charts and graphs. They enable unique, engaging, interactive visual stories that resonate with audiences. Custom visuals can do a lot. They can simplify complex data with infographics and bullet charts. They can add dynamic interactions with play axis and Sankey diagrams. They can enhance the clarity, depth, and impact of your data stories.
Using these top Power BI custom visuals will transform your reports. It will make it more accessible and compelling. These tools can help you tell stories. They can convey trends, compare performance, and explore complex data. They will inform and inspire action. In a world of data, telling a clear, compelling story with it is vital. Power BI's custom visuals are key to that.
Contact Us :
Contact Us For More Information:
Visit :www.icertglobal.com Email : info@icertglobal.com
Read More
In today's data-driven world, storytelling through data visualization is more important than ever. Power BI is a top Microsoft analytics tool. It lets users create insightful, attractive reports. Power BI has a robust set of native visuals. But custom visuals enable new possibilities for data storytelling. Custom visuals let users share complex ideas in a clear, powerful way. They boost understanding and engagement. This article explores the best Power BI custom visuals. They can enhance your data storytelling. They help turn raw data into compelling narratives that resonate with your audience.
Table Of Contents
- Enhancing Clarity with Infographic Visuals
- Creating Interactive Narratives with Play Axis
- Enhancing Comparisons with Bullet Charts
- Deepening Insights with Sankey Diagrams
- Simplifying Complex Data with Hierarchy Slicer
- Conclusion
Enhancing Clarity with Infographic Visuals
Infographics are great for storytelling. They simplify complex data into easy-to-digest bits. These visuals use images, icons, and text to share data insights. They achieve rapid and successful results. One popular custom visual in this category is the Infographic Designer. This visual lets users add icons and images to represent data points. This adds context and meaning. For example, we can use shopping carts or dollar signs to show sales figures. This makes the data more relatable and memorable. Customizing the visuals ensures the story matches the brand's message and style.
Infographics work well in presentations. They highlight essential points immediately. Using these visuals in your Power BI reports can turn dry stats into engaging stories. They will capture your audience's attention and make your data more impactful.
Creating Interactive Narratives with Play Axis
Interactivity is a crucial component of effective data storytelling. The Play Axis custom visual adds interactivity to your Power BI reports. It animates data over time or across different dimensions. This visual is great for showing trends in data over time. It helps viewers understand how the data has changed.
For example, a Play Axis can animate sales data across regions. It will highlight how each region's performance has changed over the years. This type of visual engages the audience. It also aids in analyzing the data. Users can see the progress and find key moments that may have affected outcomes. The ability to control the speed and playback of the animation boosts interactivity. It makes the data storytelling more immersive.
Enhancing Comparisons with Bullet Charts
For comparing performance to targets, Bullet Charts are a great tool. This custom visual, inspired by Stephen Few's design, shows a clear way to compare a measure (like actual sales) to one or more benchmarks (like target sales). Bullet charts are great for dashboards where space is tight. They convey much information in a small form.
The visual has a single bar that shows the actual value. The background shows the target range. Markers highlight performance thresholds. Bullet charts show data's performance. They indicate if it meets, falls short, or exceeds expectations. They make it easy for viewers to grasp performance at a glance. This visual is ideal for KPIs and metrics needing precise comparison. The story being told relies heavily on it.
Deepening Insights with Sankey Diagrams
Sankey diagrams are a custom visual. They show flow and relationships in data. They are useful when you need to show how parts contribute to a whole, or how a whole breaks down into parts. The visual's unique design, with its flowing paths and varying widths, shows the data's key relationships.
In Power BI, use Sankey Diagrams to show complex data flows. They can depict customer journeys, financial transfers, or energy use. The visual shows the scale of flows between categories. So, it is great for highlighting the most important connections. It also tells how resources, information, or transactions move through a system. Sankey Diagrams are a top choice for data storytelling. Their beauty and clarity shine, especially with complex datasets.
Simplifying Complex Data with Hierarchy Slicer
Many datasets have data hierarchies. It's vital to know the relationships between their levels for effective analysis. The Hierarchy Slicer custom visual lets users drill down into data. It provides a clear, organized way to explore complex datasets. This visual is useful for multi-layered data. This includes geographical regions, org structures, and product categories.
The Hierarchy Slicer organizes data into tiers for user filtration and navigation. This helps them focus on specific data subsets while seeing the structure. A company might use the Hierarchy Slicer to view sales data. It would drill down from a global view to specific countries, regions, and cities. This would give a detailed understanding of performance at every level. This visual improves data exploration and supports storytelling. It lets users adjust the story's detail to suit the audience.
How to obtain Power BI Certification?
We are an Education Technology company providing certification training courses to accelerate careers of working professionals worldwide. We impart training through instructor-led classroom workshops, instructor-led live virtual training sessions, and self-paced e-learning courses.
We have successfully conducted training sessions in 108 countries across the globe and enabled thousands of working professionals to enhance the scope of their careers.
Our enterprise training portfolio includes in-demand and globally recognized certification training courses in Project Management, Quality Management, Business Analysis, IT Service Management, Agile and Scrum, Cyber Security, Data Science, and Emerging Technologies. Download our Enterprise Training Catalog from https://www.icertglobal.com/corporate-training-for-enterprises.php and https://www.icertglobal.com/index.php
Popular Courses include:
- Project Management: PMP, CAPM ,PMI RMP
- Quality Management: Six Sigma Black Belt ,Lean Six Sigma Green Belt, Lean Management, Minitab,CMMI
- Business Analysis: CBAP, CCBA, ECBA
- Agile Training: PMI-ACP , CSM , CSPO
- Scrum Training: CSM
- DevOps
- Program Management: PgMP
- Cloud Technology: Exin Cloud Computing
- Citrix Client Adminisration: Citrix Cloud Administration
The 10 top-paying certifications to target in 2024 are:
- Certified Information Systems Security Professional® (CISSP)
- AWS Certified Solutions Architect
- Google Certified Professional Cloud Architect
- Big Data Certification
- Data Science Certification
- Certified In Risk And Information Systems Control (CRISC)
- Certified Information Security Manager(CISM)
- Project Management Professional (PMP)® Certification
- Certified Ethical Hacker (CEH)
- Certified Scrum Master (CSM)
Conclusion
In Conclusion, Custom visuals in Power BI are a game changer for data storytelling. They let users go beyond standard charts and graphs. They enable unique, engaging, interactive visual stories that resonate with audiences. Custom visuals can do a lot. They can simplify complex data with infographics and bullet charts. They can add dynamic interactions with play axis and Sankey diagrams. They can enhance the clarity, depth, and impact of your data stories.
Using these top Power BI custom visuals will transform your reports. It will make it more accessible and compelling. These tools can help you tell stories. They can convey trends, compare performance, and explore complex data. They will inform and inspire action. In a world of data, telling a clear, compelling story with it is vital. Power BI's custom visuals are key to that.
Contact Us :
Contact Us For More Information:
Visit :www.icertglobal.com Email : info@icertglobal.com

Boosting Data Literacy with Power BI for Smarter Insights
Are you looking to improve your data literacy skills and make better data-driven decisions? Look no further than Power BI, a powerful data visualization and business intelligence tool that can help you interpret and analyze data effectively. In this article, we will explore how Power BI can enhance your data literacy and provide you with the necessary tools to excel in data analysis.
Understanding Data Literacy
Data literacy is the ability to read, work with, analyze, and communicate data effectively. It involves interpreting data, understanding the context in which it was collected, and making informed decisions based on the data. In today's data-driven world, data literacy is a crucial skill that can help individuals and organizations succeed.
The Importance of Data Literacy
Data literacy is essential for professionals in all industries, from marketing and finance to healthcare and education. It allows individuals to make sense of complex data sets, identify trends and patterns, and communicate findings to stakeholders effectively. With the rise of big data and advanced data analysis techniques, data literacy has become a valuable skill in the workplace.
Enhancing Data Literacy with Power BI
Power BI is a user-friendly data visualization tool that allows users to create interactive dashboards, reports, and data visualizations. With Power BI, you can easily explore and analyze data, gain insights, and share your findings with others. By using Power BI, you can improve your data literacy skills and become more proficient in data analysis.
Data Visualization Tools
Power BI offers a wide range of data visualization tools that can help you present data in a clear and visually appealing way. From bar charts and line graphs to maps and scatter plots, Power BI allows you to choose the best visualization for your data. With Power BI, you can create informative and engaging dashboards that convey complex information effectively.
Data Interpretation
Power BI helps you interpret data by providing visual representations of your data sets. By using Power BI's interactive features, you can explore your data, identify trends, and uncover insights. Power BI makes it easy to filter, sort, and drill down into your data, allowing you to extract valuable information and make data-driven decisions.
Data Storytelling
Power BI enables you to tell a compelling story with your data. By combining different visualizations and data sets, you can create a narrative that explains the key findings and insights from your data analysis. With Power BI, you can communicate complex data in a simple and engaging way, making it easier for others to understand and act on your findings.
Data Literacy Training
To enhance your data literacy skills with Power BI, consider enrolling in a data literacy training program. These programs provide hands-on experience with Power BI, teaching you how to use the tool effectively and interpret data accurately. By participating in a data literacy workshop or course, you can improve your data analysis skills and apply them in real-world scenarios.
How to obtain Power BI certification?
We are an Education Technology company providing certification training courses to accelerate careers of working professionals worldwide. We impart training through instructor-led classroom workshops, instructor-led live virtual training sessions, and self-paced e-learning courses.
We have successfully conducted training sessions in 108 countries across the globe and enabled thousands of working professionals to enhance the scope of their careers.
Our enterprise training portfolio includes in-demand and globally recognized certification training courses in Project Management, Quality Management, Business Analysis, IT Service Management, Agile and Scrum, Cyber Security, Data Science, and Emerging Technologies. Download our Enterprise Training Catalog from https://www.icertglobal.com/corporate-training-for-enterprises.php and https://www.icertglobal.com/index.php
Popular Courses include:
-
Project Management: PMP, CAPM ,PMI RMP
-
Quality Management: Six Sigma Black Belt ,Lean Six Sigma Green Belt, Lean Management, Minitab,CMMI
-
Business Analysis: CBAP, CCBA, ECBA
-
Agile Training: PMI-ACP , CSM , CSPO
-
Scrum Training: CSM
-
DevOps
-
Program Management: PgMP
-
Cloud Technology: Exin Cloud Computing
-
Citrix Client Adminisration: Citrix Cloud Administration
The 10 top-paying certifications to target in 2024 are:
Conclusion
In conclusion, Power BI is a powerful tool for enhancing data literacy and improving data analysis skills. By using Power BI's data visualization tools, data interpretation features, and data storytelling capabilities, you can become more proficient in working with data and making informed decisions. Consider investing in data literacy training and exploring the full potential of Power BI to excel in data analysis and interpretation.
Contact Us For More Information:
Visit :www.icertglobal.com Email : info@icertglobal.com
Read More
Are you looking to improve your data literacy skills and make better data-driven decisions? Look no further than Power BI, a powerful data visualization and business intelligence tool that can help you interpret and analyze data effectively. In this article, we will explore how Power BI can enhance your data literacy and provide you with the necessary tools to excel in data analysis.
Understanding Data Literacy
Data literacy is the ability to read, work with, analyze, and communicate data effectively. It involves interpreting data, understanding the context in which it was collected, and making informed decisions based on the data. In today's data-driven world, data literacy is a crucial skill that can help individuals and organizations succeed.
The Importance of Data Literacy
Data literacy is essential for professionals in all industries, from marketing and finance to healthcare and education. It allows individuals to make sense of complex data sets, identify trends and patterns, and communicate findings to stakeholders effectively. With the rise of big data and advanced data analysis techniques, data literacy has become a valuable skill in the workplace.
Enhancing Data Literacy with Power BI
Power BI is a user-friendly data visualization tool that allows users to create interactive dashboards, reports, and data visualizations. With Power BI, you can easily explore and analyze data, gain insights, and share your findings with others. By using Power BI, you can improve your data literacy skills and become more proficient in data analysis.
Data Visualization Tools
Power BI offers a wide range of data visualization tools that can help you present data in a clear and visually appealing way. From bar charts and line graphs to maps and scatter plots, Power BI allows you to choose the best visualization for your data. With Power BI, you can create informative and engaging dashboards that convey complex information effectively.
Data Interpretation
Power BI helps you interpret data by providing visual representations of your data sets. By using Power BI's interactive features, you can explore your data, identify trends, and uncover insights. Power BI makes it easy to filter, sort, and drill down into your data, allowing you to extract valuable information and make data-driven decisions.
Data Storytelling
Power BI enables you to tell a compelling story with your data. By combining different visualizations and data sets, you can create a narrative that explains the key findings and insights from your data analysis. With Power BI, you can communicate complex data in a simple and engaging way, making it easier for others to understand and act on your findings.
Data Literacy Training
To enhance your data literacy skills with Power BI, consider enrolling in a data literacy training program. These programs provide hands-on experience with Power BI, teaching you how to use the tool effectively and interpret data accurately. By participating in a data literacy workshop or course, you can improve your data analysis skills and apply them in real-world scenarios.
How to obtain Power BI certification?
We are an Education Technology company providing certification training courses to accelerate careers of working professionals worldwide. We impart training through instructor-led classroom workshops, instructor-led live virtual training sessions, and self-paced e-learning courses.
We have successfully conducted training sessions in 108 countries across the globe and enabled thousands of working professionals to enhance the scope of their careers.
Our enterprise training portfolio includes in-demand and globally recognized certification training courses in Project Management, Quality Management, Business Analysis, IT Service Management, Agile and Scrum, Cyber Security, Data Science, and Emerging Technologies. Download our Enterprise Training Catalog from https://www.icertglobal.com/corporate-training-for-enterprises.php and https://www.icertglobal.com/index.php
Popular Courses include:
-
Project Management: PMP, CAPM ,PMI RMP
-
Quality Management: Six Sigma Black Belt ,Lean Six Sigma Green Belt, Lean Management, Minitab,CMMI
-
Business Analysis: CBAP, CCBA, ECBA
-
Agile Training: PMI-ACP , CSM , CSPO
-
Scrum Training: CSM
-
DevOps
-
Program Management: PgMP
-
Cloud Technology: Exin Cloud Computing
-
Citrix Client Adminisration: Citrix Cloud Administration
The 10 top-paying certifications to target in 2024 are:
Conclusion
In conclusion, Power BI is a powerful tool for enhancing data literacy and improving data analysis skills. By using Power BI's data visualization tools, data interpretation features, and data storytelling capabilities, you can become more proficient in working with data and making informed decisions. Consider investing in data literacy training and exploring the full potential of Power BI to excel in data analysis and interpretation.
Contact Us For More Information:
Visit :www.icertglobal.com Email : info@icertglobal.com
.webp)
Top Power BI Books to Read in 2024 for All Skill Levels
Are you eager to boost your Power BI skills in 2024? This guide is for you. It will help you find the best resources, whether you are starting or want to deepen your expertise. From essential reading to practical tips, we've got you covered.
Getting Started with Power BI: Essential Books for Beginners
If you're new to Power BI, a solid foundation is key. "Power BI Essentials: A Comprehensive Guide for Beginners" has step-by-step instructions. They teach you how to create your first reports and interactive visualizations. This guide is perfect for beginners. It has clear examples that make learning Power BI fun and easy.
Unlock Advanced Power BI Techniques
For complex topics, read "Mastering Power BI: Advanced Techniques and Best Practices." It's a must. This book delves into advanced data modeling, DAX formulas, and performance optimization strategies. It is ideal for data analysts and business intelligence pros. It provides the tools to maximize Power BI's power in your work.
Applying Power BI in Business Contexts
"Power BI for Business: Practical Tips and Insights" is about using Power BI in business. It focuses on real-world applications of Power BI in a business environment. Learn how to use Power BI to drive decision-making and gain a competitive edge. This book is a must-read. It has case studies and expert advice. It is for anyone who wants to use Power BI in business.
Expand Your Learning: The Ultimate Power BI Resource Guide
Beyond books, many other ways exist to deepen your Power BI knowledge. Consider these extra resources:
-
Power BI Community: Connect with users. Share insights and ask questions.
-
Power BI Blogs: Follow the top Power BI blogs for the latest trends and updates.
-
Power BI Tutorials: Check out online tutorials and videos. They teach new features and techniques.
-
Power BI Experts: Attend webinars and workshops. Go to conferences. Learn from industry experts.
-
Power BI References: Keep guides for quick access to key Power BI formulas and functions.

How to obtain Power BI Certification?
We are an Education Technology company providing certification training courses to accelerate careers of working professionals worldwide. We impart training through instructor-led classroom workshops, instructor-led live virtual training sessions, and self-paced e-learning courses.
We have successfully conducted training sessions in 108 countries across the globe and enabled thousands of working professionals to enhance the scope of their careers.
Our enterprise training portfolio includes in-demand and globally recognized certification training courses in Project Management, Quality Management, Business Analysis, IT Service Management, Agile and Scrum, Cyber Security, Data Science, and Emerging Technologies. Download our Enterprise Training Catalog from https://www.icertglobal.com/corporate-training-for-enterprises.php and https://www.icertglobal.com/index.php
Popular Courses include:
-
Project Management: PMP, CAPM ,PMI RMP
-
Quality Management: Six Sigma Black Belt ,Lean Six Sigma Green Belt, Lean Management, Minitab,CMMI
-
Business Analysis: CBAP, CCBA, ECBA
-
Agile Training: PMI-ACP , CSM , CSPO
-
Scrum Training: CSM
-
DevOps
-
Program Management: PgMP
-
Cloud Technology: Exin Cloud Computing
-
Citrix Client Adminisration: Citrix Cloud Administration
The 10 top-paying certifications to target in 2024 are:
Conclusion
In Conclusion 2024 is an exciting year to enhance your Power BI skills. These top books and resources will help you master Power BI. You'll stay ahead of the curve. There's a wealth of knowledge at your fingertips. It can help you succeed in Power BI, whether you're a beginner or an advanced user.
Contact Us :
Contact Us For More Information:
Visit :www.icertglobal.com Email : info@icertglobal.com
Read More
Are you eager to boost your Power BI skills in 2024? This guide is for you. It will help you find the best resources, whether you are starting or want to deepen your expertise. From essential reading to practical tips, we've got you covered.
Getting Started with Power BI: Essential Books for Beginners
If you're new to Power BI, a solid foundation is key. "Power BI Essentials: A Comprehensive Guide for Beginners" has step-by-step instructions. They teach you how to create your first reports and interactive visualizations. This guide is perfect for beginners. It has clear examples that make learning Power BI fun and easy.
Unlock Advanced Power BI Techniques
For complex topics, read "Mastering Power BI: Advanced Techniques and Best Practices." It's a must. This book delves into advanced data modeling, DAX formulas, and performance optimization strategies. It is ideal for data analysts and business intelligence pros. It provides the tools to maximize Power BI's power in your work.
Applying Power BI in Business Contexts
"Power BI for Business: Practical Tips and Insights" is about using Power BI in business. It focuses on real-world applications of Power BI in a business environment. Learn how to use Power BI to drive decision-making and gain a competitive edge. This book is a must-read. It has case studies and expert advice. It is for anyone who wants to use Power BI in business.
Expand Your Learning: The Ultimate Power BI Resource Guide
Beyond books, many other ways exist to deepen your Power BI knowledge. Consider these extra resources:
-
Power BI Community: Connect with users. Share insights and ask questions.
-
Power BI Blogs: Follow the top Power BI blogs for the latest trends and updates.
-
Power BI Tutorials: Check out online tutorials and videos. They teach new features and techniques.
-
Power BI Experts: Attend webinars and workshops. Go to conferences. Learn from industry experts.
-
Power BI References: Keep guides for quick access to key Power BI formulas and functions.
How to obtain Power BI Certification?
We are an Education Technology company providing certification training courses to accelerate careers of working professionals worldwide. We impart training through instructor-led classroom workshops, instructor-led live virtual training sessions, and self-paced e-learning courses.
We have successfully conducted training sessions in 108 countries across the globe and enabled thousands of working professionals to enhance the scope of their careers.
Our enterprise training portfolio includes in-demand and globally recognized certification training courses in Project Management, Quality Management, Business Analysis, IT Service Management, Agile and Scrum, Cyber Security, Data Science, and Emerging Technologies. Download our Enterprise Training Catalog from https://www.icertglobal.com/corporate-training-for-enterprises.php and https://www.icertglobal.com/index.php
Popular Courses include:
-
Project Management: PMP, CAPM ,PMI RMP
-
Quality Management: Six Sigma Black Belt ,Lean Six Sigma Green Belt, Lean Management, Minitab,CMMI
-
Business Analysis: CBAP, CCBA, ECBA
-
Agile Training: PMI-ACP , CSM , CSPO
-
Scrum Training: CSM
-
DevOps
-
Program Management: PgMP
-
Cloud Technology: Exin Cloud Computing
-
Citrix Client Adminisration: Citrix Cloud Administration
The 10 top-paying certifications to target in 2024 are:
Conclusion
In Conclusion 2024 is an exciting year to enhance your Power BI skills. These top books and resources will help you master Power BI. You'll stay ahead of the curve. There's a wealth of knowledge at your fingertips. It can help you succeed in Power BI, whether you're a beginner or an advanced user.
Contact Us :
Contact Us For More Information:
Visit :www.icertglobal.com Email : info@icertglobal.com
Data Mining: Key Uses, Benefits & Its Impact on Businesses
In today's data-driven world, data mining plays a crucial role in extracting valuable insights from large datasets. This powerful technique involves the process of discovering patterns, trends, and relationships within data to help businesses make informed decisions. Let's explore the various uses and benefits of data mining in different applications and industries.
What is Data Mining?
Data mining is the process of analyzing large datasets to uncover hidden patterns, relationships, and insights that can be used to make strategic decisions. By using sophisticated algorithms and techniques, data mining helps businesses extract valuable information from complex datasets that would be impossible to analyze manually.
Uses of Data Mining
-
Business Intelligence: Data mining is widely used in business intelligence to analyze customer behavior patterns, market trends, and competitor strategies. By understanding these insights, businesses can optimize their operations, improve customer satisfaction, and drive growth.
-
Clustering and Classification: Data mining techniques such as clustering and classification help businesses categorize data into groups based on similarities or assign labels to new data points. This enables organizations to segment customers, detect fraud, and make predictions based on historical data.
-
Predictive Modeling: By leveraging predictive modeling techniques, data mining allows businesses to forecast future trends, identify potential risks, and make data-driven decisions. This helps organizations mitigate risks, maximize opportunities, and stay ahead of the competition.
-
Market Research: Data mining is essential in market research to analyze consumer preferences, buying patterns, and market trends. By understanding these insights, businesses can launch targeted marketing campaigns, develop new products, and enhance customer satisfaction.
-
Fraud Detection: Data mining techniques are instrumental in detecting fraudulent activities in various industries such as banking, insurance, and e-commerce. By analyzing patterns and anomalies in data, businesses can identify suspicious transactions, prevent fraud, and protect their assets.
Benefits of Data Mining
-
Improved Decision-Making: Data mining provides businesses with valuable insights and predictive analytics that help them make informed decisions. By leveraging these insights, organizations can identify opportunities, mitigate risks, and optimize performance.
-
Enhanced Customer Segmentation: Data mining allows businesses to segment customers based on their buying behaviors, preferences, and demographics. This enables organizations to personalize marketing campaigns, improve customer retention, and drive sales growth.
-
Optimized Operations: By analyzing data patterns and relationships, businesses can identify inefficiencies, bottlenecks, and areas for improvement in their operations. This helps organizations streamline processes, reduce costs, and increase productivity.
-
Data-Driven Strategies: Data mining enables businesses to develop data-driven strategies that are based on empirical evidence and statistical analysis. By leveraging these insights, organizations can optimize their marketing efforts, improve customer satisfaction, and drive business growth.
-
Competitive Advantage: By harnessing the power of data mining, businesses can gain a competitive advantage in their industry. By analyzing market trends, customer preferences, and competitor strategies, organizations can stay ahead of the curve and position themselves for success.
How to obtain Data Science and Business Intelligence certification?
We are an Education Technology company providing certification training courses to accelerate careers of working professionals worldwide. We impart training through instructor-led classroom workshops, instructor-led live virtual training sessions, and self-paced e-learning courses.
We have successfully conducted training sessions in 108 countries across the globe and enabled thousands of working professionals to enhance the scope of their careers.
Our enterprise training portfolio includes in-demand and globally recognized certification training courses in Project Management, Quality Management, Business Analysis, IT Service Management, Agile and Scrum, Cyber Security, Data Science, and Emerging Technologies. Download our Enterprise Training Catalog from https://www.icertglobal.com/corporate-training-for-enterprises.php and https://www.icertglobal.com/index.php
Popular Courses include:
-
Project Management: PMP, CAPM ,PMI RMP
-
Quality Management: Six Sigma Black Belt ,Lean Six Sigma Green Belt, Lean Management, Minitab,CMMI
-
Business Analysis: CBAP, CCBA, ECBA
-
Agile Training: PMI-ACP , CSM , CSPO
-
Scrum Training: CSM
-
DevOps
-
Program Management: PgMP
-
Cloud Technology: Exin Cloud Computing
-
Citrix Client Adminisration: Citrix Cloud Administration
The 10 top-paying certifications to target in 2024 are:
Conclusion
In conclusion, data mining is a powerful tool that offers a wide range of uses and benefits for businesses across various industries. By using advanced techniques and algorithms, organizations can extract valuable insights, make informed decisions, and drive growth. As the volume of data continues to grow exponentially, data mining will become increasingly essential for businesses seeking to gain a competitive edge and thrive in the digital age.
Contact Us For More Information:
Visit :www.icertglobal.com Email : info@icertglobal.com
Read More
In today's data-driven world, data mining plays a crucial role in extracting valuable insights from large datasets. This powerful technique involves the process of discovering patterns, trends, and relationships within data to help businesses make informed decisions. Let's explore the various uses and benefits of data mining in different applications and industries.
What is Data Mining?
Data mining is the process of analyzing large datasets to uncover hidden patterns, relationships, and insights that can be used to make strategic decisions. By using sophisticated algorithms and techniques, data mining helps businesses extract valuable information from complex datasets that would be impossible to analyze manually.
Uses of Data Mining
-
Business Intelligence: Data mining is widely used in business intelligence to analyze customer behavior patterns, market trends, and competitor strategies. By understanding these insights, businesses can optimize their operations, improve customer satisfaction, and drive growth.
-
Clustering and Classification: Data mining techniques such as clustering and classification help businesses categorize data into groups based on similarities or assign labels to new data points. This enables organizations to segment customers, detect fraud, and make predictions based on historical data.
-
Predictive Modeling: By leveraging predictive modeling techniques, data mining allows businesses to forecast future trends, identify potential risks, and make data-driven decisions. This helps organizations mitigate risks, maximize opportunities, and stay ahead of the competition.
-
Market Research: Data mining is essential in market research to analyze consumer preferences, buying patterns, and market trends. By understanding these insights, businesses can launch targeted marketing campaigns, develop new products, and enhance customer satisfaction.
-
Fraud Detection: Data mining techniques are instrumental in detecting fraudulent activities in various industries such as banking, insurance, and e-commerce. By analyzing patterns and anomalies in data, businesses can identify suspicious transactions, prevent fraud, and protect their assets.
Benefits of Data Mining
-
Improved Decision-Making: Data mining provides businesses with valuable insights and predictive analytics that help them make informed decisions. By leveraging these insights, organizations can identify opportunities, mitigate risks, and optimize performance.
-
Enhanced Customer Segmentation: Data mining allows businesses to segment customers based on their buying behaviors, preferences, and demographics. This enables organizations to personalize marketing campaigns, improve customer retention, and drive sales growth.
-
Optimized Operations: By analyzing data patterns and relationships, businesses can identify inefficiencies, bottlenecks, and areas for improvement in their operations. This helps organizations streamline processes, reduce costs, and increase productivity.
-
Data-Driven Strategies: Data mining enables businesses to develop data-driven strategies that are based on empirical evidence and statistical analysis. By leveraging these insights, organizations can optimize their marketing efforts, improve customer satisfaction, and drive business growth.
-
Competitive Advantage: By harnessing the power of data mining, businesses can gain a competitive advantage in their industry. By analyzing market trends, customer preferences, and competitor strategies, organizations can stay ahead of the curve and position themselves for success.
How to obtain Data Science and Business Intelligence certification?
We are an Education Technology company providing certification training courses to accelerate careers of working professionals worldwide. We impart training through instructor-led classroom workshops, instructor-led live virtual training sessions, and self-paced e-learning courses.
We have successfully conducted training sessions in 108 countries across the globe and enabled thousands of working professionals to enhance the scope of their careers.
Our enterprise training portfolio includes in-demand and globally recognized certification training courses in Project Management, Quality Management, Business Analysis, IT Service Management, Agile and Scrum, Cyber Security, Data Science, and Emerging Technologies. Download our Enterprise Training Catalog from https://www.icertglobal.com/corporate-training-for-enterprises.php and https://www.icertglobal.com/index.php
Popular Courses include:
-
Project Management: PMP, CAPM ,PMI RMP
-
Quality Management: Six Sigma Black Belt ,Lean Six Sigma Green Belt, Lean Management, Minitab,CMMI
-
Business Analysis: CBAP, CCBA, ECBA
-
Agile Training: PMI-ACP , CSM , CSPO
-
Scrum Training: CSM
-
DevOps
-
Program Management: PgMP
-
Cloud Technology: Exin Cloud Computing
-
Citrix Client Adminisration: Citrix Cloud Administration
The 10 top-paying certifications to target in 2024 are:
Conclusion
In conclusion, data mining is a powerful tool that offers a wide range of uses and benefits for businesses across various industries. By using advanced techniques and algorithms, organizations can extract valuable insights, make informed decisions, and drive growth. As the volume of data continues to grow exponentially, data mining will become increasingly essential for businesses seeking to gain a competitive edge and thrive in the digital age.
Contact Us For More Information:
Visit :www.icertglobal.com Email : info@icertglobal.com
Top 10 Best Practices for Scala Spark Developers in 2024
In the ever-evolving landscape of big data and data processing, Apache Spark has emerged as a powerful framework for scalable and efficient data analytics. Scala, with its strong support for functional programming, has become a popular choice for developers working with Spark. In this article, we will explore the top 10 best practices that Scala developers can follow to make the most out of Apache Spark in 2024.
Introduction to Apache Spark and Scala
Apache Spark is a distributed computing framework that provides a powerful platform for data engineering, cloud computing, and machine learning applications. Scala, a high-level programming language that runs on the Java Virtual Machine, is the preferred language for Spark developers due to its concise syntax and seamless integration with Spark.
What are the key features of Apache Spark and Scala?
Apache Spark offers high performance optimization, fault tolerance, and parallel processing capabilities, making it ideal for handling large-scale data processing tasks. Scala's scalability and efficient coding practices enable developers to build robust and scalable data pipelines, real-time processing applications, and machine learning models with ease.
Best Practices for Scala Developers Working with Apache Spark
1. Understanding the Spark Ecosystem
To leverage the full power of Apache Spark, developers need to have a deep understanding of the Spark ecosystem. This includes familiarizing themselves with Spark SQL for querying structured data, Spark Streaming for real-time data processing, and Spark MLlib for machine learning tasks.
2. Efficient Coding and Optimization Techniques
Scala developers should focus on writing clean and optimized code to improve the performance of their Spark jobs. This includes using efficient data structures, reducing unnecessary shuffling of data, and leveraging Scala libraries for complex computations.
3. Scalability and Fault Tolerance
When designing Spark applications, developers should prioritize scalability and fault tolerance. By partitioning data efficiently and handling failures gracefully, developers can ensure that their Spark clusters can handle large volumes of data without any hiccups.
4. Utilizing Spark SQL for Data Manipulation
Spark SQL provides a powerful interface for querying and manipulating structured data in Spark. By leveraging Spark SQL's rich set of functions and optimizations, Scala developers can streamline their data processing workflows and enhance the performance of their Spark jobs.
5. Leveraging Spark Clusters for Distributed Computing
Scala developers should take advantage of Spark clusters to distribute data processing tasks across multiple nodes. By dividing the workload efficiently and utilizing the resources of the cluster, developers can achieve significant performance gains in their Spark applications.
6. Building Data Pipelines with Spark Streaming
For real-time processing applications, Scala developers can use Spark Streaming to build robust and scalable data pipelines. By processing data in micro-batches and leveraging Spark's fault-tolerant architecture, developers can ensure continuous and reliable data processing in their applications.
7. Harnessing the Power of Machine Learning with MLlib
Scala developers can use Spark MLlib to build and deploy machine learning models within their Spark applications. By leveraging MLlib's scalable algorithms and distributed computing capabilities, developers can tackle complex machine learning tasks with ease.
8. Performance Optimization and Tuning
To achieve optimal performance in Spark applications, Scala developers should focus on tuning the configuration settings of their Spark jobs. By fine-tuning parameters such as memory allocation, parallelism, and caching, developers can optimize the performance of their Spark applications.
9. Incorporating Best Practices in Spark Architecture
Scala developers should adhere to best practices in Spark architecture, such as designing efficient data processing workflows, optimizing data storage and retrieval, and ensuring fault tolerance and reliability in their applications. By following these best practices, developers can build robust and scalable Spark applications.
10. Staying Abreast of the Latest Developments in Spark
As the field of big data and data analytics continues to evolve, Scala developers should stay informed about the latest trends and developments in the Apache Spark ecosystem. By keeping up-to-date with new features, enhancements, and best practices in Spark, developers can ensure that their skills remain relevant and competitive in 2024.
How to obtain Apache Spark and Scala Certification?
We are an Education Technology company providing certification training courses to accelerate careers of working professionals worldwide. We impart training through instructor-led classroom workshops, instructor-led live virtual training sessions, and self-paced e-learning courses.
We have successfully conducted training sessions in 108 countries across the globe and enabled thousands of working professionals to enhance the scope of their careers.
Our enterprise training portfolio includes in-demand and globally recognized certification training courses in Project Management, Quality Management, Business Analysis, IT Service Management, Agile and Scrum, Cyber Security, Data Science, and Emerging Technologies. Download our Enterprise Training Catalog from https://www.icertglobal.com/corporate-training-for-enterprises.php and https://www.icertglobal.com/index.php
Popular Courses include:
-
Project Management: PMP, CAPM ,PMI RMP
-
Quality Management: Six Sigma Black Belt ,Lean Six Sigma Green Belt, Lean Management, Minitab,CMMI
-
Business Analysis: CBAP, CCBA, ECBA
-
Agile Training: PMI-ACP , CSM , CSPO
-
Scrum Training: CSM
-
DevOps
-
Program Management: PgMP
-
Cloud Technology: Exin Cloud Computing
-
Citrix Client Adminisration: Citrix Cloud Administration
The 10 top-paying certifications to target in 2024 are:
Conclusion
In conclusion, Apache Spark offers a powerful platform for data processing, machine learning, and real-time analytics, and Scala developers can harness its capabilities to build robust and scalable applications. By following the top 10 best practices outlined in this article, Scala developers can optimize their Spark applications for performance, efficiency, and reliability in 2024.
Contact Us :
Contact Us For More Information:
Visit :www.icertglobal.com Email : info@icertglobal.com
Read More
In the ever-evolving landscape of big data and data processing, Apache Spark has emerged as a powerful framework for scalable and efficient data analytics. Scala, with its strong support for functional programming, has become a popular choice for developers working with Spark. In this article, we will explore the top 10 best practices that Scala developers can follow to make the most out of Apache Spark in 2024.
Introduction to Apache Spark and Scala
Apache Spark is a distributed computing framework that provides a powerful platform for data engineering, cloud computing, and machine learning applications. Scala, a high-level programming language that runs on the Java Virtual Machine, is the preferred language for Spark developers due to its concise syntax and seamless integration with Spark.
What are the key features of Apache Spark and Scala?
Apache Spark offers high performance optimization, fault tolerance, and parallel processing capabilities, making it ideal for handling large-scale data processing tasks. Scala's scalability and efficient coding practices enable developers to build robust and scalable data pipelines, real-time processing applications, and machine learning models with ease.
Best Practices for Scala Developers Working with Apache Spark
1. Understanding the Spark Ecosystem
To leverage the full power of Apache Spark, developers need to have a deep understanding of the Spark ecosystem. This includes familiarizing themselves with Spark SQL for querying structured data, Spark Streaming for real-time data processing, and Spark MLlib for machine learning tasks.
2. Efficient Coding and Optimization Techniques
Scala developers should focus on writing clean and optimized code to improve the performance of their Spark jobs. This includes using efficient data structures, reducing unnecessary shuffling of data, and leveraging Scala libraries for complex computations.
3. Scalability and Fault Tolerance
When designing Spark applications, developers should prioritize scalability and fault tolerance. By partitioning data efficiently and handling failures gracefully, developers can ensure that their Spark clusters can handle large volumes of data without any hiccups.
4. Utilizing Spark SQL for Data Manipulation
Spark SQL provides a powerful interface for querying and manipulating structured data in Spark. By leveraging Spark SQL's rich set of functions and optimizations, Scala developers can streamline their data processing workflows and enhance the performance of their Spark jobs.
5. Leveraging Spark Clusters for Distributed Computing
Scala developers should take advantage of Spark clusters to distribute data processing tasks across multiple nodes. By dividing the workload efficiently and utilizing the resources of the cluster, developers can achieve significant performance gains in their Spark applications.
6. Building Data Pipelines with Spark Streaming
For real-time processing applications, Scala developers can use Spark Streaming to build robust and scalable data pipelines. By processing data in micro-batches and leveraging Spark's fault-tolerant architecture, developers can ensure continuous and reliable data processing in their applications.
7. Harnessing the Power of Machine Learning with MLlib
Scala developers can use Spark MLlib to build and deploy machine learning models within their Spark applications. By leveraging MLlib's scalable algorithms and distributed computing capabilities, developers can tackle complex machine learning tasks with ease.
8. Performance Optimization and Tuning
To achieve optimal performance in Spark applications, Scala developers should focus on tuning the configuration settings of their Spark jobs. By fine-tuning parameters such as memory allocation, parallelism, and caching, developers can optimize the performance of their Spark applications.
9. Incorporating Best Practices in Spark Architecture
Scala developers should adhere to best practices in Spark architecture, such as designing efficient data processing workflows, optimizing data storage and retrieval, and ensuring fault tolerance and reliability in their applications. By following these best practices, developers can build robust and scalable Spark applications.
10. Staying Abreast of the Latest Developments in Spark
As the field of big data and data analytics continues to evolve, Scala developers should stay informed about the latest trends and developments in the Apache Spark ecosystem. By keeping up-to-date with new features, enhancements, and best practices in Spark, developers can ensure that their skills remain relevant and competitive in 2024.
How to obtain Apache Spark and Scala Certification?
We are an Education Technology company providing certification training courses to accelerate careers of working professionals worldwide. We impart training through instructor-led classroom workshops, instructor-led live virtual training sessions, and self-paced e-learning courses.
We have successfully conducted training sessions in 108 countries across the globe and enabled thousands of working professionals to enhance the scope of their careers.
Our enterprise training portfolio includes in-demand and globally recognized certification training courses in Project Management, Quality Management, Business Analysis, IT Service Management, Agile and Scrum, Cyber Security, Data Science, and Emerging Technologies. Download our Enterprise Training Catalog from https://www.icertglobal.com/corporate-training-for-enterprises.php and https://www.icertglobal.com/index.php
Popular Courses include:
-
Project Management: PMP, CAPM ,PMI RMP
-
Quality Management: Six Sigma Black Belt ,Lean Six Sigma Green Belt, Lean Management, Minitab,CMMI
-
Business Analysis: CBAP, CCBA, ECBA
-
Agile Training: PMI-ACP , CSM , CSPO
-
Scrum Training: CSM
-
DevOps
-
Program Management: PgMP
-
Cloud Technology: Exin Cloud Computing
-
Citrix Client Adminisration: Citrix Cloud Administration
The 10 top-paying certifications to target in 2024 are:
Conclusion
In conclusion, Apache Spark offers a powerful platform for data processing, machine learning, and real-time analytics, and Scala developers can harness its capabilities to build robust and scalable applications. By following the top 10 best practices outlined in this article, Scala developers can optimize their Spark applications for performance, efficiency, and reliability in 2024.
Contact Us :
Contact Us For More Information:
Visit :www.icertglobal.com Email : info@icertglobal.com

Real-World Case Studies in Data Science: Insights & Success
In the world of data science, case studies play a crucial role in showcasing the practical applications and success stories of data analysis in various industries. From healthcare to finance, retail to marketing, data science has revolutionized the way organizations make data-driven decisions. Let's explore some real-life case studies that highlight the power of data science in action.
Data Analysis Examples in Healthcare
One compelling case study showcases how data science is being used in healthcare to improve patient outcomes and optimize healthcare services. By analyzing patient data, medical history, and treatment plans, healthcare providers can identify patterns and predict potential health issues. This predictive analytics approach helps in early intervention, personalized treatment plans, and overall cost reduction in the healthcare system.
Data Science Use Cases in Marketing
Another fascinating example is the use of data science in marketing. By analyzing customer behavior, preferences, and purchasing patterns, businesses can create targeted marketing campaigns that are more likely to convert leads into customers. From personalized email marketing to predictive customer segmentation, data science empowers marketers to make informed decisions and drive higher ROI.
Predictive Analytics Case Studies in Finance
In the finance industry, predictive analytics is used to forecast market trends, detect fraud, and optimize investment strategies. By analyzing historical data and market indicators, financial institutions can make informed decisions that lead to higher profits and reduced risks. Case studies in finance demonstrate how data science tools and techniques are reshaping the industry and driving innovation.
Data Science Use Cases in Retail
Retailers are also leveraging data science to enhance the customer experience and increase sales. By analyzing sales data, inventory levels, and customer feedback, retailers can identify trends, optimize pricing strategies, and personalize the shopping experience. Data science in retail is not only about increasing revenue but also about building strong customer loyalty and satisfaction.
Innovative Data Science Projects in Education
In the field of education, data science is being used to improve student performance, personalize learning experiences, and optimize resource allocation. By analyzing student data, test scores, and classroom behavior, educators can identify areas for improvement and tailor instructional strategies to meet individual student needs. Data science projects in education are paving the way for a more effective and efficient learning environment.
Successful Data Science Implementation in Banking
Banks and financial institutions are increasingly adopting data science to streamline operations, detect fraud, and enhance customer service. By analyzing transaction data, credit scores, and customer feedback, banks can detect suspicious activities, reduce operational costs, and offer personalized banking solutions. Case studies in banking demonstrate the transformative impact of data science on the financial services industry.
How to obtain Data Science certification?
We are an Education Technology company providing certification training courses to accelerate careers of working professionals worldwide. We impart training through instructor-led classroom workshops, instructor-led live virtual training sessions, and self-paced e-learning courses.
We have successfully conducted training sessions in 108 countries across the globe and enabled thousands of working professionals to enhance the scope of their careers.
Our enterprise training portfolio includes in-demand and globally recognized certification training courses in Project Management, Quality Management, Business Analysis, IT Service Management, Agile and Scrum, Cyber Security, Data Science, and Emerging Technologies. Download our Enterprise Training Catalog from https://www.icertglobal.com/corporate-training-for-enterprises.php and https://www.icertglobal.com/index.php
Popular Courses include:
-
Project Management: PMP, CAPM ,PMI RMP
-
Quality Management: Six Sigma Black Belt ,Lean Six Sigma Green Belt, Lean Management, Minitab,CMMI
-
Business Analysis: CBAP, CCBA, ECBA
-
Agile Training: PMI-ACP , CSM , CSPO
-
Scrum Training: CSM
-
DevOps
-
Program Management: PgMP
-
Cloud Technology: Exin Cloud Computing
-
Citrix Client Adminisration: Citrix Cloud Administration
The 10 top-paying certifications to target in 2024 are:
Conclusion
In conclusion, case studies in data science provide invaluable insights into the practical applications and success stories of data analysis across various industries. From healthcare to finance, retail to education, data science is reshaping the way organizations make data-driven decisions and achieve measurable results. As data science continues to evolve and innovate, these real-life examples serve as a testament to the power of data-driven insights and informed decision-making in today's digital age.
Contact Us For More Information:
Visit :www.icertglobal.com Email : info@icertglobal.com
Read More
In the world of data science, case studies play a crucial role in showcasing the practical applications and success stories of data analysis in various industries. From healthcare to finance, retail to marketing, data science has revolutionized the way organizations make data-driven decisions. Let's explore some real-life case studies that highlight the power of data science in action.
Data Analysis Examples in Healthcare
One compelling case study showcases how data science is being used in healthcare to improve patient outcomes and optimize healthcare services. By analyzing patient data, medical history, and treatment plans, healthcare providers can identify patterns and predict potential health issues. This predictive analytics approach helps in early intervention, personalized treatment plans, and overall cost reduction in the healthcare system.
Data Science Use Cases in Marketing
Another fascinating example is the use of data science in marketing. By analyzing customer behavior, preferences, and purchasing patterns, businesses can create targeted marketing campaigns that are more likely to convert leads into customers. From personalized email marketing to predictive customer segmentation, data science empowers marketers to make informed decisions and drive higher ROI.
Predictive Analytics Case Studies in Finance
In the finance industry, predictive analytics is used to forecast market trends, detect fraud, and optimize investment strategies. By analyzing historical data and market indicators, financial institutions can make informed decisions that lead to higher profits and reduced risks. Case studies in finance demonstrate how data science tools and techniques are reshaping the industry and driving innovation.
Data Science Use Cases in Retail
Retailers are also leveraging data science to enhance the customer experience and increase sales. By analyzing sales data, inventory levels, and customer feedback, retailers can identify trends, optimize pricing strategies, and personalize the shopping experience. Data science in retail is not only about increasing revenue but also about building strong customer loyalty and satisfaction.
Innovative Data Science Projects in Education
In the field of education, data science is being used to improve student performance, personalize learning experiences, and optimize resource allocation. By analyzing student data, test scores, and classroom behavior, educators can identify areas for improvement and tailor instructional strategies to meet individual student needs. Data science projects in education are paving the way for a more effective and efficient learning environment.
Successful Data Science Implementation in Banking
Banks and financial institutions are increasingly adopting data science to streamline operations, detect fraud, and enhance customer service. By analyzing transaction data, credit scores, and customer feedback, banks can detect suspicious activities, reduce operational costs, and offer personalized banking solutions. Case studies in banking demonstrate the transformative impact of data science on the financial services industry.
How to obtain Data Science certification?
We are an Education Technology company providing certification training courses to accelerate careers of working professionals worldwide. We impart training through instructor-led classroom workshops, instructor-led live virtual training sessions, and self-paced e-learning courses.
We have successfully conducted training sessions in 108 countries across the globe and enabled thousands of working professionals to enhance the scope of their careers.
Our enterprise training portfolio includes in-demand and globally recognized certification training courses in Project Management, Quality Management, Business Analysis, IT Service Management, Agile and Scrum, Cyber Security, Data Science, and Emerging Technologies. Download our Enterprise Training Catalog from https://www.icertglobal.com/corporate-training-for-enterprises.php and https://www.icertglobal.com/index.php
Popular Courses include:
-
Project Management: PMP, CAPM ,PMI RMP
-
Quality Management: Six Sigma Black Belt ,Lean Six Sigma Green Belt, Lean Management, Minitab,CMMI
-
Business Analysis: CBAP, CCBA, ECBA
-
Agile Training: PMI-ACP , CSM , CSPO
-
Scrum Training: CSM
-
DevOps
-
Program Management: PgMP
-
Cloud Technology: Exin Cloud Computing
-
Citrix Client Adminisration: Citrix Cloud Administration
The 10 top-paying certifications to target in 2024 are:
Conclusion
In conclusion, case studies in data science provide invaluable insights into the practical applications and success stories of data analysis across various industries. From healthcare to finance, retail to education, data science is reshaping the way organizations make data-driven decisions and achieve measurable results. As data science continues to evolve and innovate, these real-life examples serve as a testament to the power of data-driven insights and informed decision-making in today's digital age.
Contact Us For More Information:
Visit :www.icertglobal.com Email : info@icertglobal.com
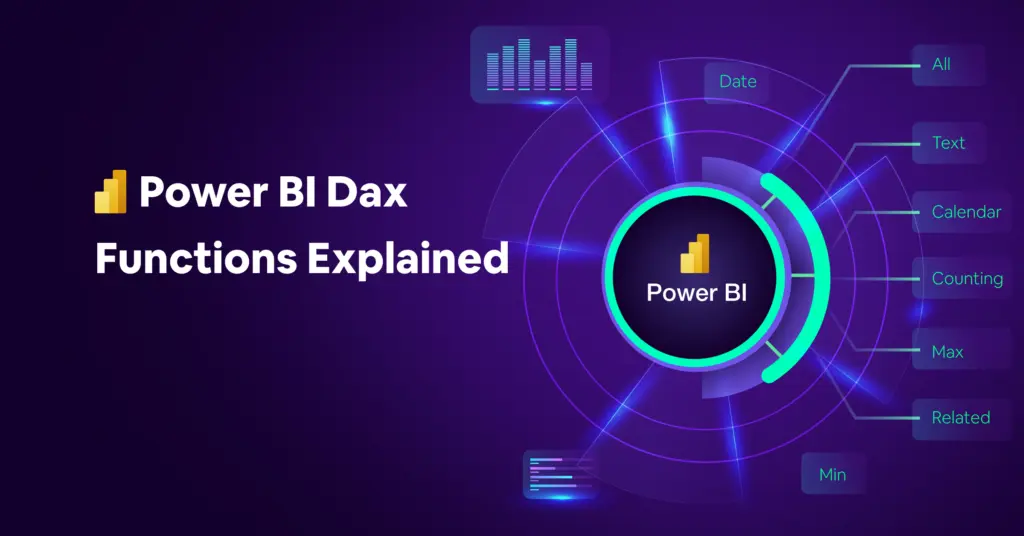
Top Power BI DAX Functions Every Data Analyst Should Know
Are you a data analyst looking to enhance your skills in Power BI? Understanding and mastering DAX functions is essential for effective data analysis in Power BI. In this article, we will explore the top DAX functions that every data analyst should know to optimize their data modeling, visualization, and analysis in Power BI.
Introduction to Power BI DAX Functions
Power BI is a powerful business intelligence tool that allows users to transform, analyze, and visualize data. Data Analysis Expressions (DAX) is the formula language used in Power BI to create custom calculations for data modeling and analysis. By leveraging DAX functions, data analysts can perform advanced analytics, measure calculations, time intelligence, and more to generate insightful reports and dashboards.
Understanding Measure Calculations
One of the key features of Power BI is the ability to create custom measures using DAX functions. Measures are calculations that are used in Power BI to aggregate values based on specific criteria. By utilizing DAX functions such as SUM, AVERAGE, MIN, and MAX, data analysts can perform calculations on their data and create meaningful insights for decision-making.
Leveraging Advanced Analytics with DAX Functions
Data analysts can take their analysis to the next level by leveraging advanced DAX functions in Power BI. Functions such as CALCULATE, FILTER, and ALL enable users to manipulate the filter context and row context to perform complex calculations and comparisons. By mastering these functions, data analysts can uncover hidden patterns, trends, and outliers in their data.
Exploring Time Intelligence Functions
Time intelligence is a crucial aspect of data analysis, especially in business scenarios where analyzing data over time is essential. Power BI offers a range of DAX functions specifically designed for time-based analysis, such as TOTALYTD, SAMEPERIODLASTYEAR, and DATESBETWEEN. These functions enable data analysts to calculate year-to-date values, compare data with previous periods, and filter data based on specific date ranges.
Enhancing Data Visualization with DAX Functions
Power BI provides powerful data visualization capabilities, allowing users to create interactive reports and dashboards. By utilizing DAX functions such as RELATED, CALCULATE, and FILTER, data analysts can enhance their data visualization by creating dynamic and interactive visualizations. These functions enable users to build complex relationships between different data tables and filter data based on specific criteria.
Improving Data Modeling with DAX Functions
Effective data modeling is essential for generating meaningful insights from your data. Power BI offers a range of DAX functions that can help data analysts improve their data modeling processes. Functions such as RELATEDTABLE, UNION, and INTERSECT enable users to create relationships between data tables, merge data from multiple sources, and perform set operations to optimize their data model.
How to obtain Power BI certification?
We are an Education Technology company providing certification training courses to accelerate careers of working professionals worldwide. We impart training through instructor-led classroom workshops, instructor-led live virtual training sessions, and self-paced e-learning courses.
We have successfully conducted training sessions in 108 countries across the globe and enabled thousands of working professionals to enhance the scope of their careers.
Our enterprise training portfolio includes in-demand and globally recognized certification training courses in Project Management, Quality Management, Business Analysis, IT Service Management, Agile and Scrum, Cyber Security, Data Science, and Emerging Technologies. Download our Enterprise Training Catalog from https://www.icertglobal.com/corporate-training-for-enterprises.php and https://www.icertglobal.com/index.php
Popular Courses include:
-
Project Management: PMP, CAPM ,PMI RMP
-
Quality Management: Six Sigma Black Belt ,Lean Six Sigma Green Belt, Lean Management, Minitab,CMMI
-
Business Analysis: CBAP, CCBA, ECBA
-
Agile Training: PMI-ACP , CSM , CSPO
-
Scrum Training: CSM
-
DevOps
-
Program Management: PgMP
-
Cloud Technology: Exin Cloud Computing
-
Citrix Client Adminisration: Citrix Cloud Administration
The 10 top-paying certifications to target in 2024 are:
Conclusion
In conclusion, mastering DAX functions is essential for every data analyst looking to maximize the potential of Power BI for data analysis and visualization. By understanding and leveraging the top DAX functions discussed in this article, data analysts can enhance their skills in data modeling, advanced analytics, time intelligence, and data visualization to generate actionable insights for informed decision-making.
Contact Us :
Contact Us For More Information:
Visit :www.icertglobal.com Email : info@icertglobal.com
Read More
Are you a data analyst looking to enhance your skills in Power BI? Understanding and mastering DAX functions is essential for effective data analysis in Power BI. In this article, we will explore the top DAX functions that every data analyst should know to optimize their data modeling, visualization, and analysis in Power BI.
Introduction to Power BI DAX Functions
Power BI is a powerful business intelligence tool that allows users to transform, analyze, and visualize data. Data Analysis Expressions (DAX) is the formula language used in Power BI to create custom calculations for data modeling and analysis. By leveraging DAX functions, data analysts can perform advanced analytics, measure calculations, time intelligence, and more to generate insightful reports and dashboards.
Understanding Measure Calculations
One of the key features of Power BI is the ability to create custom measures using DAX functions. Measures are calculations that are used in Power BI to aggregate values based on specific criteria. By utilizing DAX functions such as SUM, AVERAGE, MIN, and MAX, data analysts can perform calculations on their data and create meaningful insights for decision-making.
Leveraging Advanced Analytics with DAX Functions
Data analysts can take their analysis to the next level by leveraging advanced DAX functions in Power BI. Functions such as CALCULATE, FILTER, and ALL enable users to manipulate the filter context and row context to perform complex calculations and comparisons. By mastering these functions, data analysts can uncover hidden patterns, trends, and outliers in their data.
Exploring Time Intelligence Functions
Time intelligence is a crucial aspect of data analysis, especially in business scenarios where analyzing data over time is essential. Power BI offers a range of DAX functions specifically designed for time-based analysis, such as TOTALYTD, SAMEPERIODLASTYEAR, and DATESBETWEEN. These functions enable data analysts to calculate year-to-date values, compare data with previous periods, and filter data based on specific date ranges.
Enhancing Data Visualization with DAX Functions
Power BI provides powerful data visualization capabilities, allowing users to create interactive reports and dashboards. By utilizing DAX functions such as RELATED, CALCULATE, and FILTER, data analysts can enhance their data visualization by creating dynamic and interactive visualizations. These functions enable users to build complex relationships between different data tables and filter data based on specific criteria.
Improving Data Modeling with DAX Functions
Effective data modeling is essential for generating meaningful insights from your data. Power BI offers a range of DAX functions that can help data analysts improve their data modeling processes. Functions such as RELATEDTABLE, UNION, and INTERSECT enable users to create relationships between data tables, merge data from multiple sources, and perform set operations to optimize their data model.
How to obtain Power BI certification?
We are an Education Technology company providing certification training courses to accelerate careers of working professionals worldwide. We impart training through instructor-led classroom workshops, instructor-led live virtual training sessions, and self-paced e-learning courses.
We have successfully conducted training sessions in 108 countries across the globe and enabled thousands of working professionals to enhance the scope of their careers.
Our enterprise training portfolio includes in-demand and globally recognized certification training courses in Project Management, Quality Management, Business Analysis, IT Service Management, Agile and Scrum, Cyber Security, Data Science, and Emerging Technologies. Download our Enterprise Training Catalog from https://www.icertglobal.com/corporate-training-for-enterprises.php and https://www.icertglobal.com/index.php
Popular Courses include:
-
Project Management: PMP, CAPM ,PMI RMP
-
Quality Management: Six Sigma Black Belt ,Lean Six Sigma Green Belt, Lean Management, Minitab,CMMI
-
Business Analysis: CBAP, CCBA, ECBA
-
Agile Training: PMI-ACP , CSM , CSPO
-
Scrum Training: CSM
-
DevOps
-
Program Management: PgMP
-
Cloud Technology: Exin Cloud Computing
-
Citrix Client Adminisration: Citrix Cloud Administration
The 10 top-paying certifications to target in 2024 are:
Conclusion
In conclusion, mastering DAX functions is essential for every data analyst looking to maximize the potential of Power BI for data analysis and visualization. By understanding and leveraging the top DAX functions discussed in this article, data analysts can enhance their skills in data modeling, advanced analytics, time intelligence, and data visualization to generate actionable insights for informed decision-making.
Contact Us :
Contact Us For More Information:
Visit :www.icertglobal.com Email : info@icertglobal.com
Apache Spark Architecture: Fast, High-Speed Data Processing
In this article, we will delve into the intricate world of Apache Spark architecture and explore how this powerful framework enables big data processing through its unique design and components. By the end of this read, you will have a solid understanding of Spark's distributed computing model, memory processing capabilities, fault tolerance mechanisms, and much more.
What is Apache Spark?
Apache Spark is an open-source distributed computing framework that provides an efficient way to process large datasets across a cluster of machines. It offers a flexible and powerful programming model that supports a wide range of applications, from batch processing to real-time analytics. Understanding Apache Spark's architecture is essential for harnessing its full potential in data processing workflows.
Spark Cluster
At the heart of Apache Spark architecture lies the concept of a Spark cluster. A Spark cluster is a group of interconnected machines that work together to process data in parallel. It consists of a master node, which manages the cluster, and multiple worker nodes, where the actual processing takes place. Understanding how Spark clusters operate is crucial for scaling data processing tasks efficiently.
Spark Components
Apache Spark is composed of several key components that work together to enable distributed data processing. These components include the Spark driver, which controls the execution of Spark applications, Spark nodes, where data is processed in parallel, and various libraries and modules that facilitate tasks such as data transformations, actions, and job scheduling. Understanding the role of each component is essential for optimizing Spark applications.
Big Data Processing
Spark is designed to handle large-scale data processing tasks efficiently, making it an ideal choice for big data applications. By leveraging in-memory processing and parallel computing techniques, Spark can process massive datasets with ease. Understanding how Spark handles big data processing tasks is key to building robust and scalable data pipelines.
Spark Programming Model
One of the reasons for Apache Spark's popularity is its intuitive programming model, which allows developers to write complex data processing tasks with ease. Spark's programming model is based on the concept of resilient distributed datasets (RDDs), which are resilient, immutable distributed collections of data that can be transformed and manipulated in parallel. Understanding Spark's programming model is essential for writing efficient and scalable data processing workflows.
Fault Tolerance
Fault tolerance is a critical aspect of Apache Spark's architecture, ensuring that data processing tasks can recover from failures seamlessly. Spark achieves fault tolerance through mechanisms such as lineage tracking, data checkpointing, and task retrying. Understanding how Spark maintains fault tolerance is crucial for building reliable data pipelines that can withstand failures.
Resilient Distributed Dataset
Central to Apache Spark's fault tolerance mechanisms is the concept of resilient distributed datasets (RDDs). RDDs are fault-tolerant, parallel collections of data that can be operated on in a distributed manner. By storing lineage information and ensuring data durability, RDDs enable Spark to recover from failures and maintain data consistency. Understanding RDDs is essential for designing fault-tolerant data processing workflows.
Data Pipelines
Data pipelines are a fundamental building block of Apache Spark applications, enabling users to define and execute complex data processing tasks. Spark provides a rich set of APIs for building data pipelines, allowing users to transform, filter, and aggregate data sets efficiently. Understanding how data pipelines work in Spark is essential for orchestrating data processing workflows and optimizing job performance.
How to obtain Apache Spark certification?
We are an Education Technology company providing certification training courses to accelerate careers of working professionals worldwide. We impart training through instructor-led classroom workshops, instructor-led live virtual training sessions, and self-paced e-learning courses.
We have successfully conducted training sessions in 108 countries across the globe and enabled thousands of working professionals to enhance the scope of their careers.
Our enterprise training portfolio includes in-demand and globally recognized certification training courses in Project Management, Quality Management, Business Analysis, IT Service Management, Agile and Scrum, Cyber Security, Data Science, and Emerging Technologies. Download our Enterprise Training Catalog from https://www.icertglobal.com/corporate-training-for-enterprises.php and https://www.icertglobal.com/index.php
Popular Courses include:
-
Project Management: PMP, CAPM ,PMI RMP
-
Quality Management: Six Sigma Black Belt ,Lean Six Sigma Green Belt, Lean Management, Minitab,CMMI
-
Business Analysis: CBAP, CCBA, ECBA
-
Agile Training: PMI-ACP , CSM , CSPO
-
Scrum Training: CSM
-
DevOps
-
Program Management: PgMP
-
Cloud Technology: Exin Cloud Computing
-
Citrix Client Adminisration: Citrix Cloud Administration
The 10 top-paying certifications to target in 2024 are:
Conclusion
In conclusion, understanding Apache Spark's architecture is crucial for harnessing the full power of this versatile framework in big data processing. By grasping concepts such as Spark clusters, fault tolerance mechanisms, and data pipelines, users can design efficient and scalable data processing workflows. With its in-memory processing capabilities, parallel computing techniques, and flexible programming model, Apache Spark is a formidable tool for handling large-scale data processing tasks. So, dive into Apache Spark's architecture today and unlock its full potential for your data processing needs.
Contact Us For More Information:
Visit :www.icertglobal.comEmail : info@icertglobal.com
Read More
In this article, we will delve into the intricate world of Apache Spark architecture and explore how this powerful framework enables big data processing through its unique design and components. By the end of this read, you will have a solid understanding of Spark's distributed computing model, memory processing capabilities, fault tolerance mechanisms, and much more.
What is Apache Spark?
Apache Spark is an open-source distributed computing framework that provides an efficient way to process large datasets across a cluster of machines. It offers a flexible and powerful programming model that supports a wide range of applications, from batch processing to real-time analytics. Understanding Apache Spark's architecture is essential for harnessing its full potential in data processing workflows.
Spark Cluster
At the heart of Apache Spark architecture lies the concept of a Spark cluster. A Spark cluster is a group of interconnected machines that work together to process data in parallel. It consists of a master node, which manages the cluster, and multiple worker nodes, where the actual processing takes place. Understanding how Spark clusters operate is crucial for scaling data processing tasks efficiently.
Spark Components
Apache Spark is composed of several key components that work together to enable distributed data processing. These components include the Spark driver, which controls the execution of Spark applications, Spark nodes, where data is processed in parallel, and various libraries and modules that facilitate tasks such as data transformations, actions, and job scheduling. Understanding the role of each component is essential for optimizing Spark applications.
Big Data Processing
Spark is designed to handle large-scale data processing tasks efficiently, making it an ideal choice for big data applications. By leveraging in-memory processing and parallel computing techniques, Spark can process massive datasets with ease. Understanding how Spark handles big data processing tasks is key to building robust and scalable data pipelines.
Spark Programming Model
One of the reasons for Apache Spark's popularity is its intuitive programming model, which allows developers to write complex data processing tasks with ease. Spark's programming model is based on the concept of resilient distributed datasets (RDDs), which are resilient, immutable distributed collections of data that can be transformed and manipulated in parallel. Understanding Spark's programming model is essential for writing efficient and scalable data processing workflows.
Fault Tolerance
Fault tolerance is a critical aspect of Apache Spark's architecture, ensuring that data processing tasks can recover from failures seamlessly. Spark achieves fault tolerance through mechanisms such as lineage tracking, data checkpointing, and task retrying. Understanding how Spark maintains fault tolerance is crucial for building reliable data pipelines that can withstand failures.
Resilient Distributed Dataset
Central to Apache Spark's fault tolerance mechanisms is the concept of resilient distributed datasets (RDDs). RDDs are fault-tolerant, parallel collections of data that can be operated on in a distributed manner. By storing lineage information and ensuring data durability, RDDs enable Spark to recover from failures and maintain data consistency. Understanding RDDs is essential for designing fault-tolerant data processing workflows.
Data Pipelines
Data pipelines are a fundamental building block of Apache Spark applications, enabling users to define and execute complex data processing tasks. Spark provides a rich set of APIs for building data pipelines, allowing users to transform, filter, and aggregate data sets efficiently. Understanding how data pipelines work in Spark is essential for orchestrating data processing workflows and optimizing job performance.
How to obtain Apache Spark certification?
We are an Education Technology company providing certification training courses to accelerate careers of working professionals worldwide. We impart training through instructor-led classroom workshops, instructor-led live virtual training sessions, and self-paced e-learning courses.
We have successfully conducted training sessions in 108 countries across the globe and enabled thousands of working professionals to enhance the scope of their careers.
Our enterprise training portfolio includes in-demand and globally recognized certification training courses in Project Management, Quality Management, Business Analysis, IT Service Management, Agile and Scrum, Cyber Security, Data Science, and Emerging Technologies. Download our Enterprise Training Catalog from https://www.icertglobal.com/corporate-training-for-enterprises.php and https://www.icertglobal.com/index.php
Popular Courses include:
-
Project Management: PMP, CAPM ,PMI RMP
-
Quality Management: Six Sigma Black Belt ,Lean Six Sigma Green Belt, Lean Management, Minitab,CMMI
-
Business Analysis: CBAP, CCBA, ECBA
-
Agile Training: PMI-ACP , CSM , CSPO
-
Scrum Training: CSM
-
DevOps
-
Program Management: PgMP
-
Cloud Technology: Exin Cloud Computing
-
Citrix Client Adminisration: Citrix Cloud Administration
The 10 top-paying certifications to target in 2024 are:
Conclusion
In conclusion, understanding Apache Spark's architecture is crucial for harnessing the full power of this versatile framework in big data processing. By grasping concepts such as Spark clusters, fault tolerance mechanisms, and data pipelines, users can design efficient and scalable data processing workflows. With its in-memory processing capabilities, parallel computing techniques, and flexible programming model, Apache Spark is a formidable tool for handling large-scale data processing tasks. So, dive into Apache Spark's architecture today and unlock its full potential for your data processing needs.
Contact Us For More Information:
Visit :www.icertglobal.comEmail : info@icertglobal.com

Apache Kafka vs RabbitMQ : Which One Should You Choose?
When it comes to choosing the right messaging system for your application, Apache Kafka and RabbitMQ are two popular options that come to mind. Both are powerful tools that offer various features and capabilities, but they have distinct differences that set them apart. In this article, we will compare Apache Kafka and RabbitMQ in terms of performance, scalability, architecture, features, use cases, and more to help you make an informed decision on which one to choose for your project.
Apache Kafka
Apache Kafka is a distributed streaming platform designed for handling real-time data feeds. It provides high throughput, low latency, fault tolerance, and scalability, making it suitable for use cases that require processing large volumes of data in real-time. Kafka is built as a distributed system that can be easily scaled horizontally to handle a high volume of data streams efficiently.
Key Features of Apache Kafka:
- Message Brokers: Kafka acts as a messaging queue where producers can send messages that are stored in topics and consumed by consumers.
- Event Streaming: Kafka allows for real-time event streaming, enabling applications to react to events as they occur.
- Message Ordering: Kafka guarantees message ordering within a partition, ensuring that messages are processed in the order they were produced.
- Distributed Systems: Kafka is designed to operate as a distributed system, providing fault tolerance and high availability.
- Compatibility: Kafka can be easily integrated with various systems and platforms, making it versatile for different use cases.
RabbitMQ
RabbitMQ is a messaging broker that implements the Advanced Message Queuing Protocol (AMQP). It is known for its ease of use, flexibility, and reliability, making it a popular choice for applications that require reliable asynchronous communication. RabbitMQ is designed to handle message queues efficiently, ensuring that messages are delivered reliably and in the correct order.
Key Features of RabbitMQ:
- Messaging Queue: RabbitMQ provides a message queue where producers can send messages that are stored until consumers are ready to process them.
- Data Consistency: RabbitMQ ensures data consistency by guaranteeing message delivery and order.
- Throughput: RabbitMQ offers high throughput for processing messages efficiently and quickly.
- Ease of Use: RabbitMQ is easy to set up and configure, making it ideal for developers who want a simple messaging solution.
- Integration: RabbitMQ can be integrated with various systems and platforms, allowing for seamless communication between different components.
Comparison
Now, let's compare Apache Kafka and RabbitMQ based on various factors to help you decide which one to choose for your project:
| Factors | Apache Kafka | RabbitMQ |
|------------------|-------------------------------------------|-----------------------------------------------|
| Performance | High throughput and low latency | Reliable message delivery and data consistency|
| Scalability | Easily scalable horizontally | Scalable with clustering capabilities |
| Architecture | Distributed system with fault tolerance | Message broker with support for different protocols|
| Features | Event streaming, message ordering | Messaging queue with data consistency |
| Use Cases | Real-time data processing, event streaming| Asynchronous communication, task queues |
So, which one to choose?
The answer to whether you should choose Apache Kafka or RabbitMQ depends on your specific use case and requirements. If you need a high-throughput, low-latency system for real-time data processing and event streaming, Apache Kafka would be the ideal choice. On the other hand, if you require reliable message delivery, data consistency, and ease of use for asynchronous communication, RabbitMQ may be more suitable for your project.
How to obtain Apache Kafka Certification?
We are an Education Technology company providing certification training courses to accelerate careers of working professionals worldwide. We impart training through instructor-led classroom workshops, instructor-led live virtual training sessions, and self-paced e-learning courses.
We have successfully conducted training sessions in 108 countries across the globe and enabled thousands of working professionals to enhance the scope of their careers.
Our enterprise training portfolio includes in-demand and globally recognized certification training courses in Project Management, Quality Management, Business Analysis, IT Service Management, Agile and Scrum, Cyber Security, Data Science, and Emerging Technologies. Download our Enterprise Training Catalog from https://www.icertglobal.com/corporate-training-for-enterprises.php and https://www.icertglobal.com/index.php
Popular Courses include:
- Project Management: PMP, CAPM ,PMI RMP
- Quality Management: Six Sigma Black Belt ,Lean Six Sigma Green Belt, Lean Management, Minitab,CMMI
- Business Analysis: CBAP, CCBA, ECBA
- Agile Training: PMI-ACP , CSM , CSPO
- Scrum Training: CSM
- DevOps
- Program Management: PgMP
- Cloud Technology: Exin Cloud Computing
- Citrix Client Adminisration: Citrix Cloud Administration
The 10 top-paying certifications to target in 2024 are:
- Certified Information Systems Security Professional® (CISSP)
- AWS Certified Solutions Architect
- Google Certified Professional Cloud Architect
- Big Data Certification
- Data Science Certification
- Certified In Risk And Information Systems Control (CRISC)
- Certified Information Security Manager(CISM)
- Project Management Professional (PMP)® Certification
- Certified Ethical Hacker (CEH)
- Certified Scrum Master (CSM)
Conclusion
In conclusion, both Apache Kafka and RabbitMQ are powerful messaging systems with unique features and capabilities. By understanding the differences between the two, you can make an informed decision on which one to choose based on your project's needs. Whether you choose Apache Kafka for its performance and scalability or RabbitMQ for its reliability and ease of use, both systems can help you build robust and efficient applications that meet your messaging requirements.
Contact Us :
Contact Us For More Information:
Visit :www.icertglobal.com Email : info@icertglobal.com
Read More
When it comes to choosing the right messaging system for your application, Apache Kafka and RabbitMQ are two popular options that come to mind. Both are powerful tools that offer various features and capabilities, but they have distinct differences that set them apart. In this article, we will compare Apache Kafka and RabbitMQ in terms of performance, scalability, architecture, features, use cases, and more to help you make an informed decision on which one to choose for your project.
Apache Kafka
Apache Kafka is a distributed streaming platform designed for handling real-time data feeds. It provides high throughput, low latency, fault tolerance, and scalability, making it suitable for use cases that require processing large volumes of data in real-time. Kafka is built as a distributed system that can be easily scaled horizontally to handle a high volume of data streams efficiently.
Key Features of Apache Kafka:
- Message Brokers: Kafka acts as a messaging queue where producers can send messages that are stored in topics and consumed by consumers.
- Event Streaming: Kafka allows for real-time event streaming, enabling applications to react to events as they occur.
- Message Ordering: Kafka guarantees message ordering within a partition, ensuring that messages are processed in the order they were produced.
- Distributed Systems: Kafka is designed to operate as a distributed system, providing fault tolerance and high availability.
- Compatibility: Kafka can be easily integrated with various systems and platforms, making it versatile for different use cases.
RabbitMQ
RabbitMQ is a messaging broker that implements the Advanced Message Queuing Protocol (AMQP). It is known for its ease of use, flexibility, and reliability, making it a popular choice for applications that require reliable asynchronous communication. RabbitMQ is designed to handle message queues efficiently, ensuring that messages are delivered reliably and in the correct order.
Key Features of RabbitMQ:
- Messaging Queue: RabbitMQ provides a message queue where producers can send messages that are stored until consumers are ready to process them.
- Data Consistency: RabbitMQ ensures data consistency by guaranteeing message delivery and order.
- Throughput: RabbitMQ offers high throughput for processing messages efficiently and quickly.
- Ease of Use: RabbitMQ is easy to set up and configure, making it ideal for developers who want a simple messaging solution.
- Integration: RabbitMQ can be integrated with various systems and platforms, allowing for seamless communication between different components.
Comparison
Now, let's compare Apache Kafka and RabbitMQ based on various factors to help you decide which one to choose for your project:
| Factors | Apache Kafka | RabbitMQ |
|------------------|-------------------------------------------|-----------------------------------------------|
| Performance | High throughput and low latency | Reliable message delivery and data consistency|
| Scalability | Easily scalable horizontally | Scalable with clustering capabilities |
| Architecture | Distributed system with fault tolerance | Message broker with support for different protocols|
| Features | Event streaming, message ordering | Messaging queue with data consistency |
| Use Cases | Real-time data processing, event streaming| Asynchronous communication, task queues |
So, which one to choose?
The answer to whether you should choose Apache Kafka or RabbitMQ depends on your specific use case and requirements. If you need a high-throughput, low-latency system for real-time data processing and event streaming, Apache Kafka would be the ideal choice. On the other hand, if you require reliable message delivery, data consistency, and ease of use for asynchronous communication, RabbitMQ may be more suitable for your project.
How to obtain Apache Kafka Certification?
We are an Education Technology company providing certification training courses to accelerate careers of working professionals worldwide. We impart training through instructor-led classroom workshops, instructor-led live virtual training sessions, and self-paced e-learning courses.
We have successfully conducted training sessions in 108 countries across the globe and enabled thousands of working professionals to enhance the scope of their careers.
Our enterprise training portfolio includes in-demand and globally recognized certification training courses in Project Management, Quality Management, Business Analysis, IT Service Management, Agile and Scrum, Cyber Security, Data Science, and Emerging Technologies. Download our Enterprise Training Catalog from https://www.icertglobal.com/corporate-training-for-enterprises.php and https://www.icertglobal.com/index.php
Popular Courses include:
- Project Management: PMP, CAPM ,PMI RMP
- Quality Management: Six Sigma Black Belt ,Lean Six Sigma Green Belt, Lean Management, Minitab,CMMI
- Business Analysis: CBAP, CCBA, ECBA
- Agile Training: PMI-ACP , CSM , CSPO
- Scrum Training: CSM
- DevOps
- Program Management: PgMP
- Cloud Technology: Exin Cloud Computing
- Citrix Client Adminisration: Citrix Cloud Administration
The 10 top-paying certifications to target in 2024 are:
- Certified Information Systems Security Professional® (CISSP)
- AWS Certified Solutions Architect
- Google Certified Professional Cloud Architect
- Big Data Certification
- Data Science Certification
- Certified In Risk And Information Systems Control (CRISC)
- Certified Information Security Manager(CISM)
- Project Management Professional (PMP)® Certification
- Certified Ethical Hacker (CEH)
- Certified Scrum Master (CSM)
Conclusion
In conclusion, both Apache Kafka and RabbitMQ are powerful messaging systems with unique features and capabilities. By understanding the differences between the two, you can make an informed decision on which one to choose based on your project's needs. Whether you choose Apache Kafka for its performance and scalability or RabbitMQ for its reliability and ease of use, both systems can help you build robust and efficient applications that meet your messaging requirements.
Contact Us :
Contact Us For More Information:
Visit :www.icertglobal.com Email : info@icertglobal.com

Apache Kafka Connect:Simplifying Data Integration Seamlessly
Are you looking for an efficient and reliable way to streamline data integration in your organization? Look no further than Apache Kafka Connect. This powerful tool is revolutionizing the way data is moved between systems, making the process seamless and hassle-free. In this article, we will explore the ins and outs of Apache Kafka Connect and how it simplifies data integration.
What is Apache Kafka Connect?
Apache Kafka Connect is a framework that allows you to easily build and run data pipelines that move data between Apache Kafka and other systems. It is part of the Kafka ecosystem, serving as a connector for various data sources and sinks. With Kafka Connect, you can create data pipelines that stream data in real-time, enabling event-driven architecture and distributed systems.
Key Features of Apache Kafka Connect
-
Open-source software: Apache Kafka Connect is open-source, allowing for flexibility and customization to suit your organization's unique needs.
-
Data processing: Kafka Connect handles data transformation, synchronization, and integration, making it a versatile tool for data engineering.
-
Cloud computing: It supports seamless integration with cloud platforms, providing scalability and reliability for your data pipelines.
How Does Apache Kafka Connect Work?
Apache Kafka Connect operates within a Kafka cluster, where it manages connectors for data ingestion, transformation, and synchronization. Source connectors pull data from external systems into Kafka, while sink connectors push data from Kafka to external systems. The framework also supports connector plugins for easy development and scalability.
Advantages of Using Apache Kafka Connect
-
Monitoring and management: Kafka Connect offers robust monitoring tools to track the performance of your data pipelines.
-
Stream processing: It enables real-time stream processing for efficient data analysis and insights.
-
Scalable architecture: With Kafka Connect, you can easily scale your data integration processes as your organization grows.
Use Cases of Apache Kafka Connect
-
Data lakes: Kafka Connect can seamlessly load data into data lakes for analytics and storage.
-
Data warehousing: It facilitates data replication to data warehouses for business intelligence and reporting.
-
Cloud integration: It simplifies the integration of on-premises and cloud data sources for a unified data platform.
How to obtain Apache Kafka certification?
We are an Education Technology company providing certification training courses to accelerate careers of working professionals worldwide. We impart training through instructor-led classroom workshops, instructor-led live virtual training sessions, and self-paced e-learning courses.
We have successfully conducted training sessions in 108 countries across the globe and enabled thousands of working professionals to enhance the scope of their careers.
Our enterprise training portfolio includes in-demand and globally recognized certification training courses in Project Management, Quality Management, Business Analysis, IT Service Management, Agile and Scrum, Cyber Security, Data Science, and Emerging Technologies. Download our Enterprise Training Catalog from https://www.icertglobal.com/corporate-training-for-enterprises.php and https://www.icertglobal.com/index.php
Popular Courses include:
-
Project Management: PMP, CAPM ,PMI RMP
-
Quality Management: Six Sigma Black Belt ,Lean Six Sigma Green Belt, Lean Management, Minitab,CMMI
-
Business Analysis: CBAP, CCBA, ECBA
-
Agile Training: PMI-ACP , CSM , CSPO
-
Scrum Training: CSM
-
DevOps
-
Program Management: PgMP
-
Cloud Technology: Exin Cloud Computing
-
Citrix Client Adminisration: Citrix Cloud Administration
The 10 top-paying certifications to target in 2024 are:
Conclusion
In conclusion, Apache Kafka Connect is a powerful tool for simplifying data integration in today's complex data landscape. With its seamless data processing capabilities, scalable architecture, and real-time stream processing, Kafka Connect is revolutionizing the way organizations handle data. Whether you are dealing with structured data, unstructured data, or legacy systems integration, Apache Kafka Connect is the solution you need for efficient and reliable data pipelines. Embrace the power of Apache Kafka Connect and streamline your data integration processes today.
Contact Us For More Information:
Visit : www.icertglobal.com Email : info@icertglobal.com
Read More
Are you looking for an efficient and reliable way to streamline data integration in your organization? Look no further than Apache Kafka Connect. This powerful tool is revolutionizing the way data is moved between systems, making the process seamless and hassle-free. In this article, we will explore the ins and outs of Apache Kafka Connect and how it simplifies data integration.
What is Apache Kafka Connect?
Apache Kafka Connect is a framework that allows you to easily build and run data pipelines that move data between Apache Kafka and other systems. It is part of the Kafka ecosystem, serving as a connector for various data sources and sinks. With Kafka Connect, you can create data pipelines that stream data in real-time, enabling event-driven architecture and distributed systems.
Key Features of Apache Kafka Connect
-
Open-source software: Apache Kafka Connect is open-source, allowing for flexibility and customization to suit your organization's unique needs.
-
Data processing: Kafka Connect handles data transformation, synchronization, and integration, making it a versatile tool for data engineering.
-
Cloud computing: It supports seamless integration with cloud platforms, providing scalability and reliability for your data pipelines.
How Does Apache Kafka Connect Work?
Apache Kafka Connect operates within a Kafka cluster, where it manages connectors for data ingestion, transformation, and synchronization. Source connectors pull data from external systems into Kafka, while sink connectors push data from Kafka to external systems. The framework also supports connector plugins for easy development and scalability.
Advantages of Using Apache Kafka Connect
-
Monitoring and management: Kafka Connect offers robust monitoring tools to track the performance of your data pipelines.
-
Stream processing: It enables real-time stream processing for efficient data analysis and insights.
-
Scalable architecture: With Kafka Connect, you can easily scale your data integration processes as your organization grows.
Use Cases of Apache Kafka Connect
-
Data lakes: Kafka Connect can seamlessly load data into data lakes for analytics and storage.
-
Data warehousing: It facilitates data replication to data warehouses for business intelligence and reporting.
-
Cloud integration: It simplifies the integration of on-premises and cloud data sources for a unified data platform.
How to obtain Apache Kafka certification?
We are an Education Technology company providing certification training courses to accelerate careers of working professionals worldwide. We impart training through instructor-led classroom workshops, instructor-led live virtual training sessions, and self-paced e-learning courses.
We have successfully conducted training sessions in 108 countries across the globe and enabled thousands of working professionals to enhance the scope of their careers.
Our enterprise training portfolio includes in-demand and globally recognized certification training courses in Project Management, Quality Management, Business Analysis, IT Service Management, Agile and Scrum, Cyber Security, Data Science, and Emerging Technologies. Download our Enterprise Training Catalog from https://www.icertglobal.com/corporate-training-for-enterprises.php and https://www.icertglobal.com/index.php
Popular Courses include:
-
Project Management: PMP, CAPM ,PMI RMP
-
Quality Management: Six Sigma Black Belt ,Lean Six Sigma Green Belt, Lean Management, Minitab,CMMI
-
Business Analysis: CBAP, CCBA, ECBA
-
Agile Training: PMI-ACP , CSM , CSPO
-
Scrum Training: CSM
-
DevOps
-
Program Management: PgMP
-
Cloud Technology: Exin Cloud Computing
-
Citrix Client Adminisration: Citrix Cloud Administration
The 10 top-paying certifications to target in 2024 are:
Conclusion
In conclusion, Apache Kafka Connect is a powerful tool for simplifying data integration in today's complex data landscape. With its seamless data processing capabilities, scalable architecture, and real-time stream processing, Kafka Connect is revolutionizing the way organizations handle data. Whether you are dealing with structured data, unstructured data, or legacy systems integration, Apache Kafka Connect is the solution you need for efficient and reliable data pipelines. Embrace the power of Apache Kafka Connect and streamline your data integration processes today.
Contact Us For More Information:
Visit : www.icertglobal.com Email : info@icertglobal.com
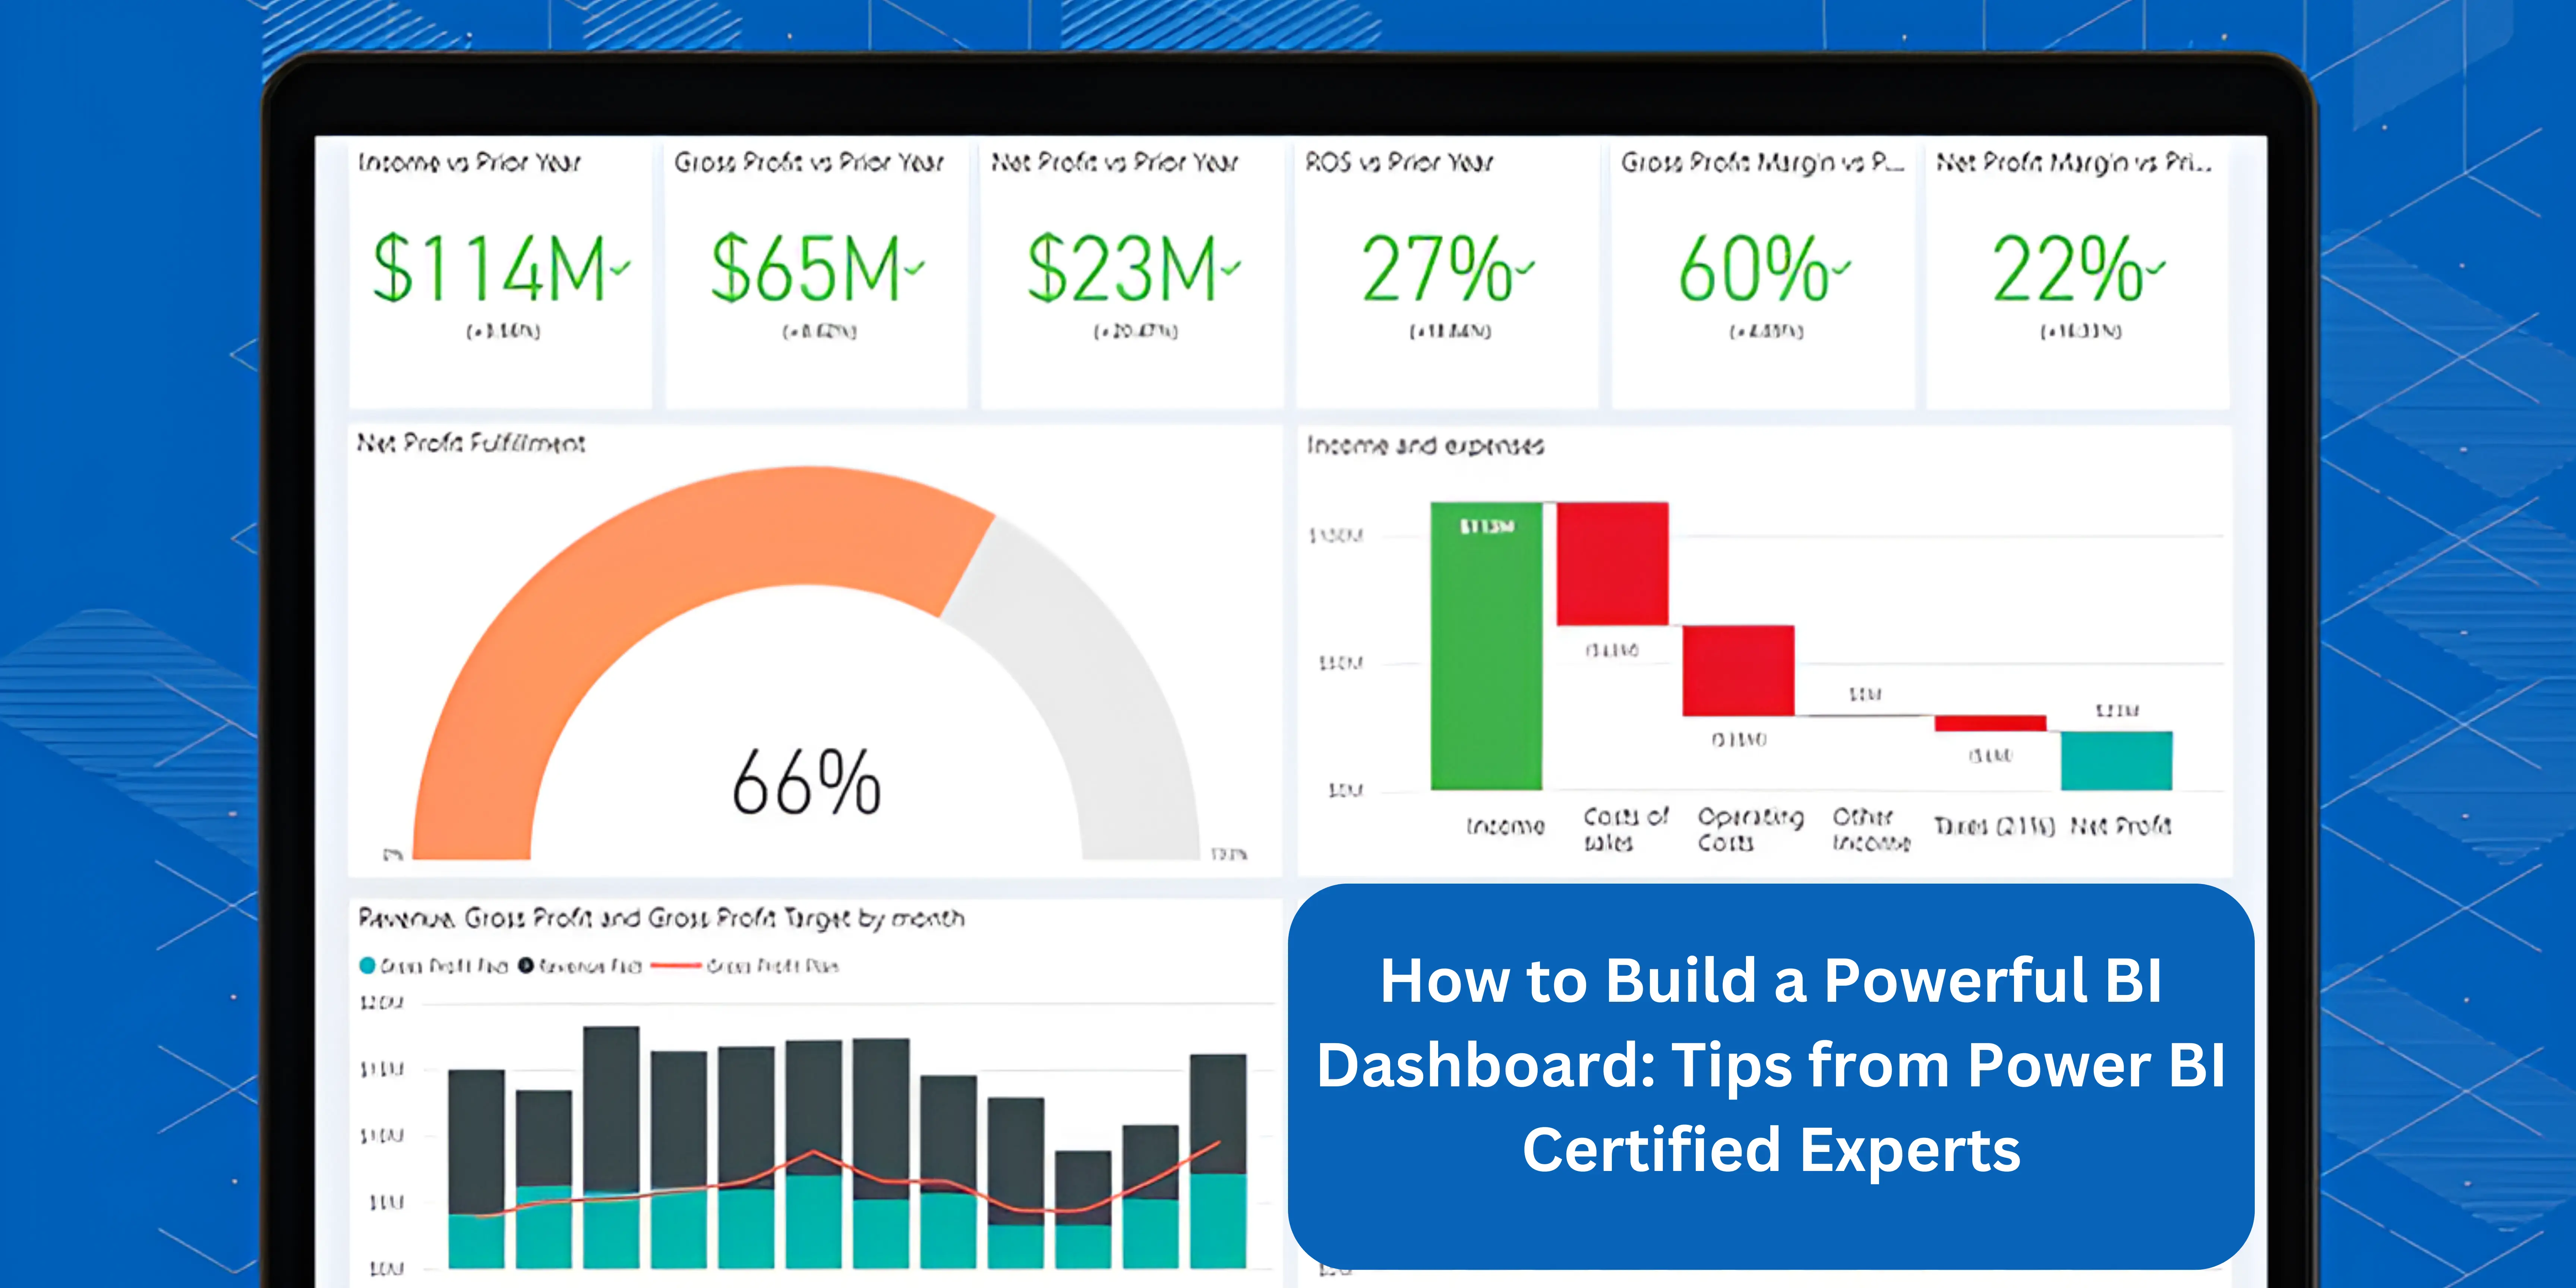
How to Build a Powerful BI Dashboard: Expert Power BI Tips
Are you looking to enhance your data visualization techniques and make better business decisions with the help of a powerful BI dashboard? Look no further! In this article, we will provide you with valuable insights and tips from Power BI certified experts on how to build an effective BI dashboard that will give you a competitive edge in the world of business intelligence.
Understanding the Basics of Business Intelligence Tools
Before diving into the tips for building a powerful BI dashboard, it is essential to understand the basics of business intelligence tools. Business intelligence tools are designed to help organizations make sense of their data by providing insights and analytics. These tools allow users to gather, store, analyze, and visualize data to make informed decisions.
Data Visualization Techniques for Effective Analysis
One of the key components of building a powerful BI dashboard is utilizing effective data visualization techniques. By visualizing data in a clear and concise manner, users can quickly interpret and analyze information. Some data visualization solutions you can use in your BI dashboard include charts, graphs, maps, and tables.
Effective data visualization is not only visually appealing but also helps in conveying complex information in a digestible format. Power BI experts recommend using different visualization types to present data in a way that is easy to understand and interpret.
Dashboard Design Tips for a User-Friendly Experience
When it comes to building a BI dashboard, the design plays a crucial role in ensuring a user-friendly experience. An effective dashboard layout should be intuitive, interactive, and visually appealing. Some dashboard design tips include using consistent color schemes, avoiding clutter, and organizing information in a logical manner.
Additionally, Power BI best practices suggest using dashboard development strategies that focus on user engagement and interaction. By incorporating interactive elements such as filters, slicers, and drill-through capabilities, users can explore data and gain deeper insights.
Data Analysis Skills for Informed Decision-Making
To make the most out of your BI dashboard, it is important to develop strong data analysis skills. Power BI experts emphasize the importance of understanding data trends, patterns, and anomalies to make informed decision-making. By honing your data analysis skills, you can extract valuable insights from your data and drive business growth.
Improving Dashboard Performance and Optimization
Another crucial aspect of building a powerful BI dashboard is improving performance and optimization. Power BI experts recommend optimizing your dashboard by streamlining data sources, utilizing efficient data models, and reducing unnecessary calculations. By improving dashboard performance, users can access information quickly and efficiently.
How to obtain Power BI Certification?
We are an Education Technology company providing certification training courses to accelerate careers of working professionals worldwide. We impart training through instructor-led classroom workshops, instructor-led live virtual training sessions, and self-paced e-learning courses.
We have successfully conducted training sessions in 108 countries across the globe and enabled thousands of working professionals to enhance the scope of their careers.
Our enterprise training portfolio includes in-demand and globally recognized certification training courses in Project Management, Quality Management, Business Analysis, IT Service Management, Agile and Scrum, Cyber Security, Data Science, and Emerging Technologies. Download our Enterprise Training Catalog from https://www.icertglobal.com/corporate-training-for-enterprises.php
Popular Courses include:
-
Project Management: PMP, CAPM ,PMI RMP
-
Quality Management: Six Sigma Black Belt ,Lean Six Sigma Green Belt, Lean Management, Minitab,CMMI
-
Business Analysis: CBAP, CCBA, ECBA
-
Agile Training: PMI-ACP , CSM , CSPO
-
Scrum Training: CSM
-
DevOps
-
Program Management: PgMP
-
Cloud Technology: Exin Cloud Computing
-
Citrix Client Adminisration: Citrix Cloud Administration
The 10 top-paying certifications to target in 2024 are:
Conclusion
In conclusion, building a powerful BI dashboard requires a combination of effective data visualization, user-friendly design, strong data analysis skills, and dashboard optimization. By following the tips and insights provided by Power BI certified experts, you can create impactful dashboards that drive data-driven decision-making and business success. Start building your powerful BI dashboard today and take your business intelligence to the next level!
Read More
Are you looking to enhance your data visualization techniques and make better business decisions with the help of a powerful BI dashboard? Look no further! In this article, we will provide you with valuable insights and tips from Power BI certified experts on how to build an effective BI dashboard that will give you a competitive edge in the world of business intelligence.
Understanding the Basics of Business Intelligence Tools
Before diving into the tips for building a powerful BI dashboard, it is essential to understand the basics of business intelligence tools. Business intelligence tools are designed to help organizations make sense of their data by providing insights and analytics. These tools allow users to gather, store, analyze, and visualize data to make informed decisions.
Data Visualization Techniques for Effective Analysis
One of the key components of building a powerful BI dashboard is utilizing effective data visualization techniques. By visualizing data in a clear and concise manner, users can quickly interpret and analyze information. Some data visualization solutions you can use in your BI dashboard include charts, graphs, maps, and tables.
Effective data visualization is not only visually appealing but also helps in conveying complex information in a digestible format. Power BI experts recommend using different visualization types to present data in a way that is easy to understand and interpret.
Dashboard Design Tips for a User-Friendly Experience
When it comes to building a BI dashboard, the design plays a crucial role in ensuring a user-friendly experience. An effective dashboard layout should be intuitive, interactive, and visually appealing. Some dashboard design tips include using consistent color schemes, avoiding clutter, and organizing information in a logical manner.
Additionally, Power BI best practices suggest using dashboard development strategies that focus on user engagement and interaction. By incorporating interactive elements such as filters, slicers, and drill-through capabilities, users can explore data and gain deeper insights.
Data Analysis Skills for Informed Decision-Making
To make the most out of your BI dashboard, it is important to develop strong data analysis skills. Power BI experts emphasize the importance of understanding data trends, patterns, and anomalies to make informed decision-making. By honing your data analysis skills, you can extract valuable insights from your data and drive business growth.
Improving Dashboard Performance and Optimization
Another crucial aspect of building a powerful BI dashboard is improving performance and optimization. Power BI experts recommend optimizing your dashboard by streamlining data sources, utilizing efficient data models, and reducing unnecessary calculations. By improving dashboard performance, users can access information quickly and efficiently.
How to obtain Power BI Certification?
We are an Education Technology company providing certification training courses to accelerate careers of working professionals worldwide. We impart training through instructor-led classroom workshops, instructor-led live virtual training sessions, and self-paced e-learning courses.
We have successfully conducted training sessions in 108 countries across the globe and enabled thousands of working professionals to enhance the scope of their careers.
Our enterprise training portfolio includes in-demand and globally recognized certification training courses in Project Management, Quality Management, Business Analysis, IT Service Management, Agile and Scrum, Cyber Security, Data Science, and Emerging Technologies. Download our Enterprise Training Catalog from https://www.icertglobal.com/corporate-training-for-enterprises.php
Popular Courses include:
-
Project Management: PMP, CAPM ,PMI RMP
-
Quality Management: Six Sigma Black Belt ,Lean Six Sigma Green Belt, Lean Management, Minitab,CMMI
-
Business Analysis: CBAP, CCBA, ECBA
-
Agile Training: PMI-ACP , CSM , CSPO
-
Scrum Training: CSM
-
DevOps
-
Program Management: PgMP
-
Cloud Technology: Exin Cloud Computing
-
Citrix Client Adminisration: Citrix Cloud Administration
The 10 top-paying certifications to target in 2024 are:
Conclusion
In conclusion, building a powerful BI dashboard requires a combination of effective data visualization, user-friendly design, strong data analysis skills, and dashboard optimization. By following the tips and insights provided by Power BI certified experts, you can create impactful dashboards that drive data-driven decision-making and business success. Start building your powerful BI dashboard today and take your business intelligence to the next level!